生态环境学报 ›› 2021, Vol. 30 ›› Issue (7): 1404-1411.DOI: 10.16258/j.cnki.1674-5906.2021.07.009
姚世庭1( ), 芦光新1,*(), 邓晔2,3, 党宁1, 王英成1, 张海娟1, 颜珲璘1
收稿日期:2021-02-03
出版日期:2021-07-18
发布日期:2021-10-09
通讯作者:
*芦光新,E-mail: lugx74@qq.com作者简介:姚世庭(1995年生)女,博士研究生,主要研究方向为高寒草地微生物多样性及功能利用。E-mail: 2317523428@qq.com
基金资助:
YAO Shiting1(), LU Guangxin1,*(), DENG Ye2,3, DANG Ning1, WANG Yingcheng1, ZHANG Haijuan1, YAN Huilin1
Received:2021-02-03
Online:2021-07-18
Published:2021-10-09
摘要:
为探讨温度变化后土壤微生物中真菌的变化情况,利用野外模拟增温小室(OTC)对青藏高原高寒草地0—15 cm和15—30 cm土层进行增温,采用Illumina-MiSeq高通量测序技术和成对的通用引物gITS-7F和4R对土壤真菌2区进行测序,研究青藏高原高寒草地生态系统中土壤真菌多样性对温度的响应,同时采用典型相关性分析方法研究土壤理化性质、地上植被指标以及环境三参数对土壤真菌的影响。研究表明,(1)真菌群落稀释性曲线发现物种的丰富度(observed species):Ma (0—15 cm不增温)>Mb (15—30 cm不增温)>Fb (15—30 cm增温)>Fa (0—15 cm对照)。(2)土壤真菌群落Alpha多样性指数表明,Shannon指数和Simpson指数均呈现Mb>Fb>Ma>Fa,而Chao1指数呈现Mb>Fa>Ma>Fb。说明相较于对照,增温会使真菌群落多样性有所降低。(3)通过测序分析,土壤中真菌检测出数量较多的门,包括子囊菌门(Ascomycota 47.4%—66.6%)、担子菌门(Basidiomycota 7.0%—14.8%)、接合菌门(Zygomycota 3.4%—17.2%)等,但依然有6.7%—38.7%无法鉴定到门的物种。(4)pH、微生物氮与真菌存在显著相关关系(P<0.05),相关系数分别为r=0.3218,r=0.2318。总之,研究发现增温使土壤真菌丰富度和群落多样性降低,优势菌种为子囊菌门、担子菌门和接合菌门,土壤pH和土壤微生物氮是高寒草地土壤真菌多样性的重要影响因子。研究结果可为预测全球变暖生态系统的变化方向提供数据基础。
中图分类号:
姚世庭, 芦光新, 邓晔, 党宁, 王英成, 张海娟, 颜珲璘. 模拟增温对土壤真菌群落组成及多样性的影响[J]. 生态环境学报, 2021, 30(7): 1404-1411.
YAO Shiting, LU Guangxin, DENG Ye, DANG Ning, WANG Yingcheng, ZHANG Haijuan, YAN Huilin. Effects of Simulated Warming on Soil Fungal Community Composition and Diversity[J]. Ecology and Environment, 2021, 30(7): 1404-1411.
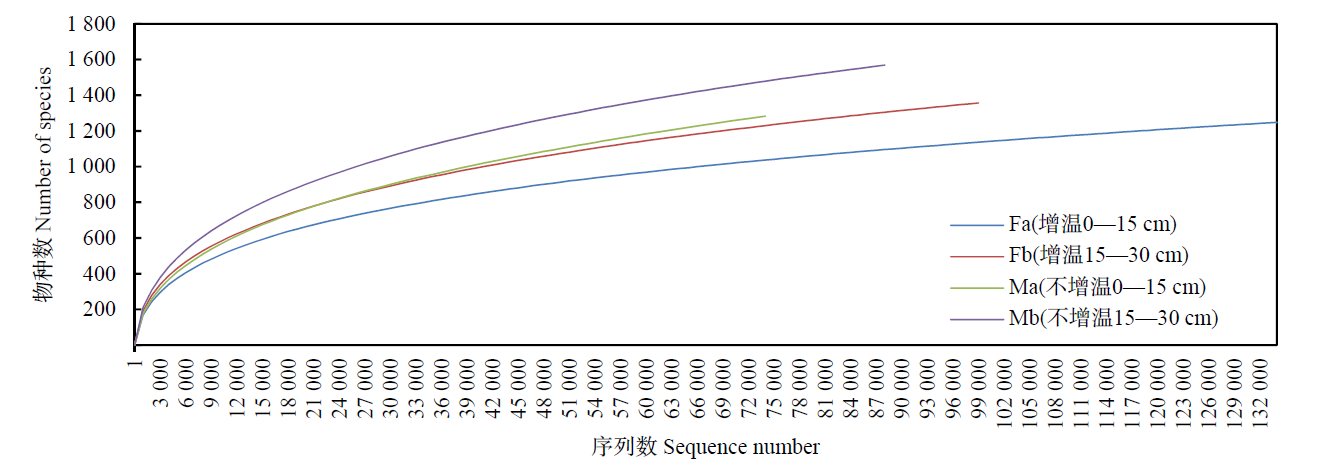
图1 土壤样品真菌群落的稀释曲线
Fig. 1 Dilution curve of fungal communities in soil samples
| 编号 Numbering | 土壤深度 Soil depth | 香农指数 Shannon index | 辛普森指数 Simpson index | Chao值 Chao1 index |
|---|---|---|---|---|
| Fa | 0‒15 cm | 3.25±0.32a | 7.19±1.89b | 860.98±173.02a |
| Fb | 15‒30 cm | 3.38±0.45a | 9.49±4.21b | 799.66±210.38a |
| Ma | 0‒15 cm | 3.35±0.56a | 7.62±3.50b | 899.40±209.22a |
| Mb | 15‒30 cm | 4.02±0.34a | 22.44±7.16a | 1015.62±366.09a |
表1 真菌群落Alpha多样性指数特征
Table 1 Alpha diversity index characteristics of fungal communities
| 编号 Numbering | 土壤深度 Soil depth | 香农指数 Shannon index | 辛普森指数 Simpson index | Chao值 Chao1 index |
|---|---|---|---|---|
| Fa | 0‒15 cm | 3.25±0.32a | 7.19±1.89b | 860.98±173.02a |
| Fb | 15‒30 cm | 3.38±0.45a | 9.49±4.21b | 799.66±210.38a |
| Ma | 0‒15 cm | 3.35±0.56a | 7.62±3.50b | 899.40±209.22a |
| Mb | 15‒30 cm | 4.02±0.34a | 22.44±7.16a | 1015.62±366.09a |
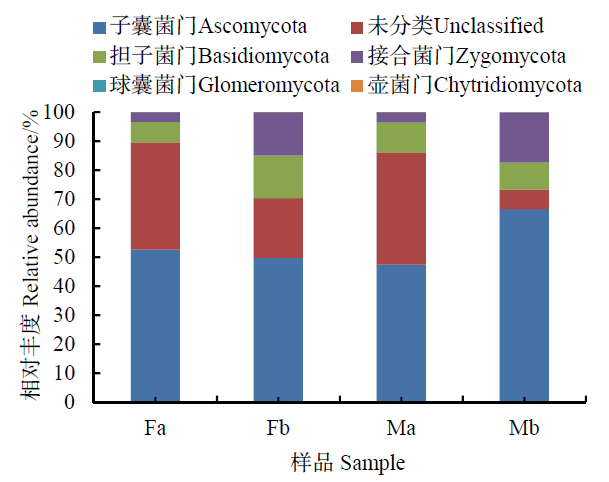
图2 真菌群落门水平相对丰度的比较
Fig. 2 Comparison of relative abundance of fungal community gate levels
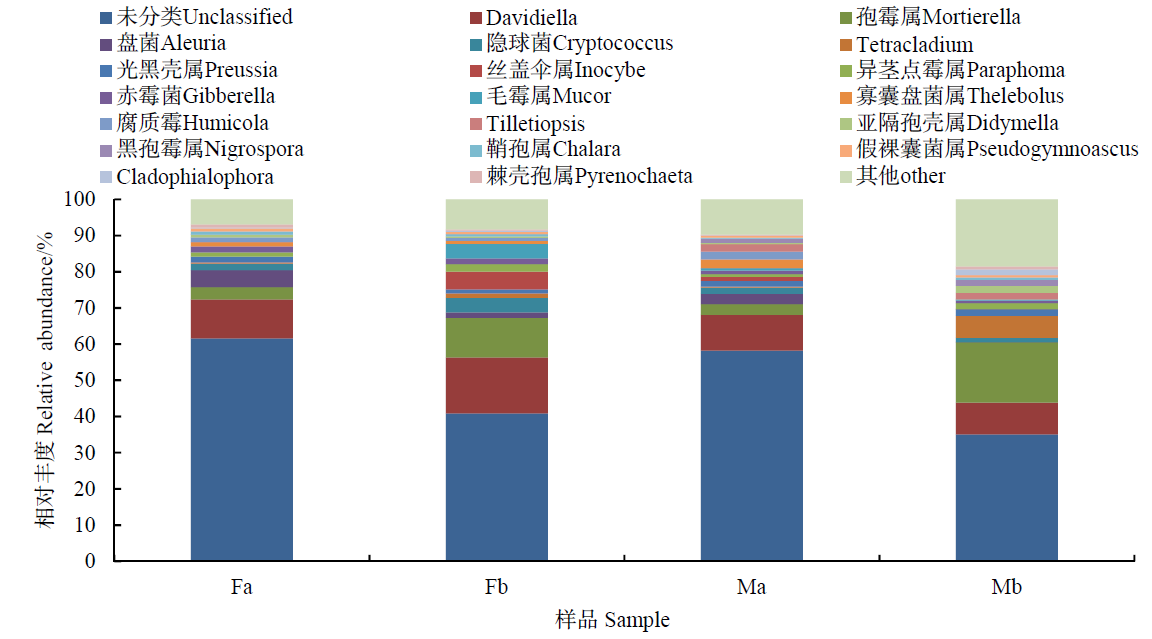
图3 真菌群落属水平相对丰度的比较
Fig. 3 Comparison of relative abundance of fungal community genus levels
| 因子 Factors | Bray-Curtis | Jaccard | |||
|---|---|---|---|---|---|
| F. Model | Pr (>F) | F. Model | Pr (>F) | ||
| Fa vs Fb | 0.8371 | 0.9 | 0.7785 | 0.8 | |
| Fa vs Ma | 0.7838 | 0.8 | 0.6862 | 0.5 | |
| Fa vs Mb | 0.8095 | 0.3 | 0.7562 | 0.2 | |
| Fb vs Ma | 0.8292 | 0.5 | 0.7722 | 1 | |
| Fb vs Mb | 0.8548 | 0.8 | 0.8422 | 0.5 | |
| Ma vs Mb | 0.8015 | 0.4 | 0.7498 | 0.4 | |
表2 不同样品Dissimilarity test差异检测
Table 2 Dissimilarity test for different samples
| 因子 Factors | Bray-Curtis | Jaccard | |||
|---|---|---|---|---|---|
| F. Model | Pr (>F) | F. Model | Pr (>F) | ||
| Fa vs Fb | 0.8371 | 0.9 | 0.7785 | 0.8 | |
| Fa vs Ma | 0.7838 | 0.8 | 0.6862 | 0.5 | |
| Fa vs Mb | 0.8095 | 0.3 | 0.7562 | 0.2 | |
| Fb vs Ma | 0.8292 | 0.5 | 0.7722 | 1 | |
| Fb vs Mb | 0.8548 | 0.8 | 0.8422 | 0.5 | |
| Ma vs Mb | 0.8015 | 0.4 | 0.7498 | 0.4 | |
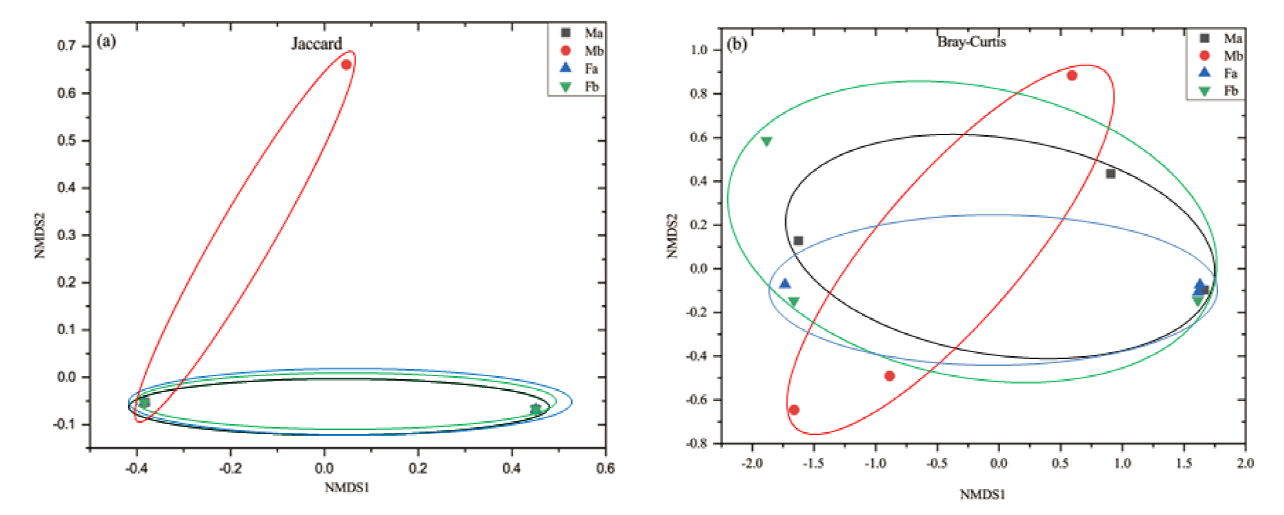
图4 不同处理土壤真菌的非度量多维尺度分析(NMDS)
Fig. 4 Non-metric multidimensional scaling analysis (NMDS) of soil fungi with different treatments
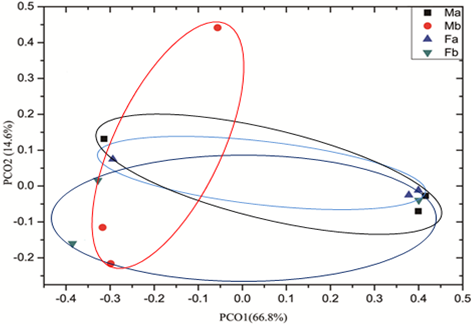
图5 不同处理土壤真菌主坐标分析
Fig. 5 Analysis of principal coordinates of soil fungi in different treatments
| 因子 Factor | NH4+-N | NO3--N | TN | AN | OM | pH | TC | SMBC | SMBN | HEIGHT | S | FW | T | SMC | EC |
|---|---|---|---|---|---|---|---|---|---|---|---|---|---|---|---|
| NH4+-N | 1 | ||||||||||||||
| NO3--N | 0.62* | 1 | |||||||||||||
| TN | 0.60* | 0.31 | 1 | ||||||||||||
| AN | 0.89** | 0.63* | 0.81** | 1 | |||||||||||
| OM | 0.61* | 0.24 | 0.98 | 0.79** | 1 | ||||||||||
| pH | -0.80** | -0.65* | -0.80** | -0.88*** | -0.73** | 1 | |||||||||
| TC | -0.61* | -0.53 | -0.81** | -0.86*** | -0.74** | 0.73** | 1 | ||||||||
| SMBC | 0.69* | 0.52 | 0.88*** | 0.84*** | 0.81** | -0.92* | -0.80** | 1 | |||||||
| SMBN | 0.72** | 0.48 | 0.91 | 0.89 | 0.87*** | -0.81** | -0.88*** | 0.85*** | 1 | ||||||
| HEIGHT | -0.34 | -0.15 | -0.07 | -0.20 | -0.13 | 0.10 | 0.13 | 0.13 | -0.11 | 1 | |||||
| S | 0.14 | 0.28 | -0.10 | 0.12 | -0.17 | -0.11 | -0.18 | 0.06 | -0.13 | -0.17 | 1 | ||||
| FW | 0.38 | 0.19 | -0.11 | 0.22 | -0.05 | -0.14 | -0.04 | 0.14 | -0.14 | -0.16 | 0.42 | 1 | |||
| T | 0.36 | 0.09 | -0.04 | 0.25 | -0.0014 | -0.14 | -0.07 | 0.25 | -0.03 | 0.25 | 0.08 | 0.82** | 1 | ||
| SMC | -0.01 | -0.01 | -0.41 | -0.17 | -0.34 | 0.23 | 0.32 | -0.14 | -0.45 | 0.25 | 0.08 | 0.82** | 0.86*** | 1 | |
| EC | 0.28 | 0.49 | 0.212 | 0.27 | 0.21 | -0.39 | -0.18 | 0.46 | 0.16 | 0.17 | 0.05 | 0.56 | 0.45 | 0.53 | 1 |
表3 环境因子相关关系
Table 3 Correlation between environmental factors
| 因子 Factor | NH4+-N | NO3--N | TN | AN | OM | pH | TC | SMBC | SMBN | HEIGHT | S | FW | T | SMC | EC |
|---|---|---|---|---|---|---|---|---|---|---|---|---|---|---|---|
| NH4+-N | 1 | ||||||||||||||
| NO3--N | 0.62* | 1 | |||||||||||||
| TN | 0.60* | 0.31 | 1 | ||||||||||||
| AN | 0.89** | 0.63* | 0.81** | 1 | |||||||||||
| OM | 0.61* | 0.24 | 0.98 | 0.79** | 1 | ||||||||||
| pH | -0.80** | -0.65* | -0.80** | -0.88*** | -0.73** | 1 | |||||||||
| TC | -0.61* | -0.53 | -0.81** | -0.86*** | -0.74** | 0.73** | 1 | ||||||||
| SMBC | 0.69* | 0.52 | 0.88*** | 0.84*** | 0.81** | -0.92* | -0.80** | 1 | |||||||
| SMBN | 0.72** | 0.48 | 0.91 | 0.89 | 0.87*** | -0.81** | -0.88*** | 0.85*** | 1 | ||||||
| HEIGHT | -0.34 | -0.15 | -0.07 | -0.20 | -0.13 | 0.10 | 0.13 | 0.13 | -0.11 | 1 | |||||
| S | 0.14 | 0.28 | -0.10 | 0.12 | -0.17 | -0.11 | -0.18 | 0.06 | -0.13 | -0.17 | 1 | ||||
| FW | 0.38 | 0.19 | -0.11 | 0.22 | -0.05 | -0.14 | -0.04 | 0.14 | -0.14 | -0.16 | 0.42 | 1 | |||
| T | 0.36 | 0.09 | -0.04 | 0.25 | -0.0014 | -0.14 | -0.07 | 0.25 | -0.03 | 0.25 | 0.08 | 0.82** | 1 | ||
| SMC | -0.01 | -0.01 | -0.41 | -0.17 | -0.34 | 0.23 | 0.32 | -0.14 | -0.45 | 0.25 | 0.08 | 0.82** | 0.86*** | 1 | |
| EC | 0.28 | 0.49 | 0.212 | 0.27 | 0.21 | -0.39 | -0.18 | 0.46 | 0.16 | 0.17 | 0.05 | 0.56 | 0.45 | 0.53 | 1 |
| 因子 Facter | 香农指数 Shannon index | 辛普森指数 Simpson index | Chao1指数 Chao1 index | PD指数 PD index |
|---|---|---|---|---|
| 铵态氮 NH4+-N | -0.359 | 0.132 | -0.489 | -0.49 |
| 硝态氮 NO3--N | -0.073 | 0.214 | -0.073 | -0.13 |
| 全氮 TN | 0.0289 | 0.323 | -0.346 | -0.39 |
| 碱解氮 AN | -0.25 | 0.236 | -0.372 | -0.51 |
| 有机质 OM | 0.009 | 0.311 | -0.359 | -0.4 |
| 酸碱度 pH | 0.0827 | -0.26 | 0.411 | 0.342 |
| 全碳 TC | 0.158 | -0.34 | 0.299 | 0.559 |
| 微生物量碳SMBC | -0.063 | 0.169 | -0.365 | -0.33 |
| 微生物量氮SMBN | -0.136 | 0.207 | -0.371 | -0.42 |
| 高度 HEIGHT | -0.066 | -0.54 | 0.191 | 0.296 |
| 物种数 S | 0.271 | 0.585* | 0.172 | -0.15 |
| 鲜重 FW | -0.244 | 0.061 | -0.258 | -0.33 |
| 温度 T | -0.539 | -0.45 | -0.243 | -0.25 |
| 土壤含水量SMC | -0.366 | -0.4 | -0.115 | -0.07 |
| 土壤电导率 EC | -0.032 | 0.107 | -0.371 | -0.2 |
表4 微生物多样性与土壤环境因子Pearson相关系数矩阵
Table 4 Pearson correlation coefficient matrix of microbial diversity and soil environmental factors
| 因子 Facter | 香农指数 Shannon index | 辛普森指数 Simpson index | Chao1指数 Chao1 index | PD指数 PD index |
|---|---|---|---|---|
| 铵态氮 NH4+-N | -0.359 | 0.132 | -0.489 | -0.49 |
| 硝态氮 NO3--N | -0.073 | 0.214 | -0.073 | -0.13 |
| 全氮 TN | 0.0289 | 0.323 | -0.346 | -0.39 |
| 碱解氮 AN | -0.25 | 0.236 | -0.372 | -0.51 |
| 有机质 OM | 0.009 | 0.311 | -0.359 | -0.4 |
| 酸碱度 pH | 0.0827 | -0.26 | 0.411 | 0.342 |
| 全碳 TC | 0.158 | -0.34 | 0.299 | 0.559 |
| 微生物量碳SMBC | -0.063 | 0.169 | -0.365 | -0.33 |
| 微生物量氮SMBN | -0.136 | 0.207 | -0.371 | -0.42 |
| 高度 HEIGHT | -0.066 | -0.54 | 0.191 | 0.296 |
| 物种数 S | 0.271 | 0.585* | 0.172 | -0.15 |
| 鲜重 FW | -0.244 | 0.061 | -0.258 | -0.33 |
| 温度 T | -0.539 | -0.45 | -0.243 | -0.25 |
| 土壤含水量SMC | -0.366 | -0.4 | -0.115 | -0.07 |
| 土壤电导率 EC | -0.032 | 0.107 | -0.371 | -0.2 |
| 因子 Factor | Bray-Curtis | Jaccard | |||
|---|---|---|---|---|---|
| r | P | r | P | ||
| 铵态氮 NH4+-N | -0.0893 | 0.754 | -0.0885 | 0.794 | |
| 硝态氮 NO3--N | 0.074 | 0.28 | 0.0038 | 0.462 | |
| 全氮 TN | -0.0013 | 0.462 | 0.0413 | 0.311 | |
| 碱解氮 AN | 0.0091 | 0.443 | -0.0106 | 0.515 | |
| 有机质 OM | -0.0978 | 0.799 | -0.056 | 0.648 | |
| 酸碱度 pH | 0.3571* | 0.017 | 0.3218* | 0.021 | |
| 全碳 TC | 0.0175 | 0.348 | 0.0347 | 0.293 | |
| 微生物量碳 SMBC | 0.2493* | 0.034 | 0.2318* | 0.046 | |
| 微生物量氮 SMBN | -0.0592 | 0.678 | -0.0296 | 0.595 | |
| 高度 HEIGHT | -0.032 | 0.487 | -0.0143 | 0.474 | |
| 物种数 S | -0.032 | 0.536 | -0.004 | 0.456 | |
| 鲜重 FW | -0.0992 | 0.788 | -0.0503 | 0.594 | |
| 温度 T | -0.1406 | 0.952 | -0.1155 | 0.9 | |
| 土壤含水量 SMC | -0.1059 | 0.839 | -0.0857 | 0.763 | |
| 土壤电导率 EC | 0.2692 | 0.052 | 0.1951 | 0.099 | |
表5 Partial Mantel test分析微生物群落结构与土壤环境因子
Table 5 Partial Mantel test analysis of microbial community structure and soil environmental factors
| 因子 Factor | Bray-Curtis | Jaccard | |||
|---|---|---|---|---|---|
| r | P | r | P | ||
| 铵态氮 NH4+-N | -0.0893 | 0.754 | -0.0885 | 0.794 | |
| 硝态氮 NO3--N | 0.074 | 0.28 | 0.0038 | 0.462 | |
| 全氮 TN | -0.0013 | 0.462 | 0.0413 | 0.311 | |
| 碱解氮 AN | 0.0091 | 0.443 | -0.0106 | 0.515 | |
| 有机质 OM | -0.0978 | 0.799 | -0.056 | 0.648 | |
| 酸碱度 pH | 0.3571* | 0.017 | 0.3218* | 0.021 | |
| 全碳 TC | 0.0175 | 0.348 | 0.0347 | 0.293 | |
| 微生物量碳 SMBC | 0.2493* | 0.034 | 0.2318* | 0.046 | |
| 微生物量氮 SMBN | -0.0592 | 0.678 | -0.0296 | 0.595 | |
| 高度 HEIGHT | -0.032 | 0.487 | -0.0143 | 0.474 | |
| 物种数 S | -0.032 | 0.536 | -0.004 | 0.456 | |
| 鲜重 FW | -0.0992 | 0.788 | -0.0503 | 0.594 | |
| 温度 T | -0.1406 | 0.952 | -0.1155 | 0.9 | |
| 土壤含水量 SMC | -0.1059 | 0.839 | -0.0857 | 0.763 | |
| 土壤电导率 EC | 0.2692 | 0.052 | 0.1951 | 0.099 | |
| [1] |
BERGSVEINSON J, PERKY B J, SHEEDY C, et al., 2018. Identifying the core bacterial and fungal communities within four agricultural biobeds used for the treatment of pesticide rinsates[J]. Journal of Applied Microbiology, 125(5): 1333-1342.
DOI URL |
| [2] |
CHENG L, ZHANG N F, YUAN M T, et al., 2017. Warming enhances old organic carbon decomposition through altering functional microbial communities[J]. The ISME Journal, 11: 1825-1835.
DOI URL |
| [3] | SCHOCH C L, SEIFERT K A, HUHNDORF S, et al., 2012. Fungal Barcoding Consortium. Nuclear ribosomal internal transcribed spacer (ITS) region as a universal DNA barcode marker for Fungi[J]. Proceedings of the National Academy of Sciences of the United States of America, 109(16): 6241-6246. |
| [4] | FILIPPIS F D, LAIOLA M, BLAIOTTA G, et al., 2017. Different amplicon targets for sequencing-based studies of fungal diversity[J]. Applied and Environmental Microbiology, 83(17): 5-17. |
| [5] |
GANS J, WOLINSKY M, DUNBAR J, 2005. Computational improvements reveal great bacterial diversity and high metal toxicity in soil[J]. Science, 309(5739): 1387-1390.
DOI URL |
| [6] |
GOHL D M, VANGAY P, GARBE J, et al., 2016. Systematic improvement of amplicon marker gene methods for increased accuracy in microbiome studies[J]. Nature Biotechnology, 34(9): 942-949.
DOI URL |
| [7] |
GUO Y J, WANG R L, ZHAO YN, et al., 2020. Study on the Relationship Between Microbial Composition and Living Environment in Important Medical Mites Based on Illumina MiSeq Sequencing Technology[J]. Journal of Medical Entomology, DOI: 10.1093/jme/tjaa034.
DOI |
| [8] | JANCZAK K J, HRYNKIEWICZ B K, ZNAJEWSKA Z, et al., 2018. Use of rhizosphere microorganisms in the biodegradation of PLA and PET polymers in compost soil[J]. International Biodeterioration & Biodegradation, 130: 65-75. |
| [9] |
JENKINSON D S, LADD J N, 1981. Microbial biomass in soil: Measurements and turnover[J]. Soil Biochemistry, 5: 415-471.
DOI URL |
| [10] |
MATEOS-RIVERA, YDE C, WILSON B, et al., 2016. The effect of temperature change on the microbial diversity and community structure along the chronosequence of the sub-arctic glacier forefield of Styggedalsbreen (Norway)[J]. FEMS Microbiology Ecology, DOI: 10.1093/femsec/fiw038.
DOI |
| [11] | MIAO C P, MI Q L, QIAO X G, et al., 2016. Rhizospheric fungi of Panax notoginseng: Diversity and antagonism to host phytopathogens[J]. Joumalof Ginseng Research, 40(2): 127-134. |
| [12] |
RODRIGUEZ-BLANCO A, SICARDI M, FRIONI L, et al., 2015. Plant genotype andnitrogen fertilization effects on abundance and diversity of diazotrophic bacteria associated with maize[J]. Biology and Fertility of Soils, 51(3): 391-402.
DOI URL |
| [13] |
TEDERSOO L, LINDAHL B, 2016. Fungal identification biases in microbiome projects[J]. Environmental Microbiology Reports, 8(5): 774-779.
DOI URL |
| [14] | WATSON T T, NELSON L M, NEILSEN D, et al., 2017. Soil amendments influence Pratylenchus penetrans populations, beneficial rhizosphere microorganisms, and growth of newly planted sweet cherry[J]. Applied Soil Ecology, 117-118: 212-220. |
| [15] |
WANG Z J, LU G X, YUAN M T, et al., 2019. Elevated temperature overrides the effects of N amendment in Tibetan grassland on soil microbiome[J]. Pergamon, DOI: 10.1016/j.soilbio.2019.107532.
DOI |
| [16] | XUE K, XIE J P, ZHOU A F, et al., 2016. Warming alters expressions of microbial functional genes important to ecosystem functioning[J]. Frontiers in Microbiology, 7: 668-669. |
| [17] |
YU H, DENG Y, HE Z L, et al., 2018. Elevated CO2 and Warming Altered Grassland Microbial Communities in Soil Top-Layers[J]. Frontiers in Microbiology, DOI: 10.3389/fmicb.2018.01790.
DOI |
| [18] | 鲍士丹, 2000. 土壤农化分析[M]. 第3版. 北京: 中国农业出版社: 106-108. |
| BAO S D, 2000. Soil Agrochemical Analysis[M]. Third Edition. Beijing: China Agriculture Press: 106-108. | |
| [19] | 程虎, 王紫泉, 周琨, 等, 2017. 木醋液对碱性土壤微生物数量及酶活性的影响[J]. 中国环境科学, 37(2): 696-701. |
| CHENG H, WANG Z Q, ZHOU K, et al., 2017. The effect of wood vinegar on the number of microorganisms and enzyme activities in alkaline soil[J]. China Environmental Science, 37(2): 696-701. | |
| [20] | 李定瑶, 2014. 青藏高原多年冻土区可培养微生物多样性及生长特性研究[D]. 兰州: 兰州大学. |
| LI D Y, 2014. Study on the diversity and growth characteristics of cultivable microorganisms in permafrost regions of the Qinghai-Tibet Plateau[D]. Lanzhou: Lanzhou University. | |
| [21] | 李容榕, 盛观星, 林小艳, 2020. 凯氏定氮法测定青海省不同地区羌活中全氮含量[J]. 山西大同大学学报(自然科学版), 36(2): 8-9. |
| LI R R, SHENG G X, LIN X Y, 2020. Kjeldahl method to determine the total nitrogen content of Qiang huo in different areas of Qinghai Province[J]. Journal of Shanxi Datong University (Natural Science Edition), 36(2): 8-9. | |
| [22] | 李欣, 李峰科, 芦光新, 等, 2017. 模拟增温对高寒草甸土壤三大类微生物数量的影响[J]. 青海畜牧兽医杂志, 47(2): 6-11. |
| LI X, LI F K, LU G X, et al., 2017. Effects of simulated warming on the quantity of three types of microorganisms in alpine meadow soil[J]. Qinghai Journal of Animal Husbandry and Veterinary Medicine, 47(2): 6-11. | |
| [23] | 李金彦, 2010. 土壤水解性氮的测定 (碱解扩散法)[J]. 农业科技与信息 (10): 15. |
| LI J Y, 2010. Determination of Soil Hydrolyzable Nitrogen (Alkaline Diffusion Method)[J]. Agricultural Science and Technology and Information (10): 15. | |
| [24] | 李志萍, 李维民, 吴福忠, 等, 2013. 川西亚高山森林林窗对不同关键时期土壤硝态氮和铵态氮的影响[J]. 水土保持学报, 27(6): 270-274. |
| LI ZH P, LIW M, WU F ZH, et al., 2013. Effects of forest gaps in subalpine forests of western Sichuan on soil nitrate nitrogen and ammonium nitrogen in different key periods[J]. Journal of Soil and Water Conservation, 27(6): 270-274. | |
| [25] | 林先贵, 陈瑞蕊, 胡君利, 2010. 土壤微生物资源管理应用技术与学科展望[J]. 生态学报, 30(24): 7029-7037. |
| LIN X G, CHEN R R, HU J L, 2010. Soil microbial resource management application technology and subject prospects[J]. Acta Ecologica Sinica, 30(24): 7029-7037. | |
| [26] | 刘国华, 叶正芳, 吴为中, 2012. 土壤微生物群落多样性解析法: 从培养到非培养[J]. 生态学报, 32(14): 4421-4433. |
|
LIU G H, YE Z F, WU W Z, 2012. Analysis of soil microbial community diversity: From cultivated to non-cultured[J]. Acta Ecologica Sinica, 32(14): 4421-4433.
DOI URL |
|
| [27] | 马骢毓, 2017. 民勤退耕区次生草地土壤微生物多样性研究及优势植物根际促生菌资源筛选[D]. 兰州: 甘肃农业大学, |
| MA C Y, 2017. Study on soil microbial diversity of secondary grassland and screening of dominant plant rhizosphere growth- promoting bacteria resources in the secondary grassland of the Minqin conversion area[D]. Lanzhou: Gansu Agricultural University. | |
| [28] | 马婷, 2013. 基于ASTER影像的吉林省土壤耕层生物量碳含量反演[D]. 长春: 吉林农业大学: 26-28. |
| MA T, 2013. Retrieval of carbon content of soil cultivated layer biomass in Jilin Province based on ASTER images[D]. Changchun: Jilin Agricultural University, 26-28. | |
| [29] | 牟雪洁, 赵昕奕, 饶胜, 等, 2016. 青藏高原生态屏障区近10年生态系统结构变化研究[J]. 北京大学学报 (自然科学版), 52(2): 279-286. |
| MOU X J, ZHAO X Y, RAO S, et al., 2016. changes in ecosystem structure and other research nearly 10 years of ecological barrier area of the Tibetan Plateau[J]. Acta Scientiarum Naturalium Universitatis Pekinensis, 52(2): 279-286. | |
| [30] | 苗杰, 李斐, 张加康, 等, 2019. 紫外分光光度法测定土壤硝态氮校正因数的优化[J]. 华北农学报, 34(S1): 204-212. |
| MIAO J, LI F, ZHANG J K, et al., 2019. Optimization of correction factor for determination of soil nitrate nitrogen by ultraviolet spectrophotometry[J]. Acta North China Agricultural Journal, 34(S1): 204-212. | |
| [31] | 朴世龙, 方精云, 2002. 1982—1999年青藏高原植被净第一性生产力及其时空变化田[J]. 自然资源学报, 17(3): 373-380. |
| PIAO SH L, FANG J Y, 2002. Net primary productivity and its temporal and spatial variation fields over the Tibetan Plateau from 1982 to 1999 [J]. Journal of Natural Resources, 17(3): 373-380. | |
| [32] | 斯贵才, 袁艳丽, 王建, 等, 2015. 围封对当雄县高寒草原土壤微生物和酶活性的影响[J]. 草业科学, 32(1): 1-10. |
| SI G C, YUAN Y L, WANG J, et al., 2015. Effects of enclosure on soil microbes and enzyme activities in alpine grassland of Dangxiong County[J]. Pratacultural Science, 32(1): 1-10. | |
| [33] | 盛玉钰, 丛静, 卢慧, 等, 2018. 神农架国家公园林线过渡带土壤真菌多样性[J]. 生态学报, 38(15): 5322-5330. |
| SHENG Y J, CONG J, LU H, et al., 2018. Diversity of soil fungi in the timberline transition zone of Shennongjia National Park[J]. Acta Ecologica Sinica, 38(15): 5322-5330. | |
| [34] | 温小成, 芦光新, 2015. 模拟增温和氮素添加对高寒草地植物群落的影响[J]. 草业与畜牧 (2): 38-43. |
| WEN X C, LU G X, 2015. Effects of simulated warming and nitrogen addition on plant communities in alpine grassland[J]. Planting and Animal Husbandry (2): 38-43. | |
| [35] | 王瑞琨, 2018. 用电位法测定土壤pH值[J]. 山西化工, 38(3): 64-65. |
| WANG R K, 2018. Determination of soil pH value by potentiometric method[J]. Shanxi Chemical Industry, 38(3): 64-65. | |
| [36] | 王楠, 潘小承, 王传宽, 等, 2020. 模拟酸雨对毛竹阔叶林过渡带土壤真菌结构及其多样性的影响[J]. 环境科学, 41(5): 2476-2484. |
| WANG N, PAN X C, WANG C K, et al., 2020. Effects of Simulated Acid Rain on Soil Fungi Diversity in the Transition Zone of Moso Bamboo and Broadleaf Forest[J]. Environmental Science, 41(5): 2476-2484. | |
| [37] | 王艳发, 魏士平, 崔鸿鹏, 等, 2016. 青藏高原冻土区土壤垂直剖面中微生物的分布与多样性[J]. 微生物学通报, 43(9): 1902-1917. |
| WANG Y F, WEI S P, CUI H P, et al., 2016. Distribution and diversity of microorganisms in vertical sections of soil in permafrost regions of the Qinghai-Tibet Plateau[J]. Microbiology Bulletin, 43(9): 1902-1917. | |
| [38] | 姚世庭, 芦光新, 李欣, 等, 2019. 模拟增温对青海省玉树州称多县高寒草甸土壤水分的影响研究[J]. 生态环境学报, 28(11): 2176-2184. |
| YAO S T, LU G X, LI X, et al., 2019. Effects of simulated warming on soil moisture of alpine meadows in Chengduo County, Yushu Prefecture, Qinghai Province[J]. Acta Eco-Environmental Sciences, 28(11): 2176-2184. | |
| [39] | 姚世庭, 芦光新, 王军邦, 等, 2020. 模拟增温对土壤电导率的影响[J]. 干旱区研究, 37(3): 598-606. |
| YAO S T, LU G X, WANG J B, et al., 2020. Effects of simulated warming on soil electrical conductivity[J]. Arid Zone Research, 37(3): 598-606. | |
| [40] |
周桔, 雷霆, 2007. 土壤微生物多样性影响因素及研究方法的现状与展望[[J]. 生物多样性, 15(3): 306-311.
DOI |
| ZHOU J, LEI T, 2007. The status quo and prospects of soil microbial diversity influencing factors and research methods[J]. Biodiversity, 15(3): 306-311. | |
| [41] | 张旭, 牛艳萍, 2014. 油浴加热法测定土壤样品中有机碳[J]. 黑龙江科技信息 (10): 77. |
| ZHANG X, NIU Y P, 2014. Determination of organic carbon in soil samples by oil bath heating method[J]. Heilongjiang Science and Technology Information (10): 77. |
| [1] | 姜永伟, 丁振军, 袁俊斌, 张峥, 李杨, 问青春, 王业耀, 金小伟. 辽宁省主要河流底栖动物群落结构及水质评价研究[J]. 生态环境学报, 2023, 32(5): 969-979. |
| [2] | 寇祝, 卿纯, 袁昌果, 李平. 西藏东北部热泉水中硫氧化菌的多样性及分布特征[J]. 生态环境学报, 2023, 32(5): 989-1000. |
| [3] | 杨春亮, 刘旻霞, 王千月, 苗乐乐, 肖音迪, 王敏. 单户与联户放牧经营下草玉梅与嵩草种群空间格局及其关联性[J]. 生态环境学报, 2023, 32(4): 651-659. |
| [4] | 李善家, 王兴敏, 刘海锋, 孙梦格, 雷雨昕. 河西走廊荒漠植物多样性及其对环境因子的响应[J]. 生态环境学报, 2023, 32(3): 429-438. |
| [5] | 刘桢迪, 宋艳宇, 王宪伟, 谭稳稳, 张豪, 高晋丽, 高思齐, 杜宇. 冻土区泥炭地植物生长及碳氮特征对模拟增温的响应[J]. 生态环境学报, 2022, 31(9): 1765-1772. |
| [6] | 周选博, 王晓丽, 马玉寿, 王彦龙, 罗少辉, 谢乐乐. 返青期休牧措施下高寒草甸主要植物种群的生态位变化特征[J]. 生态环境学报, 2022, 31(8): 1547-1555. |
| [7] | 姜倪皓, 张世浩, 张诗函. 哀牢山紫茎泽兰入侵群落主要物种种间联结及环境解释[J]. 生态环境学报, 2022, 31(7): 1370-1382. |
| [8] | 王英成, 姚世庭, 金鑫, 俞文政, 芦光新, 王军邦. 三江源区高寒退化草甸土壤细菌多样性的对比研究[J]. 生态环境学报, 2022, 31(4): 695-703. |
| [9] | 夏开, 邓鹏飞, 马锐豪, 王斐, 温正宇, 徐小牛. 马尾松次生林转换为湿地松和杉木林对土壤细菌群落结构和多样性的影响[J]. 生态环境学报, 2022, 31(3): 460-469. |
| [10] | 梁蕾, 马秀枝, 韩晓荣, 李长生, 张志杰. 模拟增温下凋落物对大青山油松人工林土壤温室气体通量的影响[J]. 生态环境学报, 2022, 31(3): 478-486. |
| [11] | 杨虎, 王佩瑶, 李小伟, 王继飞, 杨君珑. 贺兰山东坡不同植被类型的土壤真菌多样性及其群落结构[J]. 生态环境学报, 2022, 31(2): 239-247. |
| [12] | 薛文凯, 朱攀, 德吉, 郭小芳. 纳木措水体可培养丝状真菌优势种的时空特征研究[J]. 生态环境学报, 2022, 31(12): 2331-2340. |
| [13] | 李聪, 吕晶花, 陆梅, 杨志东, 刘攀, 任玉连, 杜凡. 滇东南亚热带土壤细菌群落对植被垂直带变化的响应[J]. 生态环境学报, 2022, 31(10): 1971-1983. |
| [14] | 何瑞, 蒋然, 杨芳, 张心凤, 林键銮, 朱小平, 彭松耀. 茂名近岸海域中、小型浮游动物群落特征及其与环境因子的关系[J]. 生态环境学报, 2022, 31(1): 142-150. |
| [15] | 刘小菊, 褚江涛, 张越, 单奇. 环境因子和火干扰因子对喀纳斯泰加林柳兰分布的影响[J]. 生态环境学报, 2022, 31(1): 37-43. |
| 阅读次数 | ||||||
|
全文 |
|
|||||
|
摘要 |
|
|||||