生态环境学报 ›› 2023, Vol. 32 ›› Issue (4): 651-659.DOI: 10.16258/j.cnki.1674-5906.2023.04.002
杨春亮( ), 刘旻霞(), 王千月, 苗乐乐, 肖音迪, 王敏
收稿日期:2022-12-25
出版日期:2023-04-18
发布日期:2023-07-12
通讯作者:
*刘旻霞(1972年生),女,教授,硕士研究生导师,研究方向为植物生态学和恢复生态学。E-mail: xiaminl@163.com作者简介:杨春亮(1997年生),男,硕士研究生,主要从事恢复生态学研究。E-mail: 3214510487@qq.com
基金资助:
YANG Chunliang(), LIU Minxia(), WANG Qianyue, MIAO Lele, XIAO Yindi, WANG Min
Received:2022-12-25
Online:2023-04-18
Published:2023-07-12
摘要:
为探究单户与联户放牧下植物种群的分布格局及形成机理,加深了解不同放牧经营方式下植物种群的竞争及资源利用方式,选择并优化牧场管理,为高寒牧场的经营管理及高寒草甸的植被恢复探索理论依据。以甘南高寒草甸为研究对象,采用点格局分析法,结合生物量、株高、盖度及丰富度稀疏化曲线探究了单户与联户放牧下主要物种草玉梅(Anemone rivularis)和嵩草(Kobresia myosuroides)的空间分布格局及其关联性。结果表明,(1)嵩草的生物量、株高、盖度在联户牧场较高,分别为37.3 g?m?2、22.1 cm、16.7%,而草玉梅的株高和盖度则在单户牧场更高,达13.7 cm和7.79%;群落稀疏化分析发现联户牧场的物种丰富度显著高于单户,联户牧场的植物种群能够更好的迭代更新,体现出联户放牧的优越性。(2)嵩草种群在单户牧场主要表现为随机分布,在联户牧场呈聚集分布向随机分布过度的趋势;草玉梅种群在单户和联户牧场均表现为聚集分布。(3)两者空间关联性以无关联为主,在小尺度上表现为负关联。(4)主成分分析(PCA)表明:单户牧场嵩草和草玉梅种群与土壤全氮(STN)、土壤有机碳(SOC)、土壤有机质(SOM)相关性强;联户牧场两种群与土壤电导率(SC)、土壤有机碳(SOC)、土壤有机质(SOM)、土壤含水量(SWC)相关性更强。研究表明,联户放牧更有利于草场的循环发展。两牧场除受放牧踩踏的影响外,单户牧场受放牧牲畜粪尿影响更大,联户牧场受降水量的影响更大,植物种群对不同放牧环境的适应性由其自身的生物学特性、种间关系及环境异质性共同决定。
中图分类号:
杨春亮, 刘旻霞, 王千月, 苗乐乐, 肖音迪, 王敏. 单户与联户放牧经营下草玉梅与嵩草种群空间格局及其关联性[J]. 生态环境学报, 2023, 32(4): 651-659.
YANG Chunliang, LIU Minxia, WANG Qianyue, MIAO Lele, XIAO Yindi, WANG Min. Spatial Pattern and Correlation of Populations of Anemone rivularis and Kobresia myosuroides under Single-household Management and Multi-household Management Grazing Patterns[J]. Ecology and Environment, 2023, 32(4): 651-659.
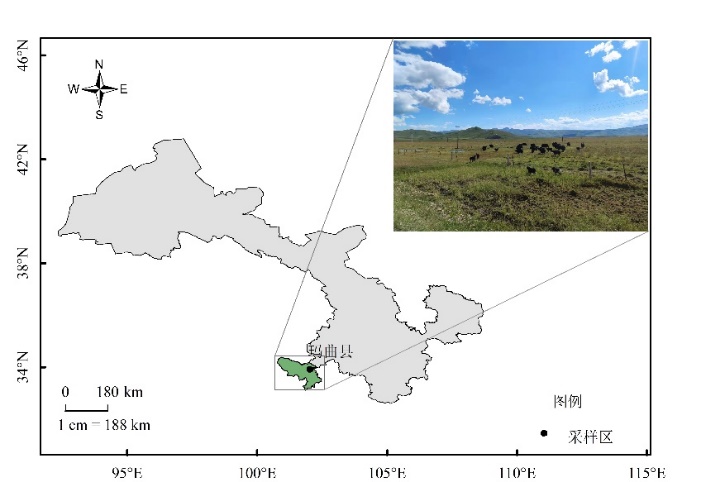
图1 研究区样地位置
Figure 1 Location of sample plot in study area
| 放牧方式 | 嵩草 Kobresia myosuroides | 草玉梅 Anemone rivularis | |||||
|---|---|---|---|---|---|---|---|
| 生物量/(g·m−2) | 株高/cm | 盖度/% | 生物量/(g·m−2) | 株高/cm | 盖度/% | ||
| 联户 | 36.73±0.60a | 21.76±0.33ab | 16.17±0.48a | 18.36±0.55a | 5.12±0.81c | 0.83±0.10b | |
| 单户 | 22.96±1.16b | 18.14±2.13b | 4.00±1.29b | 14.80±1.09b | 11.90±1.80b | 7.00±0.97a | |
表1 不同放牧方式两种群的变化特征
Table 1 Variation characteristics of two populations with different grazing ways
| 放牧方式 | 嵩草 Kobresia myosuroides | 草玉梅 Anemone rivularis | |||||
|---|---|---|---|---|---|---|---|
| 生物量/(g·m−2) | 株高/cm | 盖度/% | 生物量/(g·m−2) | 株高/cm | 盖度/% | ||
| 联户 | 36.73±0.60a | 21.76±0.33ab | 16.17±0.48a | 18.36±0.55a | 5.12±0.81c | 0.83±0.10b | |
| 单户 | 22.96±1.16b | 18.14±2.13b | 4.00±1.29b | 14.80±1.09b | 11.90±1.80b | 7.00±0.97a | |
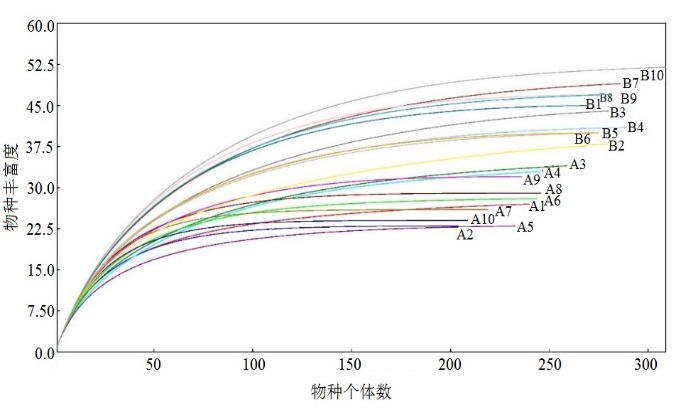
图2 群落稀疏化曲线图 A1-A10为单户牧场样方,B1-B10为联户牧场样方。横轴为样方中物种的个体数,纵轴为物种丰富度
Figure 2 Community thinning curve
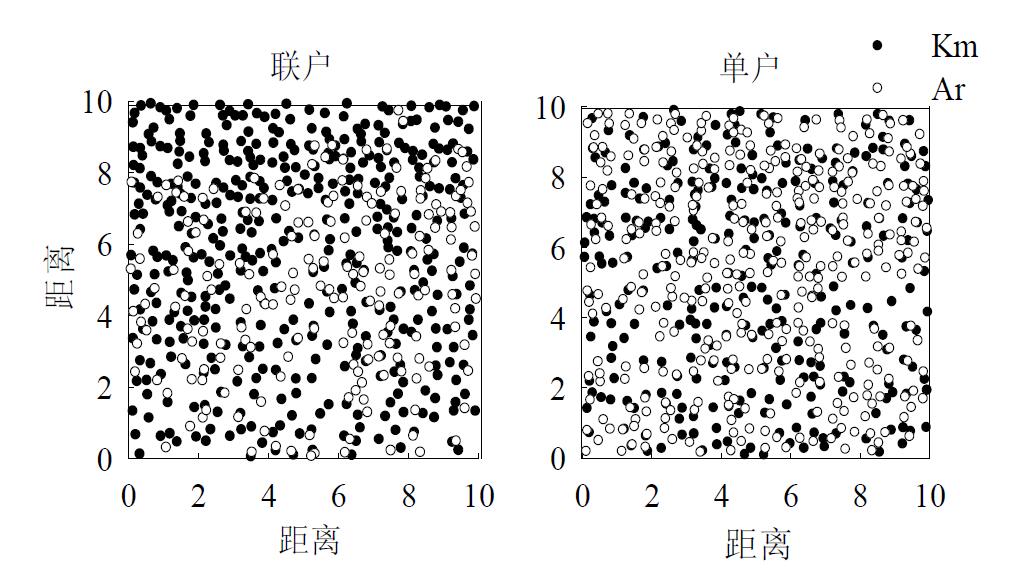
图3 联户与单户牧场嵩草与草玉梅空间分布散点图
Figure 3 Scatter diagram of spatial distribution of Kobresia myosuroides and Anemone rivularis in pasture with multi-household management pattern and single-household management pattern
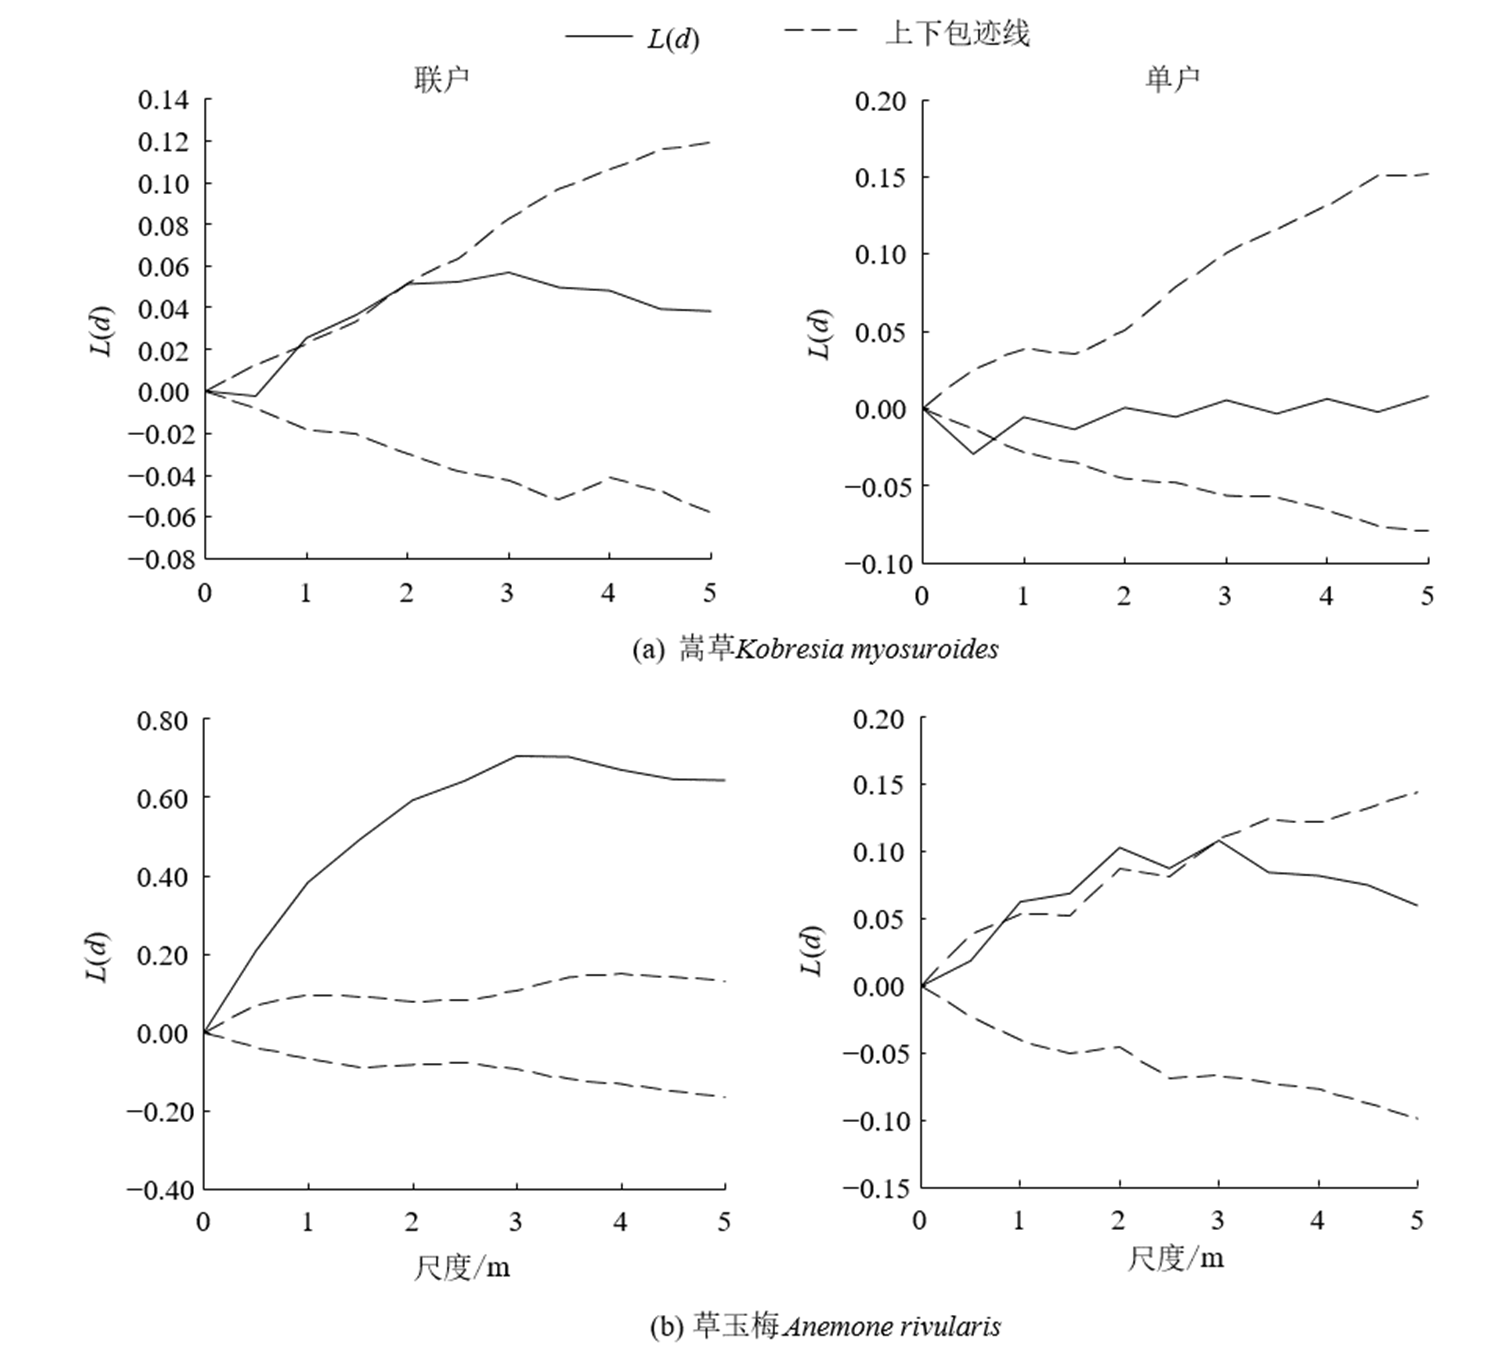
图4 联户与单户牧场嵩草(a)与草玉梅(b)点格局
Figure 4 Patterns of Kobresia myosuroides (a) and Anemone rivularis (b) spots with multi-household management pattern and single-household management pattern
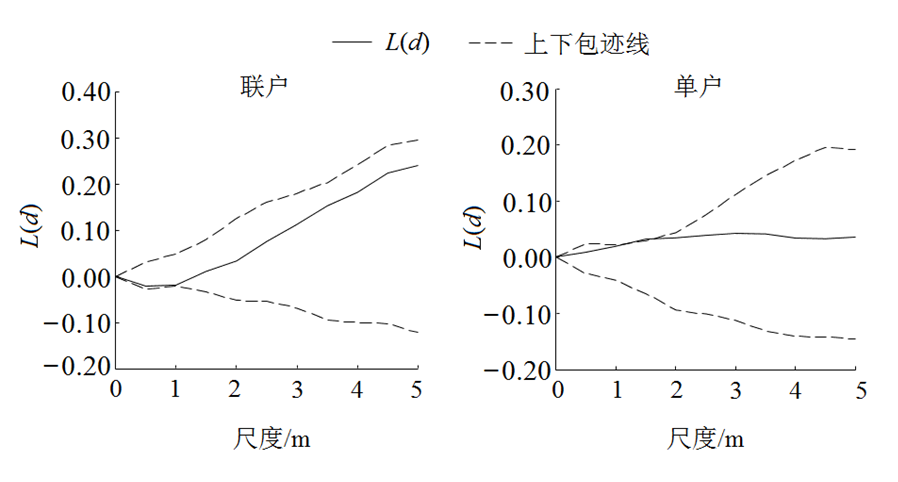
图5 两种群在联户与单户的关联性
Figure 5 Correlation between two populations in multi-household management pattern and single-household management pattern
| 类型 | SWC/% | SBD/(g∙m−2) | SC/(mS∙cm−1) | pH | w(STN)/(g∙kg−1) | w(STP)/(g∙kg−1) | w(SOC)/(g∙kg−1) | w(SOM)/(g∙kg−1) |
|---|---|---|---|---|---|---|---|---|
| 联户 | 13.59±0.08a | 1.29±0.29b | 80.02±1.62a | 6.45±0.20b | 4.39±0.44a | 4.66±0.17a | 49.97±0.29a | 97.67±0.49b |
| 单户 | 11.53±0.52b | 0.94±0.03c | 71.86±8.86a | 6.87±0.08b | 4.03±0.05b | 4.55±0.17a | 44.66±0.54a | 56.90±0.49c |
表2 联户与单户牧场土壤理化因子含量的变异
Table 2 Variation of soil physical and chemical factors in multi-household and single-household pattern
| 类型 | SWC/% | SBD/(g∙m−2) | SC/(mS∙cm−1) | pH | w(STN)/(g∙kg−1) | w(STP)/(g∙kg−1) | w(SOC)/(g∙kg−1) | w(SOM)/(g∙kg−1) |
|---|---|---|---|---|---|---|---|---|
| 联户 | 13.59±0.08a | 1.29±0.29b | 80.02±1.62a | 6.45±0.20b | 4.39±0.44a | 4.66±0.17a | 49.97±0.29a | 97.67±0.49b |
| 单户 | 11.53±0.52b | 0.94±0.03c | 71.86±8.86a | 6.87±0.08b | 4.03±0.05b | 4.55±0.17a | 44.66±0.54a | 56.90±0.49c |
| 类型 | 成分 | 初始特征值 | 指标 | 主成分 | |||
|---|---|---|---|---|---|---|---|
| 总计 | 方差百分比 | 累计/% | PC1 | PC2 | |||
| 单户 | 1 | 4.05 | 50.68 | 50.68 | SWC | 0.37 | 0.69 |
| 2 | 1.85 | 23.15 | 73.83 | SBD | −0.19 | 0.59 | |
| 3 | 0.89 | 11.06 | 84.88 | SC | 0.78 | −0.33 | |
| 4 | 0.70 | 8.79 | 93.67 | pH | −0.06 | −0.89 | |
| 5 | 0.36 | 4.44 | 98.11 | STN | 0.80 | −0.30 | |
| 6 | 0.10 | 1.28 | 99.39 | STP | −0.97 | 0.03 | |
| 7 | 0.05 | 0.61 | 100.00 | SOC | 0.87 | 0.40 | |
| 8 | 6.67×10⁻¹⁶ | 8.34×10⁻¹⁵ | 100.00 | SOM | 0.87 | 0.40 | |
| 联户 | 1 | 4.47 | 55.83 | 55.83 | SWC | 0.19 | 0.91 |
| 2 | 1.73 | 21.67 | 77.50 | SBD | 0.16 | 0.49 | |
| 3 | 0.89 | 11.06 | 88.56 | SC | 0.92 | 0.08 | |
| 4 | 0.60 | 7.43 | 95.99 | pH | 0.08 | −0.88 | |
| 5 | 0.20 | 2.57 | 98.56 | STN | 0.81 | 0.12 | |
| 6 | 0.08 | 1.00 | 99.56 | STP | −0.95 | −0.24 | |
| 7 | 0.04 | 0.43 | 100.00 | SOC | 0.94 | 0.08 | |
| 8 | 7.30×10⁻¹⁶ | 9.11×10⁻¹⁵ | 100.00 | SOM | 0.94 | 0.08 | |
表3 单户与联户主成分分析
Table 3 Principal constituen analysis of single-household and multi-household pattern
| 类型 | 成分 | 初始特征值 | 指标 | 主成分 | |||
|---|---|---|---|---|---|---|---|
| 总计 | 方差百分比 | 累计/% | PC1 | PC2 | |||
| 单户 | 1 | 4.05 | 50.68 | 50.68 | SWC | 0.37 | 0.69 |
| 2 | 1.85 | 23.15 | 73.83 | SBD | −0.19 | 0.59 | |
| 3 | 0.89 | 11.06 | 84.88 | SC | 0.78 | −0.33 | |
| 4 | 0.70 | 8.79 | 93.67 | pH | −0.06 | −0.89 | |
| 5 | 0.36 | 4.44 | 98.11 | STN | 0.80 | −0.30 | |
| 6 | 0.10 | 1.28 | 99.39 | STP | −0.97 | 0.03 | |
| 7 | 0.05 | 0.61 | 100.00 | SOC | 0.87 | 0.40 | |
| 8 | 6.67×10⁻¹⁶ | 8.34×10⁻¹⁵ | 100.00 | SOM | 0.87 | 0.40 | |
| 联户 | 1 | 4.47 | 55.83 | 55.83 | SWC | 0.19 | 0.91 |
| 2 | 1.73 | 21.67 | 77.50 | SBD | 0.16 | 0.49 | |
| 3 | 0.89 | 11.06 | 88.56 | SC | 0.92 | 0.08 | |
| 4 | 0.60 | 7.43 | 95.99 | pH | 0.08 | −0.88 | |
| 5 | 0.20 | 2.57 | 98.56 | STN | 0.81 | 0.12 | |
| 6 | 0.08 | 1.00 | 99.56 | STP | −0.95 | −0.24 | |
| 7 | 0.04 | 0.43 | 100.00 | SOC | 0.94 | 0.08 | |
| 8 | 7.30×10⁻¹⁶ | 9.11×10⁻¹⁵ | 100.00 | SOM | 0.94 | 0.08 | |
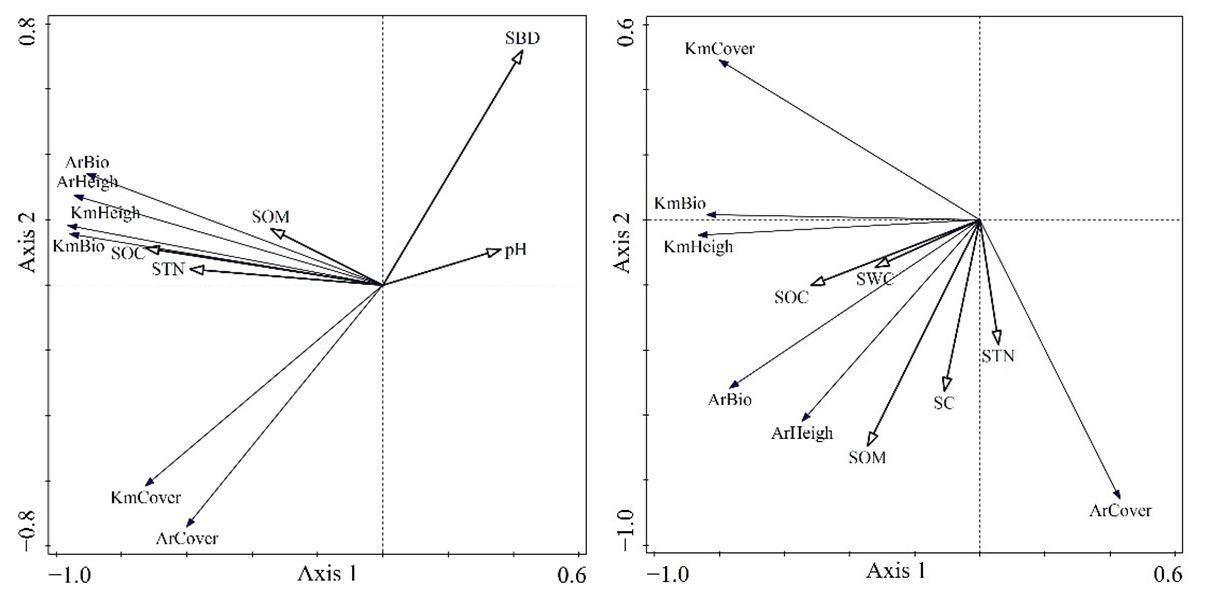
图6 嵩草和草玉梅种群性状与土壤因子的冗余分析,图左为单户,图右为联户 实心箭头连线代表两种群性状,空心箭头连线代表土壤因子,两类线条之间的夹角代表植物性状与土壤因子的相关性。Km Bio:嵩草生物量;Km Heigh:嵩草株高;Km cover:嵩草盖度;Ar Bio:草玉梅生物量;Ar Heigh:草玉梅株高;Ar cover:草玉梅盖度;STN:土壤全氮;SOC:土壤有机碳;SOM:土壤有机质;SBD:土壤容重;STP:土壤全磷;SC:电导率
Figure 6 Redundancy analysis of population traits and soil factors of Kobresia myosuroides and Anemone rivularis, with single-household management pattern on the left and multi-household management pattern on the right
| [1] |
BENNIE J, HUNTLEY B, WILTSHIRE A, 2008. Slope, aspect and climate: spatially explicit and implicit models of topographic microclimate in chalk grassland[J]. Ecological Modelling, 216(1): 47-59.
DOI URL |
| [2] |
BENOT M L, BITTEBIERE A K, ERNOULT A, 2013. Fine-scale spatial patterns in grassland communities depend on species clonal dispersal ability and interactions with neighbours[J]. Journal of Ecology, 101(3): 626-636.
DOI URL |
| [3] |
CHU G M, WANG M, ZHANG S X, 2014. Spatial patterns and associations of dominant woody species in desert-oasis ecotone of South Junggar Basin, NW China[J]. Journal of Plant Interactions, 9(1): 738-744.
DOI URL |
| [4] |
HAASE P, 1995. Spatial pattern analysis in ecology based on Ripley’s k-function: introduction and methods of edge correction[J]. Journal of Vegetation Science, 6(4): 575-582.
DOI URL |
| [5] |
HU L, WU X W, 2019. The difference in pollen harvest between Apis mellifera and Apis cerana in a Tibetan alpine meadow[J]. Journal of Mountain Science, 16(7): 1598-1605.
DOI |
| [6] |
KURTULUŞ C, YEKEN T, DURDAĞ D, 2019. Estimating the soil water content using electrical conductivity, oven method and speedy moisture tester[J]. Eurasian Soil Science, 52(12): 1577-1582.
DOI |
| [7] |
LI Y Z, ZHANG X Y, HU Z M, et al., 2022. Cultivation of non-irrigated spring wheat in temperate free-grazing steppe improved both ecosystem and canopy water use efficiency[J]. Science of The Total Environment, 803: 149948.
DOI URL |
| [8] |
LIU J, BAI X J, YIN Y, et al., 2021. Spatial patterns and associations of tree species at different developmental stages in a montane secondary temperate forest of northeastern China[J]. PeerJ, 9: e11517.
DOI URL |
| [9] |
LIU M X, ZHU L, MA Y B, et al., 2022. Response of species abundance distribution pattern of alpine meadow community to sampling scales[J]. The Rangeland Journal, 44(1): 13-24.
DOI URL |
| [10] |
LIU P C, WANG W D, BAI Z Q, et al., 2020. Competition and facilitation co-regulate the spatial patterns of boreal tree species in kanas of Xinjiang, northwest China[J]. Forest Ecology and Management, 467: 118167.
DOI URL |
| [11] |
LIU Y Y, LI F R, JIN G Z, 2014. Spatial patterns and associations of four species in an old-growth temperate forest[J]. Journal of Plant Interactions, 9(1): 745-753.
DOI URL |
| [12] |
OLAGOKE A O, BOSIRE J O, BERGER U, 2013. Regeneration of Rhizophora mucronata (Lamk.) in degraded mangrove forest: Lessons from point pattern analyses of local tree interactions[J]. Acta Oecologica, 50: 1-9.
DOI URL |
| [13] |
RONG Y P, MONACO T A, LIU Z K, et al., 2022. Soil microbial community structure is unaltered by grazing intensity and plant species richness in a temperate grassland steppe in northern China[J]. European Journal of Soil Biology, 110: 103404.
DOI URL |
| [14] |
VELÁZQUEZ E, MARTÍNEZ I, GETZIN S, et al., 2016. An evaluation of the state of spatial point pattern analysis in ecology[J]. Ecography, 39(11): 1042-1055.
DOI URL |
| [15] |
WAGNER S, WEHNERT A, WONG K Y, et al., 2016. Discovering interaction between oaks and carabid beetles on a local scale by point pattern analysis[J]. iForest-Biogeosciences and Forestry, 9(1): 618-625.
DOI URL |
| [16] |
XU H Y, LI L S, MAO N, et al., 2022. Physiological response of Kobresia pygmaea to temperature changes on the Qinghai-Tibet Plateau[J]. BMC Plant Biology, 22(1): 1-4.
DOI |
| [17] |
ZHAO J X, LI R C, TIAN L H, et al., 2022. Microtopographic heterogeneity mediates the soil respiration response to grazing in an alpine swamp meadow on the Tibetan Plateau[J]. CATENA, 213: 106158.
DOI URL |
| [18] |
ZHENG P R, LI C H, YE C, et al., 2022. Characteristic and affecting factors of wetland herbs’ distribution in the radiant belt toward land of lake-terrestrial ecotone in Tibet, China[J]. Environmental Sciences Europe, 34(1): 1-16.
DOI |
| [19] |
ZHU Z H, WANG X A, LI Y N, et al., 2012. Predicting plant traits and functional types response to grazing in an alpine shrub meadow on the Qinghai-Tibet Plateau[J]. Science China Earth Sciences, 55(5): 837-851.
DOI URL |
| [20] |
ZHUMANOVA M, WRAGE-MÖNNIG N, JURASINSKI G, 2021. Long-term vegetation change in the western Tien-Shan mountain pastures, Central Asia, driven by a combination of changing precipitation patterns and grazing pressure[J]. Science of The Total Environment, 781: 146720.
DOI URL |
| [21] |
曹建军, 许雪贇, 杨书荣, 等, 2017. 青藏高原不同草地利用方式产生的原因及其对社会-生态系统的影响研究进展[J]. 自然资源学报, 32(12): 2149-2159.
DOI |
| CAO J J, XU X Y, YANG S R, et al., 2017. Advance in the reasons for two different grassland use patterns formed and their each effects on the socio-ecological system on the Qinghai-Tibetan Plateau[J]. Journal of Natural Resources, 32(12): 2149-2159. | |
| [22] | 曹建军, 2013. 小尺度放牧对青藏高原草地影响研究[J]. 农村经济, 363(1): 109-110. |
| CAO J J, 2013. Effect of small-scale grazing on grassland in Qinghai-Tibet Plateau[J]. Rural Economy, 363(1): 109-110. | |
| [23] | 杜子银, 蔡延江, 张斌, 等, 2022. 牲畜排泄物返还对草地土壤氮转化和氧化亚氮(N2O)排放的影响研究进展[J]. 生态学报, 42(1): 45-57. |
| DU Z Y, CAI Y J, ZHANG B, et al., 2022. Research progress on livestock excreta returning on soil nitrogen transformation and nitrous oxide emission in grasslands[J]. Acta Ecologica Sinica, 42(1): 45-57. | |
| [24] | 李博文, 刘旻霞, 张娅娅, 等, 2019. 甘南高寒草甸不同海拔梯度乳白香青与长毛风毛菊的点格局分析[J]. 西北植物学报, 39(8): 1472-1479. |
| LI B W, LIU M X, ZHANG Y Y, et al., 2019. Analysis of point patterns of different altitude gradient of Anaphalis lactea and Saussurea hieracioides in Gannan alpine meadow[J]. Acta Botanica Boreali-Occidentalia Sinica, 39(8): 1472-1479. | |
| [25] | 李茜, 孙亚男, 林丽, 等, 2019. 放牧高寒嵩草草地不同演替阶段土壤酶活性及养分演变特征[J]. 应用生态学报, 30(7): 2267-2274. |
| LI Q, SUN Y N, LIN L, et al., 2019. Changes of soil enzyme activities and nutrients across different succession stages of grazing alpine Kobresia grassland[J]. Chinese Journal of Applied Ecology, 30(7): 2267-2274. | |
| [26] | 刘振国, 李镇清, 2004. 不同放牧强度下冷蒿种群小尺度空间格局[J]. 生态学报, 24(2): 227-234. |
| LIU Z G, LI Z Q, 2004. Fine-scale spatial pattern of Artemisia frigida population under different grazing intensities[J]. Acta Ecologica Sinica, 24(2): 227-234. | |
| [27] |
温智峰, 魏识广, 李林, 等, 2022. 南亚热带常绿阔叶林植物不同分类水平上的空间分布格局及空间关联[J]. 生态环境学报, 31(3): 440-450.
DOI URL |
| WEN Z F, WEI S G, LI L, et al., 2022. Spatial distribution patterns and spatial associations of evergreen broad-leaved forest plants in tropical South Asia at different taxonomic levels[J]. Ecology and Environmental Sciences, 31(3): 440-450. | |
| [28] | 张鸿南, 邹雯, 陈卓, 等, 2023. 藏东地区植物群落分布格局与环境因子的关系[J]. 应用与环境生物学报, 29(6): 1-10. |
| ZHANG H N, ZOU W, CHEN Z, et al., 2023. Distribution pattern of plant community and its relationship with environmental factors in eastern Tibet, China[J]. Chinese Journal of Applied and Environmental Biology, 29(6): 1-10. | |
| [29] | 张国娟, 刘旻霞, 李博文, 等, 2021. 玛曲高寒草甸植物黄帚橐吾与莓叶委陵菜种群点格局分析[J]. 生态学杂志, 40(6): 1660-1668. |
| ZHANG G J, LIU M X, LI B W, et al., 2021. Point pattern analysis of Ligularia virgaurea and Potentilla fragarioides populations in Maqu alpine meadow[J]. Chinese Journal of Ecology, 40(6): 1660-1668. | |
| [30] | 张金屯, 1998. 植物种群空间分布的点格局分析[J]. 植物生态学报, 22(4): 57-62. |
| ZHANG J T, 1998. Analysis of spatial point pattern for plant species[J]. Chinese Journal of Plant Ecology, 22(4): 344-349. | |
| [31] |
张兴旺, 张小平, 何俊洁, 等, 2012. 皇藏峪青檀次生林优势树种的空间分布格局及其关联性[J]. 生态环境学报, 21(12): 1943-1949.
DOI URL |
| ZHANG X W, ZHANG X P, HE J J, et al., 2012. Spatial distribution patterns and associations of dominant tree species in secondary forest of Pteroceltis tatarinowii in Huangcangyu nature reserve from Anhui province[J]. Ecology and Environmental Sciences, 21(12): 1943-1949. |
| [1] | 周选博, 王晓丽, 马玉寿, 王彦龙, 罗少辉, 谢乐乐. 返青期休牧措施下高寒草甸主要植物种群的生态位变化特征[J]. 生态环境学报, 2022, 31(8): 1547-1555. |
| [2] | 王英成, 姚世庭, 金鑫, 俞文政, 芦光新, 王军邦. 三江源区高寒退化草甸土壤细菌多样性的对比研究[J]. 生态环境学报, 2022, 31(4): 695-703. |
| [3] | 温智峰, 魏识广, 李林, 叶万辉, 练琚愉. 南亚热带常绿阔叶林植物不同分类水平上的空间分布格局及空间关联[J]. 生态环境学报, 2022, 31(3): 440-450. |
| [4] | 赵丽, 郭春燕, 张文军, 王晓江, 刘平生. 扎兰屯地区典型天然林群落特征及其相关性分析[J]. 生态环境学报, 2021, 30(7): 1353-1359. |
| [5] | 姚世庭, 芦光新, 邓晔, 党宁, 王英成, 张海娟, 颜珲璘. 模拟增温对土壤真菌群落组成及多样性的影响[J]. 生态环境学报, 2021, 30(7): 1404-1411. |
| [6] | 徐文印, 张宇鹏, 段成伟, 柴瑜, 宋娴, 李希来. 黄河源不同区域退化高寒草甸土壤养分空间变异研究[J]. 生态环境学报, 2021, 30(10): 1968-1975. |
| 阅读次数 | ||||||
|
全文 |
|
|||||
|
摘要 |
|
|||||