生态环境学报 ›› 2022, Vol. 31 ›› Issue (3): 512-523.DOI: 10.16258/j.cnki.1674-5906.2022.03.010
郝永佩1,2( ), 宋晓伟1,*(), 赵文珺3, 向发敏4
收稿日期:2021-11-14
出版日期:2022-03-18
发布日期:2022-05-25
通讯作者:
*宋晓伟(1987年生),男,副教授,博士,主要从事大气污染控制模拟研究。E-mail: xiaoweicool9418@126.com作者简介:郝永佩(1986年生),女,讲师,博士,研究方向为区域污染防治。E-mail: haoyongpei@sxufe.edu.cn
基金资助:
HAO Yongpei1,2(), SONG Xiaowei1,*(), ZHAO Wenjun3, XIANG Famin4
Received:2021-11-14
Online:2022-03-18
Published:2022-05-25
摘要:
汾渭平原已成为中国空气污染最严重的区域之一。为深入探究汾渭平原大气污染物浓度变化特征和相关因子对大气污染物浓度的影响,基于2014—2020年污染物PM2.5、PM10、NO2、CO、SO2和O3_8 h_max监测数据,利用统计学方法分析了汾渭平原11个城市6种污染物质量浓度的时空变化特征,在此基础上评估其与相关因子之间的关系。结果表明,2014—2020年污染物PM2.5、PM10、NO2、CO和SO2年均质量浓度整体上呈现波动下降趋势,而污染物O3_8 h_max却呈现上升趋势。污染物质量浓度变化呈现显著的季节性特征,前5种污染物表现为夏季最低,春秋次之,冬季最高特征,而O3_8 h_max则表现为夏季最高。空间上,污染物PM2.5、PM10和NO2空间分布格局呈现南高北低的特征,而CO和SO2则呈现出中北部城市较高、南部较低的特征;O3_8 h_max空间分布在2017年前呈现南高北低,2017年后北高南低的特征。人口暴露主要集中在高于55 μg∙m-3的PM2.5年均质量浓度中,呈现高密度人口集聚在高污染区的特征;而随着污染物O3_8 h_max年均质量浓度逐年上升,人口暴露在高浓度O3污染中的比例逐年上升。气象因子上,各主要污染物浓度年际变化与气温、降水和气压关系密切,除与降水呈现负相关性之外,与其他气象因子的相关关系呈现出不同特征。该研究可为汾渭平原大气污染防控及区域联防治理提供参考。
中图分类号:
郝永佩, 宋晓伟, 赵文珺, 向发敏. 汾渭平原大气污染时空分布及相关因子分析[J]. 生态环境学报, 2022, 31(3): 512-523.
HAO Yongpei, SONG Xiaowei, ZHAO Wenjun, XIANG Famin. Spatiotemporal Distribution of Air Pollution and Correlation Factors in Fenwei Plain[J]. Ecology and Environment, 2022, 31(3): 512-523.
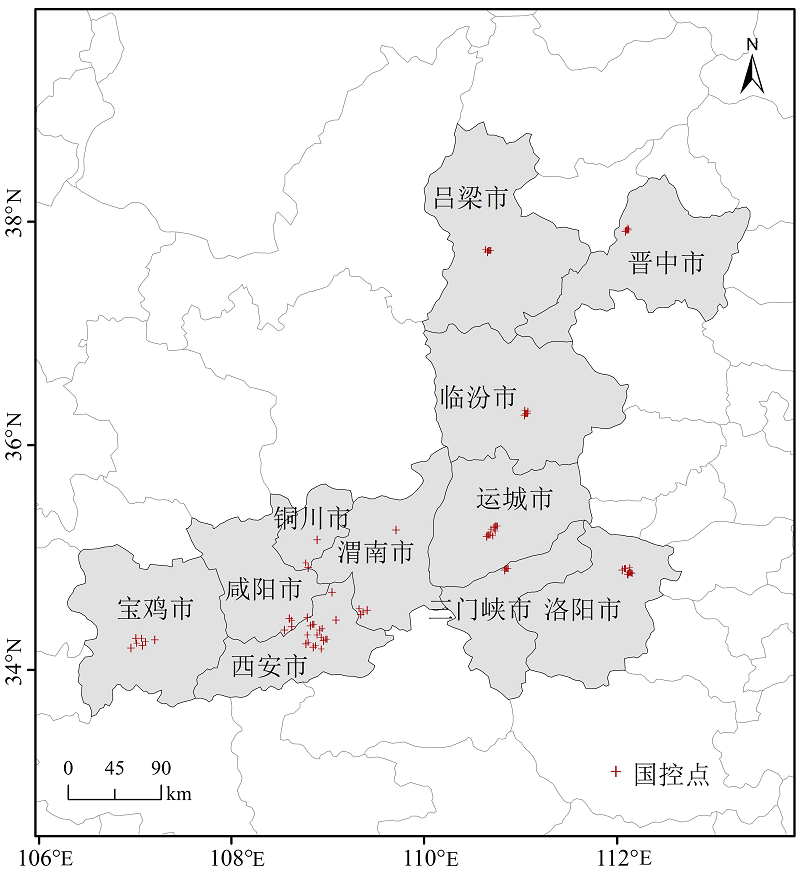
图1 汾渭平原空气监测站点分布图
Figure 1 Distribution of air monitoring stations in Fenwei Plain
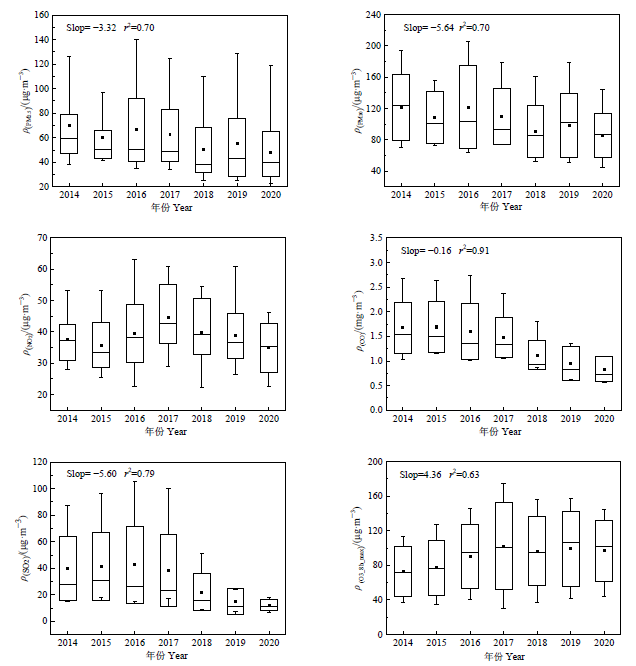
图2 2014—2020年汾渭平原大气污染物的年际变化
Figure 2 Interannual variations of air pollutants in Fenwei Plain from 2014 to 2020
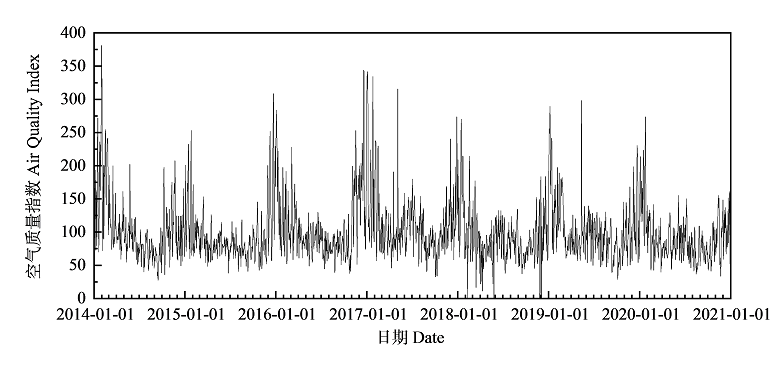
图3 汾渭平原AQI长序列变化趋势
Figure 3 Long-term trends of AQI sequences in Fenwei Plain
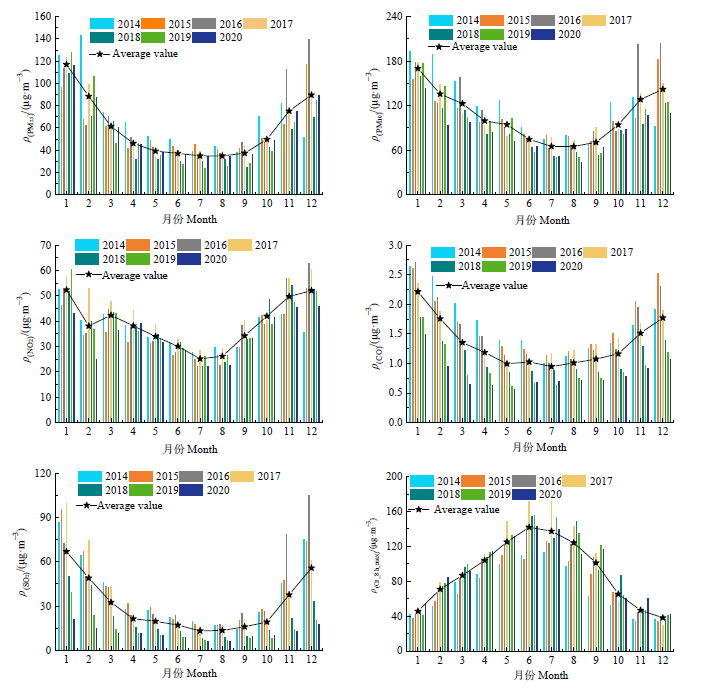
图4 2014—2020年汾渭平原大气污染的月变化图
Figure 4 Monthly variations of air pollutants in Fenwei Plain from 2014 to 2020
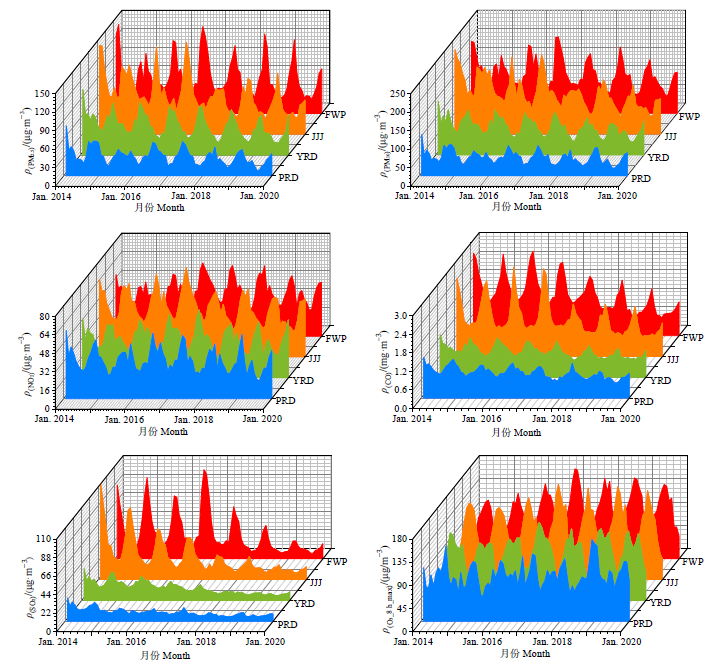
图5 2014—2020年中国四大污染区域大气污染物月变化特征图中PRD、YRD、JJJ和FWP分别代表珠三角、珠三角、京津冀和汾渭平原地区
Figure 5 Monthly variations of air pollutants in four regions of China in 2014-2020 PRD, YRD, JJJ, and FWP represents Pearl River Delta, Yangtze River Delta, Jing-Jin-Ji, and Fenwei Plain, respectively
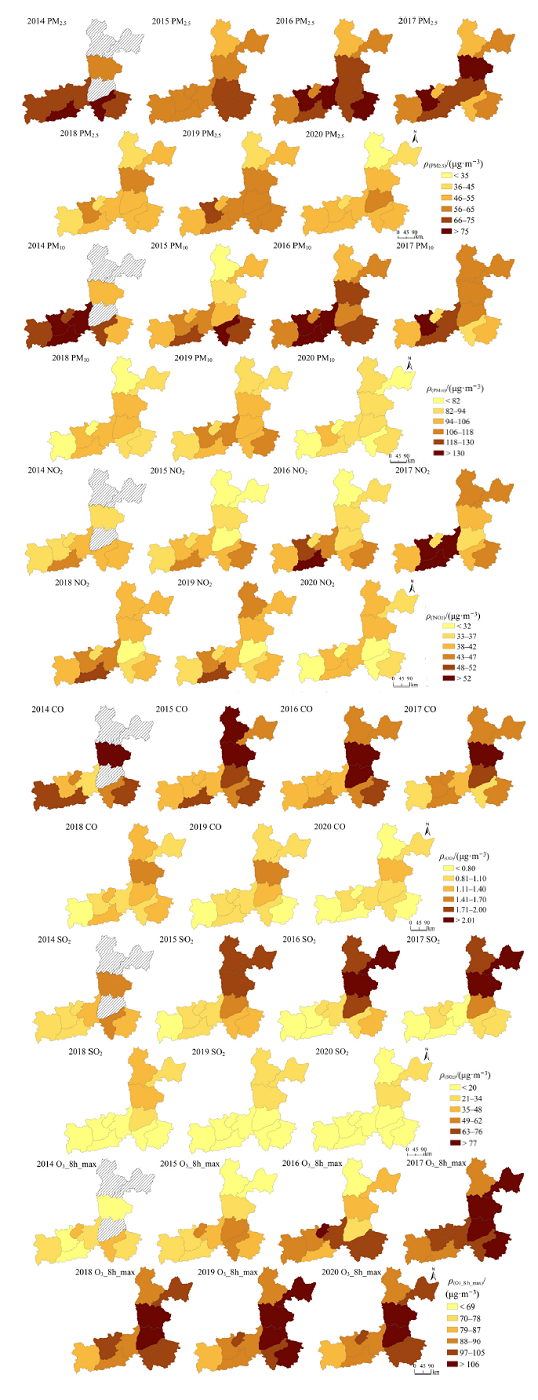
图6 2014—2020年汾渭平原大气污染的空间分布图
Figure 6 Spatial distributions of air pollutants in Fenwei Plain from 2014 to 2020
| 年份 Year | 莫兰指数 Moran's I | T值 T value | 热点 Hot spot | 冷点 Cold spot |
|---|---|---|---|---|
| 2014 | 0.289 | 3.214 | ||
| 2015 | 0.391 | 4.412 | 洛阳 | |
| 2016 | 0.587 | 6.723 | 咸阳、西安 | 宝鸡 |
| 2017 | 0.761 | 8.042 | 西安、咸阳、临汾 | 宝鸡、铜川 |
| 2018 | 0.714 | 8.665 | 西安、咸阳、临汾 | 宝鸡、铜川 |
| 2019 | 0.703 | 4.574 | 西安、咸阳、临汾 | 宝鸡、铜川、吕梁 |
| 2020 | 0.698 | 4.051 | 西安、咸阳、临汾 | 宝鸡、铜川、吕梁 |
表1 汾渭平原不同年份AQI空间自相关分析
Table 1 AQI spatial autocorrelation analysis of Fenwei Plain in different years
| 年份 Year | 莫兰指数 Moran's I | T值 T value | 热点 Hot spot | 冷点 Cold spot |
|---|---|---|---|---|
| 2014 | 0.289 | 3.214 | ||
| 2015 | 0.391 | 4.412 | 洛阳 | |
| 2016 | 0.587 | 6.723 | 咸阳、西安 | 宝鸡 |
| 2017 | 0.761 | 8.042 | 西安、咸阳、临汾 | 宝鸡、铜川 |
| 2018 | 0.714 | 8.665 | 西安、咸阳、临汾 | 宝鸡、铜川 |
| 2019 | 0.703 | 4.574 | 西安、咸阳、临汾 | 宝鸡、铜川、吕梁 |
| 2020 | 0.698 | 4.051 | 西安、咸阳、临汾 | 宝鸡、铜川、吕梁 |
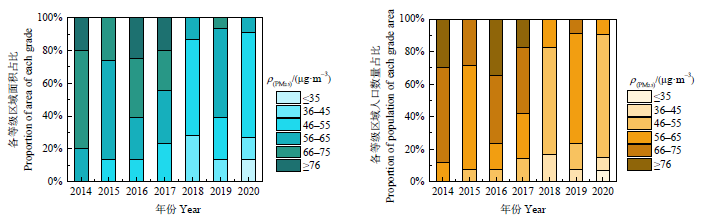
图7 2014—2020年汾渭平原PM2.5质量浓度区间面积(左)及人口暴露数量(右)占比变化
Figure 7 Changes of PM2.5 annual concentration by range and population exposure in Fenwei Plain from 2014 to 2020
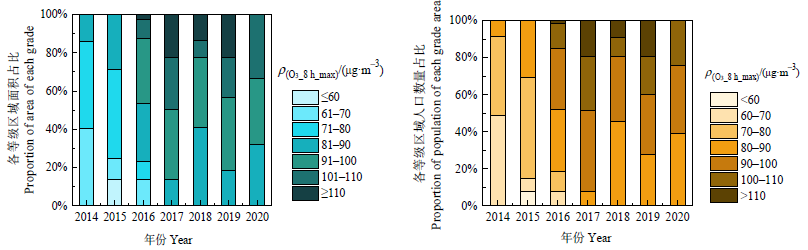
图8 2014—2020年汾渭平原O3_8 h_max质量浓度区间面积(左)及人口暴露数量(右)占比变化
Figure 8 Changes of O3_8 h_max annual concentration by range and population exposure in Fenwei Plain from 2014 to 2020
| 气象因子 Meteorological factors | PM2.5 | PM10 | NO2 | CO | SO2 | O3 |
|---|---|---|---|---|---|---|
| 气温 Air temperature | -0.455** | -0.384** | -0.435** | -0.439** | -0.424** | 0.728** |
| 相对湿度 Relative humidity | 0.073** | -0.119** | -0.114** | 0.011* | -0.251** | -0.175** |
| 气压 Air pressure | 0.191** | 0.181** | 0.179** | 0.247** | 0.142** | -0.247** |
| 降水 Precipitation | -0.109** | -0.167** | -0.171** | -0.073** | -0.129** | -0.036** |
| 风速 Wind velocity | -0.131** | -0.069** | 0.003* | -0.105** | 0.000* | 0.201** |
| 日照时数 Sunshine duration | -0.069** | -0.035** | -0.011* | -0.043** | 0.015* | 0.025** |
表2 汾渭平原年尺度主要污染物与气象因子的相关关系
Table 2 Correlations of main pollutants with meteorological factors in Fenwei Plain
| 气象因子 Meteorological factors | PM2.5 | PM10 | NO2 | CO | SO2 | O3 |
|---|---|---|---|---|---|---|
| 气温 Air temperature | -0.455** | -0.384** | -0.435** | -0.439** | -0.424** | 0.728** |
| 相对湿度 Relative humidity | 0.073** | -0.119** | -0.114** | 0.011* | -0.251** | -0.175** |
| 气压 Air pressure | 0.191** | 0.181** | 0.179** | 0.247** | 0.142** | -0.247** |
| 降水 Precipitation | -0.109** | -0.167** | -0.171** | -0.073** | -0.129** | -0.036** |
| 风速 Wind velocity | -0.131** | -0.069** | 0.003* | -0.105** | 0.000* | 0.201** |
| 日照时数 Sunshine duration | -0.069** | -0.035** | -0.011* | -0.043** | 0.015* | 0.025** |
| [1] |
ADAME J A, NOTARIO A, VILLANUEVA F, et al., 2012. Application of cluster analysis to surface ozone, NO2 and SO2 daily patterns in an industrial area in Central-Southern Spain measured with a DOAS system[J]. Science of The Total Environment, 429: 281-291.
DOI URL |
| [2] |
FAN H, ZHAO C F, YANG Y K, 2020. A comprehensive analysis of the spatio-temporal variation of urban air pollution in China during 2014-2018 [J]. Atmospheric Environment, 220: 117066.
DOI URL |
| [3] | KAISE R J, 2005. Epidemiology: Mounting evidence indicts fine-particle pollution[J]. Science, 307(5717): 1858-1861. |
| [4] |
LEE B K, LEE H K, JUN N Y, 2006. Analysis of regional and temporal characteristics of PM10 during an Asian dust episode in Korea[J]. Chemosphere, 63(7): 1106-1115.
DOI URL |
| [5] |
LEE H L, GU M J, KIM Y J, et al., 2012. First-time remote sensing of NO2 vertical distributions in an urban street canyon using Topographic Target Light scattering Differential Optical Absorption Spectroscopy (ToTaL-DOAS)[J]. Atmospheric Environment, 54: 519-528.
DOI URL |
| [6] |
LI L, LU C, CHAN P W, et al., 2020. Tower observed vertical distribution of PM2.5, O3 and NOx in the Pearl River Delta[J]. Atmospheric Environment, 220: 117083.
DOI URL |
| [7] |
MA X Y, JIA H L, SHA T, et al., 2019. Spatial and seasonal characteristics of particulate matter and gaseous pollution in China: Implications for control policy[J]. Environmental Pollution, 248: 421-428.
DOI URL |
| [8] |
MENG Z Y, XU X B, WANG T, et al., 2010. Ambient sulfur dioxide,nitrogen dioxide, and ammonia at ten background and rural sites in China during 2007-2008 [J]. Atmospheric Environment, 44(21-22): 2625-2631.
DOI URL |
| [9] |
SHAO M, TANG X Y, ZHANG Y H, et al., 2006. City clusters in China: Air and surface water pollution[J]. Frontiers in Ecology and the Environment, 4(7): 353-361.
DOI URL |
| [10] |
WANG Y G, YING Q, HU J L, et al., 2014. Spatial and temporal variations of six criteria air pollutants in 31 provincial capital cities in China during 2013-2014 [J]. Environment International, 73: 413-422.
DOI URL |
| [11] | XU W J, ZENG Z T, XU Z Y, et al., 2020. Public health benefits of optimizing urban industrial land layout - The case of Changsha, China[J]. Environment International, 263(Part B): 114388. |
| [12] |
ZHAO H, ZHENG Y F, LI C, 2018. Spatiotemporal distribution of PM2.5 and O3 and their interaction during the summer and winter seasons in Beijing, China[J]. Sustainability, 10(12): 4519.
DOI URL |
| [13] | 曹宁, 黄学敏, 祝颖, 等, 2019. 西安冬季重污染过程PM2.5理化特征及来源解析[J]. 中国环境科学, 39(1): 32-39. |
| CAO N, HUANG X M, ZHU Y, et al., 2019. Pollution characteristics and source apportionment of fine particles during a heavy pollution in winter in Xi'an City[J]. China Environmental Science, 39(1): 32-39. | |
| [14] | 贺冉冉, 朱兰保, 周开胜, 2017. 基于时间序列模型残差的中国东部地区空气质量指数 (AQI) 空间自相关特征分析[J]. 环境科学学报, 37(7): 2459-2467. |
| HE R R, ZHU L B, ZHOU K S, 2017. Spatial autocorrelation analysis of air quality index (AQI) in eastern China based on residuals of time series models[J]. Acta Scientiae Circumstantiae, 37(7): 2459-2467. | |
| [15] | 胡琳, 程路, 王琦, 等, 2021. 西安近地面臭氧浓度特征及关键气象因子分析[J]. 干旱区资源与环境, 35(6): 102-109. |
| HU L, CHENG L, WANG Q, et al., 2021. Analysis of ozone concentration characteristics and key meteorological factors in Xi' an[J]. Journal of Arid Land Resources and Environment, 35(6): 102-109. | |
| [16] | 环境保护部, 国家质量监督检验检疫总局, 2012. 环境空气质量标准: GB 3095-2012[S]. 北京: 中国环境科学出版社. |
| Ministry of Environmental Protection, General Administration of Quality Supervision, Inspection and Quarantine, 2012. Ambient air quality standards: GB 309-2012[S]. Beijing: China Environmental Press. | |
| [17] | 黄晓军, 祁明月, 李艳雨, 等, 2020. 关中地区PM2.5时空演化及人口暴露风险[J]. 环境科学, 41(12): 5245-5255. |
|
HUANG X J, QI M Y, LI Y Y, et al., 2020. Spatio-temporal evolution and population exposure risk to PM2.5 in the Guanzhong area[J]. Environmental Science, 41(12): 5245-5255.
DOI URL |
|
| [18] | 贾小芳, 颜鹏, 孟昭阳, 等, 2019. 2016年11-12月北京及周边重污染过程PM2.5特征[J]. 应用气象学报, 30(3): 302-315. |
| JIA X F, YAN P, MENG Z Y, et al., 2019. Characteristics of PM2.5 in heavy pollution events in Beijing and surrounding areas from November to December in 2016[J]. Journal of Applied Meteorological Science, 30(3): 302-315. | |
| [19] | 蒋超, 龚建周, 孙家仁, 等, 2018. 2013-2016年珠三角地区PM2.5分布时空演变[J]. 生态环境学报, 27(9): 1698-1705. |
| JIANG C, GONG J Z, SUN J R, et al., 2018. Spatial-temporal evolution of PM2.5 distribution in Pearl River Delta Region in 2013-2016 [J]. Ecology and Environmental Sciences, 27(9): 1698-1705. | |
| [20] | 刘超, 花丛, 康志明, 2017. 2014-2015年上海地区冬夏季大气污染特征及其污染源分析[J]. 气象, 43(7): 823-830. |
| LIU C, HUA C, KANG Z M, 2017. Characteristics of air pollution and its resources during winter and summer seasons of 2014 and 2015 in Shanghai[J]. Meteorological Minthly, 43(7): 823-830. | |
| [21] | 宁贵财, 2018. 四川盆地西北部城市群冬季大气污染气象成因及其数值模拟研究[D]. 兰州: 兰州大学. |
| NING G C, 2018. Meteorological causes of air pollution in the northwest urban agglomeration of Sichuan basin in winter and their numerical simulation[D]. Lanzhou: Lanzhou University. | |
| [22] | 彭玏, 赵媛媛, 赵吉麟, 等, 2019. 京津冀大气污染传输通道区大气污染时空格局研究[J]. 中国环境科学, 39(2): 449-458. |
| PENG L, ZHAO Y Y, ZHAO J L, et al., 2019. Spatiotemoral patterns of air pollution in air pollution transmission channel of Beijing-Tianjin-Hebei from 2000 to 2015 [J]. China Environmental Science, 39(2): 449-458. | |
| [23] | 秦卓凡, 廖宏, 陈磊, 等, 2021. 汾渭平原空气质量及气象要素对其日变化和年际变化的影响[J]. 大气科学, 45(6): 1273-1291. |
| QIN Z F, LIAO H, CHEN L, et al., 2021. Fenwei Plain air quality and the dominant meteorological parameters for its daily and interannual variations[J]. Chinese Journal of Atmospheric Sciences, 45(6): 1273-1291. | |
| [24] | 沈楠驰, 周丙锋, 李珊珊, 等, 2020. 2015-2019年天津市大气污染物时空变化特征及成因分析[J]. 生态环境学报, 29(9): 1862-1873. |
| SHEN N C, ZHOU B F, LI S S, et al., 2020. Temporal and spatial variation characteristics and origin analysis of air pollutants in Tianjin from 2015 to 2019 [J]. Ecology and Environmental Sciences, 29(9): 1862-1873. | |
| [25] | 谢蓉, 2017. 中国大气环境PM2.5健康影响的时空变化趋势研究[D]. 南京: 南京大学. |
| XIE R, 2017. Study on the long-term trend and spatial pattern of Premature deaths attributable to ambient PM2.5 in China[D]. Nanjing: Nanjing University. | |
| [26] | 解淑艳, 霍晓芹, 曾凡刚, 等, 2021. 2015-2019年汾渭平原臭氧污染状况分析[J]. 中国环境监测, 37(1): 49-57. |
| XIE S Y, HUO X Q, ZENG F G, et al., 2021. Analysis of ozone pollution in Fenwei Plain from 2015 to 2019 [J]. Environmental Monitoring in China, 37(1): 49-57. | |
| [27] | 谢杨, 戴瀚程, 花岡達也, 等, 2016. PM2.5污染对京津冀地区人群健康影响和经济影响[J]. 中国人口·资源与环境, 26(11): 19-27. |
| XIE Y, DAI H C, HANAOKA T, et al., 2016. Health and economic impacts of PM2.5 pollution in Beijing-Tianjin-Hebei Area[J]. China Population, Resources and Environment, 26(11): 19-27. | |
| [28] | 徐维超, 2012. 相关系数研究综述[J]. 广东工业大学学报, 29(3): 12-17. |
| [29] | XU W C, 2012. A review on correlation coefficients[J]. Journal of Guangdong University of Technology, 29(3): 12-17. |
| [30] | 张晶, 朱兆洲, 李绪威, 等, 2019. 煤改气后天津市采暖期大气污染特征的时空分布研究[J]. 生态环境学报, 28(2): 324-331. |
| ZHANG J, ZHU Z Z, LI X W, et al., 2019. Spatial and temporal distribution of atmospheric pollutants in Tianjin during winter heating period after the “coal to gas” project[J]. Ecology and Environmental Sciences, 28(2): 324-331. | |
| [31] | 张小娟, 李莉, 王红丽, 等, 2019. 2010-2016年上海城区臭氧长时间序列变化特征初探[J]. 环境科学学报, 39(1): 86-94. |
| ZHANG X J, LI L, WANG H L, et al., 2019. Preliminary study on the long-term trends of ozone in urban Shanghai from 2010 to 2016 [J]. Acta Scientiae Circumstantiae, 39(1): 86-94. | |
| [32] | 赵辉, 郑有飞, 张誉馨, 等, 2020. 京津冀大气污染的时空分布与人口暴露[J]. 环境科学学报, 40(1): 1-12. |
| ZHAO H, ZHENG Y F, ZHANG Y X, et al., 2020. Spatiotemporal distribution and population exposure of air pollution in Beijing-Tianjin-Hebei region[J]. Acta Scientiae Circumstantiae, 40(1): 1-12. | |
| [33] | 周骥, 孙庆华, 许建明, 等, 2018. 上海地区不同PM2.5污染过程对炎症应激影响的差异性[J]. 气象, 44(12): 1612-1617. |
| ZHOU J, SUN Q H, XU J M, et al., 2018. Effects of different PM2.5 pollution processes on inflammatory stress in Shanghai area[J]. Meteorological Monthly, 44(12): 1612-1617. |
| [1] | 董洁芳, 邓椿, 张仲伍. 渭河流域PM2.5时空演化及人口暴露风险[J]. 生态环境学报, 2023, 32(6): 1078-1088. |
| [2] | 张露, 何雨霏, 陈坦, 杨婷, 张冰, 金军. 2011—2020年汾渭平原农田生态系统碳足迹的时空格局演变[J]. 生态环境学报, 2023, 32(6): 1149-1162. |
| [3] | 朱永乐, 汤家喜, 谭婷, 李玉, 向彪. 氟化工园区周边玉米中全氟/多氟化合物的污染特征[J]. 生态环境学报, 2023, 32(5): 1001-1006. |
| [4] | 翁升恒, 张玉琴, 姜冬昕, 潘卫华, 李丽纯, 张方敏. 福建省森林植被NEP时空变化及影响因子分析[J]. 生态环境学报, 2023, 32(5): 845-856. |
| [5] | 于菲, 曾海龙, 房怀阳, 付玲芳, 林澍, 董家豪. 典型感潮河网浮游藻类功能群时空变化特征及水质评价[J]. 生态环境学报, 2023, 32(4): 756-765. |
| [6] | 张鐥文, 杨冉, 侯文星, 王丽丽, 刘爽, 宋汉扬, 赵文吉, 李令军. 生态补水前后永定河两岸植被覆盖度变化及驱动力分析[J]. 生态环境学报, 2023, 32(2): 264-273. |
| [7] | 傅梦琪, 刘娟, 李进, 张凡, 李雪瑶, 杨正军, 李彭辉, 金陶胜. 不同油品对国Ⅳ、国Ⅴ柴油公交车的碳排放影响研究[J]. 生态环境学报, 2022, 31(9): 1849-1855. |
| [8] | 郝贝贝, 王楠, 吴昊平, 周智鑫, 张思毅, 贺斌. 生态沟渠对珠三角稻田径流污染的削减功能研究[J]. 生态环境学报, 2022, 31(9): 1856-1864. |
| [9] | 李梦华, 韩颖娟, 赵慧, 王云霞. 基于地理探测器的宁夏植被覆盖度时空变化特征及其驱动因子分析[J]. 生态环境学报, 2022, 31(7): 1317-1325. |
| [10] | 黄金廷, 宋歌, 蒲芳, 王嘉玮, 李宗泽, 张方, 孙芳强. 层状包气带“三氮”污染物迁移转化原位实验研究[J]. 生态环境学报, 2022, 31(6): 1208-1214. |
| [11] | 易嘉慧, 何超, 杨璐, 叶志祥, 田雅, 柯碧钦, 慕航, 涂佩玥, 韩超然, 洪松. COVID-19疫情期间全球气温和主要大气污染物浓度变化的空间关联[J]. 生态环境学报, 2022, 31(4): 740-749. |
| [12] | 刘沙沙, 陈诺, 杨晓茵. 微塑料对有机污染物的吸附-解吸特性及其复合毒性效应研究进展[J]. 生态环境学报, 2022, 31(3): 610-620. |
| [13] | 邢冉, 沈国锋, 程和发, 陶澍. 东北地区农村生活能源结构变迁及其对区域污染物排放的影响[J]. 生态环境学报, 2022, 31(12): 2367-2373. |
| [14] | 石智宇, 王雅婷, 赵清, 张连蓬, 朱长明. 2001-2020年中国植被净初级生产力时空变化及其驱动机制分析[J]. 生态环境学报, 2022, 31(11): 2111-2123. |
| [15] | 付乐, 迟妍妍, 于洋, 张丽苹, 刘斯洋, 王夏晖, 许开鹏, 王晶晶, 张信. 2000—2020年黄河流域土地利用变化特征及影响因素分析[J]. 生态环境学报, 2022, 31(10): 1927-1938. |
| 阅读次数 | ||||||
|
全文 |
|
|||||
|
摘要 |
|
|||||