生态环境学报 ›› 2023, Vol. 32 ›› Issue (6): 1149-1162.DOI: 10.16258/j.cnki.1674-5906.2023.06.017
张露1,2,*( ), 何雨霏1,3,*, 陈坦1,4,**(), 杨婷1, 张冰1, 金军1
收稿日期:2023-03-29
出版日期:2023-06-18
发布日期:2023-09-01
通讯作者:
**E-mail: chentan05@tsinghua.org.cn作者简介:张露(2001年),女(苗族),硕士研究生,主要研究方向为碳足迹核算。E-mail: zhangl3965@163.com基金资助:
ZHANG Lu1,2,*(), HE Yufei1,3,*, CHEN Tan1,4,**(), YANG Ting1, ZHANG Bing1, JIN Jun1
Received:2023-03-29
Online:2023-06-18
Published:2023-09-01
摘要:
农田是重要的温室气体排放源,同时也是陆地生态系统的重要碳汇。充分认识我国重要粮食生产基地——汾渭平原的碳库潜力,深入了解汾渭平原农业活动的碳排放特征,可为汾渭平原产业结构调整和区域可持续发展提供基础信息。通过收集2011—2020年汾渭平原农田生态系统农业投入要素及作物产量数据,解析了汾渭平原农田生态系统的碳源/碳汇及碳足迹时空变化及影响因素,核算了汾渭平原农田生态系统的碳生态盈余/赤字。2011—2020年,汾渭平原碳排放总量从3.78×106 t先升高至4.16×10⁶ t后逐步下降到3.72×10⁶ t,单位播种面积碳排放呈上升趋势,最高达0.880 t·hm-2,两者均呈现西部高于东部、中心高于边缘的分布格局,而化肥使用是碳排放的主要因素(碳排放总量年均贡献率达58.8%),其所贡献的碳排放量与总碳排放量的变化趋势大体一致。汾渭平原碳吸收总量从2.48×10⁷ t先升高到2.69×10⁷ t后下降至2.38×10⁷ t,空间分布较为均衡,而单位播种面积碳吸收随时间呈上升趋势,最高达5.98 t·hm-2,且逐步由东部高于西部演变为西部高于东部,其中粮食作物是碳吸收的主要贡献源,其碳吸收量占农田总吸收量的92.7%。汾渭平原碳足迹从5.94×10⁵ hm2先升高至6.44×10⁵ hm2后下降至5.54×10⁵ hm2,空间分布不规律,而单位面积碳足迹呈上升趋势,大体呈现西部高、东部低的分布格局。汾渭平原农田整体呈碳生态盈余状况,然而近年也出现了盈余下降趋势,其农田生态系统碳库功能有削弱风险。各城市间农业发展不均衡较为明显。重视第一产业的绿色发展对保持农田碳汇规模、实现区域碳达峰具有重要意义。
中图分类号:
张露, 何雨霏, 陈坦, 杨婷, 张冰, 金军. 2011—2020年汾渭平原农田生态系统碳足迹的时空格局演变[J]. 生态环境学报, 2023, 32(6): 1149-1162.
ZHANG Lu, HE Yufei, CHEN Tan, YANG Ting, ZHANG Bing, JIN Jun. The Spatial and Temporal Pattern Evolution of Carbon Footprint of Farmland Ecosystem in Fenwei Plain from 2011 to 2020[J]. Ecology and Environment, 2023, 32(6): 1149-1162.
| 作物种类 | 含碳量C | 含水率V | 根冠比R | 经济系数H |
|---|---|---|---|---|
| 稻谷 | 0.41 | 0.12 | 0.60 | 0.50 |
| 小麦 | 0.48 | 0.12 | 0.48 | 0.40 |
| 玉米 | 0.47 | 0.14 | 0.44 | 0.53 |
| 谷子 | 0.45 | 0.13 | 0.20 | 0.40 |
| 高粱 | 0.35 | 0.14 | 0.27 | 0.40 |
| 薯类 | 0.42 | 0.13 | 0.68 | 0.75 |
| 大豆 | 0.45 | 0.12 | 0.92 | 0.30 |
| 其他粮食作物 | 0.45 | 0.15 | 0.25 | 0.35 |
| 油料 | 0.45 | 0.09 | - | 0.45 |
| 棉花 | 0.45 | 0.08 | 0.19 | 0.40 |
| 麻类 | 0.45 | 0.13 | 0.40 | 0.10 |
| 烟叶 | 0.45 | 0.16 | 0.32 | 0.55 |
| 药材 | 0.45 | 0.15 | - | 0.40 |
| 蔬菜 | 0.45 | 0.90 | - | 1.00 |
| 瓜果 | 0.45 | 0.85 | 0.25 | 0.83 |
表1 不同农作物碳吸收量估算参数
Table 1 Estimated parameters of carbon absorption for different crops
| 作物种类 | 含碳量C | 含水率V | 根冠比R | 经济系数H |
|---|---|---|---|---|
| 稻谷 | 0.41 | 0.12 | 0.60 | 0.50 |
| 小麦 | 0.48 | 0.12 | 0.48 | 0.40 |
| 玉米 | 0.47 | 0.14 | 0.44 | 0.53 |
| 谷子 | 0.45 | 0.13 | 0.20 | 0.40 |
| 高粱 | 0.35 | 0.14 | 0.27 | 0.40 |
| 薯类 | 0.42 | 0.13 | 0.68 | 0.75 |
| 大豆 | 0.45 | 0.12 | 0.92 | 0.30 |
| 其他粮食作物 | 0.45 | 0.15 | 0.25 | 0.35 |
| 油料 | 0.45 | 0.09 | - | 0.45 |
| 棉花 | 0.45 | 0.08 | 0.19 | 0.40 |
| 麻类 | 0.45 | 0.13 | 0.40 | 0.10 |
| 烟叶 | 0.45 | 0.16 | 0.32 | 0.55 |
| 药材 | 0.45 | 0.15 | - | 0.40 |
| 蔬菜 | 0.45 | 0.90 | - | 1.00 |
| 瓜果 | 0.45 | 0.85 | 0.25 | 0.83 |
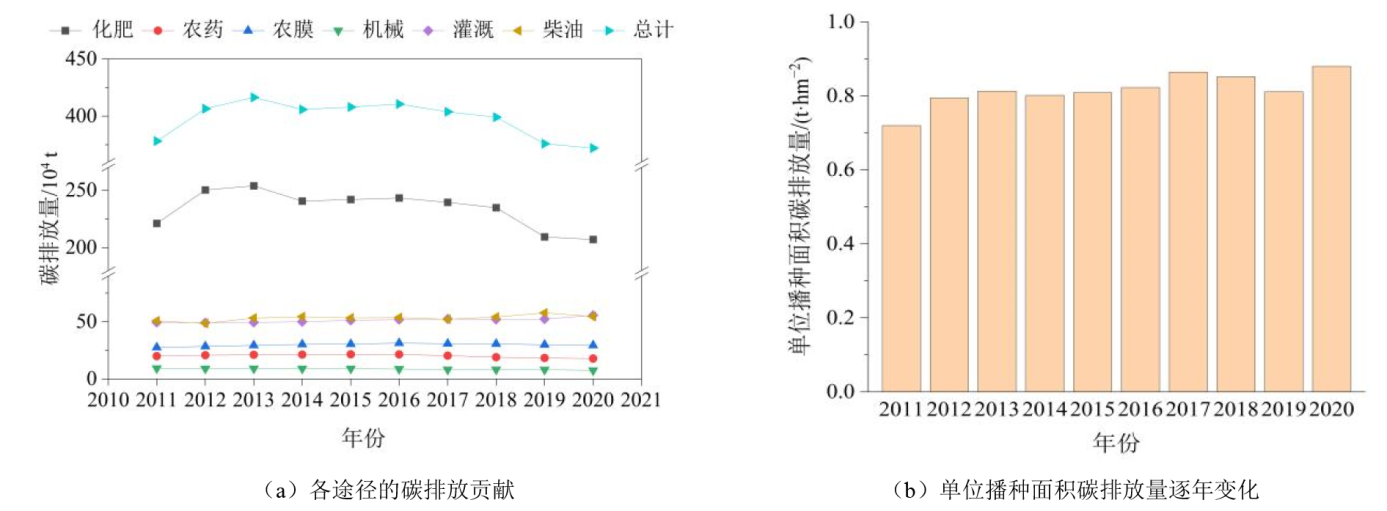
图1 2011—2020年汾渭平原农田生态系统碳排放量
Figure 1 Carbon emissions of the Fenwei Plain farmland ecosystem from 2011 to 2020

图2 2011—2020年汾渭平原农田生态系统碳排放量的空间变化
Figure 2 Spatial distribution of carbon emissions in the Fenwei Plain farmland ecosystem from 2011 to 2020

图3 2011—2020年汾渭平原农田生态系统单位播种面积碳排放量的空间变化
Figure 3 Spatial distribution of carbon emissions per unit sown area in the Fenwei Plain farmland ecosystem from 2011 to 2020
| 年份 | 碳吸收量/106 t | 单位播种面积碳吸收量/(t·hm-2) | |||
|---|---|---|---|---|---|
| 粮食作物 | 经济作物 | 园艺作物 | 总计 | ||
| 2011 | 23.1 | 0.655 | 1.05 | 24.8 | 4.72 |
| 2012 | 24.8 | 0.642 | 1.26 | 26.7 | 5.22 |
| 2013 | 23.9 | 0.546 | 1.35 | 25.8 | 5.03 |
| 2014 | 24.7 | 0.522 | 1.45 | 26.7 | 5.27 |
| 2015 | 24.7 | 0.508 | 1.39 | 26.6 | 5.27 |
| 2016 | 25.0 | 0.511 | 1.40 | 26.9 | 5.39 |
| 2017 | 24.3 | 0.466 | 1.50 | 26.3 | 5.62 |
| 2018 | 23.9 | 0.419 | 1.37 | 25.7 | 5.49 |
| 2019 | 22.0 | 0.414 | 1.41 | 23.8 | 5.14 |
| 2020 | 23.4 | 0.422 | 1.49 | 25.3 | 5.98 |
表2 2011—2020年汾渭平原农田生态系统碳吸收量和碳吸收强度
Table 2 Carbon sequestration and its intensity in the Fenwei Plain farmland ecosystems from 2011 to 2020
| 年份 | 碳吸收量/106 t | 单位播种面积碳吸收量/(t·hm-2) | |||
|---|---|---|---|---|---|
| 粮食作物 | 经济作物 | 园艺作物 | 总计 | ||
| 2011 | 23.1 | 0.655 | 1.05 | 24.8 | 4.72 |
| 2012 | 24.8 | 0.642 | 1.26 | 26.7 | 5.22 |
| 2013 | 23.9 | 0.546 | 1.35 | 25.8 | 5.03 |
| 2014 | 24.7 | 0.522 | 1.45 | 26.7 | 5.27 |
| 2015 | 24.7 | 0.508 | 1.39 | 26.6 | 5.27 |
| 2016 | 25.0 | 0.511 | 1.40 | 26.9 | 5.39 |
| 2017 | 24.3 | 0.466 | 1.50 | 26.3 | 5.62 |
| 2018 | 23.9 | 0.419 | 1.37 | 25.7 | 5.49 |
| 2019 | 22.0 | 0.414 | 1.41 | 23.8 | 5.14 |
| 2020 | 23.4 | 0.422 | 1.49 | 25.3 | 5.98 |

图4 2011—2020年汾渭平原农田生态系统碳吸收量的空间分布
Figure 4 Spatial distribution of carbon sequestration in the Fenwei Plain farmland ecosystems from 2011 to 2020
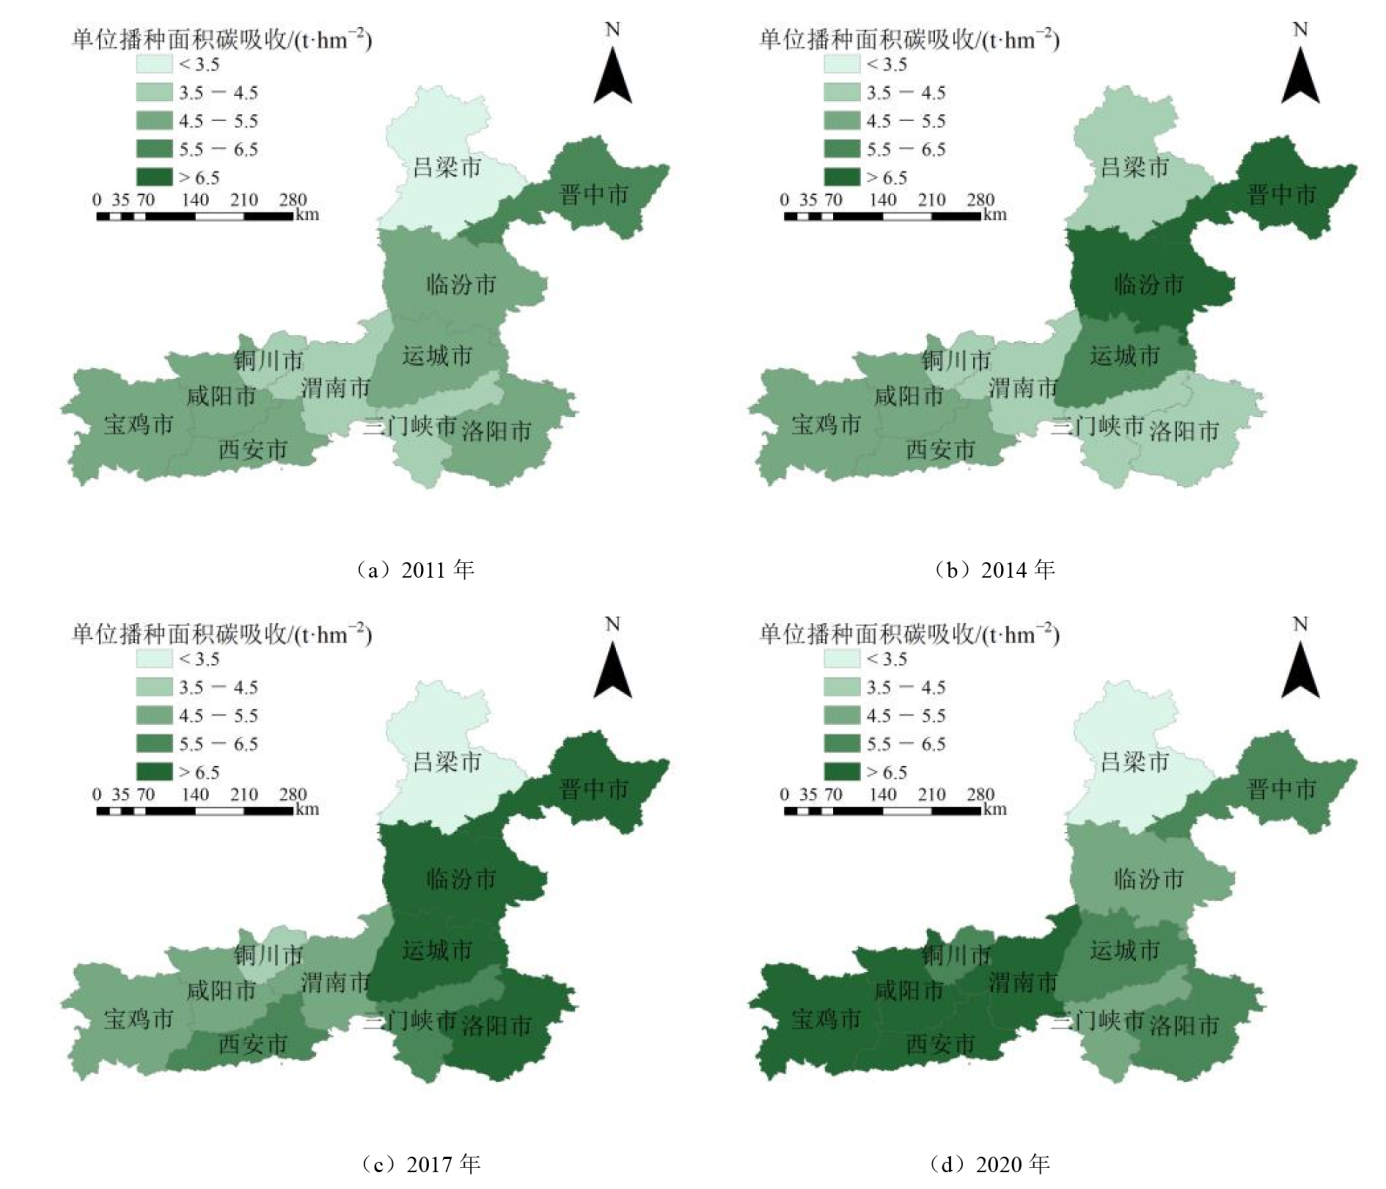
图5 2011—2020年汾渭平原农田生态系统单位播种面积碳吸收量的空间分布
Figure 5 Spatial distribution of carbon sequestration per unit sown area in the Fenwei Plain farmland ecosystem from 2011 to 2020
| 年份 | 碳足迹/105 hm2 | 单位耕地面积碳足迹/(hm2·hm-2) | 碳生态盈余/106 hm2 | 单位耕地面积碳盈余/(hm2·hm-2) |
|---|---|---|---|---|
| 2011 | 5.94 | 0.150 | 3.37 | 0.850 |
| 2012 | 5.94 | 0.149 | 3.41 | 0.852 |
| 2013 | 6.44 | 0.159 | 3.42 | 0.841 |
| 2014 | 6.12 | 0.152 | 3.41 | 0.848 |
| 2015 | 6.28 | 0.157 | 3.38 | 0.843 |
| 2016 | 6.06 | 0.152 | 3.39 | 0.848 |
| 2017 | 5.98 | 0.152 | 3.33 | 0.848 |
| 2018 | 5.91 | 0.150 | 3.33 | 0.850 |
| 2019 | 5.85 | 0.152 | 3.26 | 0.848 |
| 2020 | 5.54 | 0.143 | 3.33 | 0.857 |
表3 汾渭平原农田生态系统的碳足迹与碳生态盈余
Table 3 Carbon footprint and ecological surplus in Fenwei Plain farmland ecosystems
| 年份 | 碳足迹/105 hm2 | 单位耕地面积碳足迹/(hm2·hm-2) | 碳生态盈余/106 hm2 | 单位耕地面积碳盈余/(hm2·hm-2) |
|---|---|---|---|---|
| 2011 | 5.94 | 0.150 | 3.37 | 0.850 |
| 2012 | 5.94 | 0.149 | 3.41 | 0.852 |
| 2013 | 6.44 | 0.159 | 3.42 | 0.841 |
| 2014 | 6.12 | 0.152 | 3.41 | 0.848 |
| 2015 | 6.28 | 0.157 | 3.38 | 0.843 |
| 2016 | 6.06 | 0.152 | 3.39 | 0.848 |
| 2017 | 5.98 | 0.152 | 3.33 | 0.848 |
| 2018 | 5.91 | 0.150 | 3.33 | 0.850 |
| 2019 | 5.85 | 0.152 | 3.26 | 0.848 |
| 2020 | 5.54 | 0.143 | 3.33 | 0.857 |
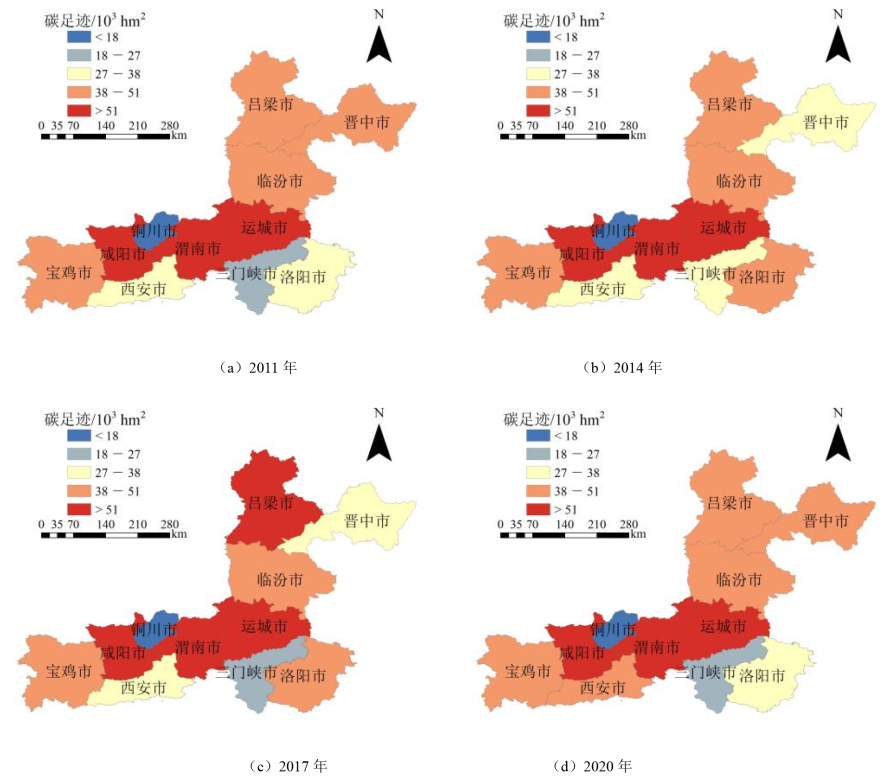
图6 2011—2020年汾渭平原农田生态系统的碳生态足迹空间分布
Figure 6 Spatial distribution of carbon footprint in the Fenwei Plain farmland ecosystems from 2011 to 2020

图7 2011—2020年汾渭平原农田生态系统单位耕地面积碳足迹空间变化
Figure 7 Spatial distribution of carbon footprint per unit cultivated area in the Fenwei Plain farmland ecosystems from 2011 to 2020

图8 2011—2020年汾渭平原农田生态系统碳足迹影响因素相关性分析
Figure 8 Correlation analysis of factors influencing carbon footprint in the Fenwei Plain farmland ecosystems from 2011 to 2020
| [1] |
ANDERSSON D, 2020. A novel approach to calculate individuals’ carbon footprints using financial transaction data-app development and design[J]. Journal of Cleaner Production, 256: 120396.
DOI URL |
| [2] |
BURCHART-KOROL D, FOLĘGA P, 2020. Environmental footprints of current and future electric battery charging and electric vehicles in Poland[J]. Transport Problems, 15(1): 61-70.
DOI URL |
| [3] |
FILIMONAU V, SANTA ROSA M, FRANCA L S, et al., 2021. Environmental and carbon footprint of tourist accommodation: A comparative study of popular hotel categories in Brazil and Peru[J]. Journal of Cleaner Production, 328: 129561.
DOI URL |
| [4] |
HU X C, PIERCE J M T, TAYLOR T, et al., 2021. The carbon footprint of general anaesthetics: a case study in the UK[J]. Resources, Conservation and Recycling, 167: 105411.
DOI URL |
| [5] |
HUANG X Q, XU X C, WANG Q Q, et al., 2019. Assessment of agricultural carbon emissions and their spatiotemporal changes in China, 1997-2016[J]. International Journal of Environmental Research and Public Health, 16(17): 3105.
DOI URL |
| [6] | JACK T, IVANOVA D, 2021. Small is beautiful? Stories of carbon footprints, socio-demographic trends and small households in Denmark[J]. Energy Research & Social Science, 78: 102130. |
| [7] |
LÉVAY P Z, VANHILLE J, GOEDEMÉ T, et al., 2021. The association between the carbon footprint and the socio-economic characteristics of Belgian households[J]. Ecological Economics, 186: 107065.
DOI URL |
| [8] |
LI M Q, LIU S L, SUN Y X, et al., 2021. Agriculture and animal husbandry increased carbon footprint on the Qinghai-Tibet Plateau during past three decades[J]. Journal of Cleaner Production, 278: 123963.
DOI URL |
| [9] |
LIU M C, YANG L, 2021. Spatial pattern of China’s agricultural carbon emission performance[J]. Ecological Indicators, 133: 108345.
DOI URL |
| [10] |
LIU X Y, WANG X E, SONG J N, et al., 2019. Why are the carbon footprints of China’s urban households rising? An input-output analysis and structural decomposition analysis[J]. Sustainability, 11(24): 7157.
DOI URL |
| [11] |
MARINELLI E, RADINI S, FOGLIA A, et al., 2021. Validation of an evidence-based methodology to support regional carbon footprint assessment and decarbonisation of wastewater treatment service in Italy[J]. Water Research, 207: 117831.
DOI URL |
| [12] |
MORAN D, KANEMOTO K, JIBORN M, et al., 2018. Carbon footprints of 13,000 cities[J]. Environmental Research Letters, 13(6): 064041.
DOI URL |
| [13] |
RIZAN C, BHUTTA M F, REED M, et al., 2021. The carbon footprint of waste streams in a UK hospital[J]. Journal of Cleaner Production, 286: 125446.
DOI URL |
| [14] |
SHI S Q, YIN J H, 2021. Global research on carbon footprint: A scientometric review[J]. Environmental Impact Assessment Review, 89: 106571.
DOI URL |
| [15] |
TIAN J X, YANG H L, XIANG P, et al., 2016. Drivers of agricultural carbon emissions in Hunan Province, China[J]. Environmental Earth Sciences, 75(2): 1-17.
DOI URL |
| [16] |
TIAN Y, ZHANG J B, HE Y Y, 2014. Research on spatial-temporal characteristics and driving factor of agricultural carbon emissions in China[J]. Journal of Integrative Agriculture, 13(6): 1393-1403.
DOI |
| [17] |
WANG S, LIU J, YI H H, et al., 2021. Trends in air pollutant emissions from the sintering process of the iron and steel industry in the Fenwei Plain and surrounding regions in China, 2014-2017[J]. Chemosphere, 291: 132917.
DOI URL |
| [18] |
WANG X R, CHEN S Q, 2020. Urban-rural carbon footprint disparity across China from essential household expenditure: Survey-based analysis, 2010-2014[J]. Journal of Environmental Management, 267: 110570.
DOI URL |
| [19] |
WEST T O, MARLAND G, 2002. A synthesis of carbon sequestration, carbon emissions, and net carbon flux in agriculture: Comparing tillage practices in the United States[J]. Agriculture Ecosystems & Environment, 91(1-3): 217-232.
DOI URL |
| [20] |
WU H, GUO S S, GUO P, et al., 2022. Agricultural water and land resources allocation considering carbon sink/source and water scarcity/degradation footprint[J]. Science of The Total Environment, 819: 152058.
DOI URL |
| [21] |
ZHANG G, WANG X K, ZHANG L, et al., 2018. Carbon and water footprints of major cereal crops production in China[J]. Journal of Cleaner Production, 194: 613-623.
DOI URL |
| [22] |
ZHENG S, SHAN J M, SINGH R P, et al., 2020. High spatio-temporal heterogeneity of carbon footprints in the Zhejiang Province, China, from 2005 to 2015: Implications for climate change policies[J]. Environmental Chemistry Letters, 18(3): 931-939.
DOI |
| [23] | 白福臣, 高鹏, 郑沃林, 2023. 粮食主产区农田生态系统碳足迹的时空演化与脱钩效应[J]. 生态经济, 39(7): 107-116. |
| BAI F C, GAO P, ZHENG W L, 2023. Spatial-temporal pattern evolution and decoupling effect of farmland ecosystem carbon footprint in major grain-producing areas[J]. Ecological Economy, 39(7): 107-116. | |
| [24] | 白义鑫, 盛茂银, 胡琪娟, 等, 2019. 贵州喀斯特农田生态系统碳足迹时空差异研究[J]. 四川农业大学学报, 37(5): 685-694. |
| BAI Y X, SHEN M Y, HU Q J, et al., 2019. Study on spatial and temporal differences of carbon footprint of karst farmland ecosystem in Guizhou[J]. Journal of Sichuan Agricultural University, 37(5): 685-694. | |
| [25] | 陈宇斌, 王森, 2023. 农业综合开发投资的农业碳减排效果评估——基于高标准基本农田建设政策的事件分析[J]. 农业技术经济, 42(6): 67-80. |
| CHEN Y B, WANG S, 2023. Evaluation of agricultural carbon emission reduction effect of agricultural comprehensive development investment-event analysis based on well-facilitated capital farmland construction[J]. Journal of Agrotechnical Economics, 42(6): 67-80. | |
| [26] | 陈中督, 徐春春, 纪龙, 等, 2019. 长江中游地区稻麦生产系统碳足迹及氮足迹综合评价[J]. 植物营养与肥料学报, 25(7): 1125-1133. |
| CHEN Z D, XU C C, JI L, et al., 2019. Comprehensive evaluation for carbon and nitrogen footprints of rice-wheat rotation system in Middle Yangtze River Basin[J]. Journal of Plant Nutrition and Fertilizers, 25(7): 1125-1133. | |
| [27] | 段华平, 张悦, 赵建波, 等, 2011. 中国农田生态系统的碳足迹分析[J]. 水土保持学报, 25(5): 203-208. |
| DUAN H P, ZHANG Y, ZHAO J B, et al., 2011. Carbon footprint analysis of farmland ecosystem in China[J]. Journal of Soil and Water Conservation, 25(5): 203-208. | |
| [28] | 杭晓宁, 张健, 胡留杰, 等, 2018. 2006-2015年重庆市农田生态系统碳足迹分析[J]. 湖南农业大学学报 (自然科学版), 44(5): 524-531. |
| HANG X N, ZHANG J, HU L J, et al., 2018. Analysis of carbon footprints in farmland ecosystem of Chongqing city 2006-2015[J]. Journal of Hunan Agricultural University (Natural Sciences), 44(5): 524-531. | |
| [29] | 胡永浩, 张昆扬, 胡南燕, 等, 2023. 中国农业碳排放测算研究综述[J]. 中国生态农业学报 (中英文), 31(2): 163-176. |
| HU Y H, ZHANG K Y, HU N Y, et al., 2023. Review on measurement of agricultural carbon emission in China[J]. Chinese Journal of Eco-Agriculture, 31(2): 163-176. | |
| [30] | 郝小雨, 2022. 基于碳足迹的黑龙江垦区农业生态系统碳源/汇时空变化[J]. 中国农业资源与区划, 43(8): 64-73. |
| HAO X Y, 2022. Spatiotemporal variation of carbon source/sink in agricultural ecosystem based on carbon footprint in Heilongjiang land reclamation areas[J]. Chinese Journal of Agricultural Resources and Regional Planning, 43(8): 64-73. | |
| [31] |
郝小雨, 王晓军, 高洪生, 等, 2022. 松嫩平原不同秸秆还田方式下农田温室气体排放及碳足迹估算[J]. 生态环境学报, 31(2): 318-325.
DOI |
| HAO X Y, WANG X J, GAO H S, et al., 2022. Estimation of greenhouse gas emission and carbon footprint of farmland under different straw returning methods in Songnen Plain[J]. Ecology and Environmental Sciences, 31(2): 318-325. | |
| [32] | 韩召迎, 孟亚利, 徐娇, 等, 2012. 区域农田生态系统碳足迹时空差异分析——以江苏省为案例[J]. 农业环境科学学报, 31(5): 1034-1041. |
| HAN Z Y, MENG Y L, XU J, et al., 2012. Temporal and spatial difference in carbon footprint of regional farmland ecosystem-taking Jiangsu Province as a case[J]. Journal of Agro-Environment Science, 31(5): 1034-1041. | |
| [33] | 黄祖辉, 米松华, 2011. 农业碳足迹研究——以浙江省为例[J]. 农业经济问题, 32(11): 40-47, 111. |
| HUANG Z H, MI S H, 2011. Agricultural sector carbon footprint accounting: a case of Zhejiang, China[J]. Issues in Agricultural Economy, 32(11): 40-47, 111. | |
| [34] | 柳君波, 徐向阳, 李思雯, 2022. 中国电力行业的全周期碳足迹[J]. 中国人口·资源与环境, 32(1): 31-41. |
| LIU J B, XU X Y, LI S W, 2022. Lifecycle carbon footprint analysis of China’s power industry[J]. China Population, Resources and Environment, 32(1): 31-41. | |
| [35] | 兰文宝, 车畅, 陶成云, 2020. 基于斯皮尔曼等级相关的单演谱成分选择及其在SAR目标识别中的应用[J]. 电波科学学报, 35(3): 414-421. |
| LAN W B, CHE C, TAO C Y, 2020. Selection of monogenic components based on Spearman rank correlation with application to SAR target recognition[J]. Chinese Journal of Radio Science, 35(3): 414-421. | |
| [36] | 李明琦, 刘世梁, 武雪, 等, 2018. 云南省农田生态系统碳足迹时空变化及其影响因素[J]. 生态学报, 38(24): 8822-8834. |
| LI M Q, LIU S L, WU X, et al., 2018. Temporal and spatial dynamics in the carbon footprint and its influencing factors of farmland ecosystems in Yunnan Province[J]. Acta Ecologica Sinica, 38(24): 8822-8834. | |
| [37] | 李波, 张俊飚, 李海鹏, 2011. 中国农业碳排放时空特征及影响因素分解[J]. 中国人口·资源与环境, 21(8): 80-86. |
| LI B, ZHANG J B, LI H P, 2011. Research on spatial-temporal characteristics and affecting factors decomposition of agricultural carbon emission in China[J]. China Population, Resources and Environment, 21(8): 80-86. | |
| [38] |
李春喜, 骆婷婷, 闫广轩, 等, 2020. 河南省不同生态区小麦-玉米两熟制农田碳足迹分析[J]. 生态环境学报, 29(5): 918-925.
DOI |
| LI C X, LUO T T, YAN G X, et al., 2020. Carbon footprint analysis of wheat-maize double cropping system in different ecological regions of Henan Province[J]. Ecology and Environmental Sciences, 29(5): 918-925. | |
| [39] | 孙小祥, 张华兵, 于英鹏, 2021. 江苏沿海地区农田生态系统碳源/汇时空变化及公平性研究[J]. 中国农业资源与区划, 42(10): 56-64. |
| SUN X X, ZHANG H B, YU Y P, 2021. Spatial and temporal dynamics in carbon source/sink and equity of the farmland ecosystem in Jiangsu coastal area, China[J]. Chinese Journal of Agricultural Resources and Regional Planning, 42(10): 56-64. | |
| [40] | 田志会, 刘瑞涵, 2018. 基于京津冀一体化的农田生态系统碳足迹年际变化规律研究[J]. 农业资源与环境学报, 35(2): 167-173. |
| TIAN Z H, LIU R H, 2018. Inter-annual variations of the carbon footprint in Beijing Tianjin and Hebei agro-ecosystem[J]. Journal of Agricultural Resources and Environment, 35(2): 167-173. | |
| [41] | 王雨辰, 彭奕为, 2022. 十八大以来党领导生态文明建设的理论创新和实践创新及其当代价值[J]. 兰州大学学报 (社会科学版), 50(2): 1-14. |
| WANG Y C, PENG Y W, 2022. Theoretical and practical innovations and their contemporary values of ecological civilization construction led by the party since the 18th CPC National Congress[J]. Journal of Lanzhou University (Social Sciences), 50(2): 1-14. | |
| [42] | 王莉, 刘莹莹, 张亚慧, 等, 2022. 河南省农田生态系统碳源/汇时空分布及影响因素分解[J]. 环境科学学报, 42(12): 410-422. |
| WANG L, LIU Y Y, ZHANG Y H, et al., 2022. Spatial and temporal distribution of carbon source/sink and decomposition of influencing factors in farmland ecosystem in Henan Province[J]. Acta Scientiae Circumstantiae, 42(12): 410-422. | |
| [43] | 王珂, 李玲, 黎鹏, 2021. 基于生态安全和粮食安全的高标准农田建设研究[J]. 生态与农村环境学报, 37(6): 706-713. |
| WANG K, LI L, LI P, 2021. Study on high-standard farmland construction based on ecological security and food security[J]. Journal of Ecology and Rural Environment, 37(6): 706-713. | |
| [44] | 王敬哲, 刘志辉, 张波, 2016. 近20年新疆农田生态系统碳足迹时空变化[J]. 干旱地区农业研究, 34(5): 240-248. |
| WANG J Z, LIU Z H, ZHANG B, 2016. Temporal and spatial differences in carbon footprint of regional farmland ecosystem in Xinjiang during recent 20 years[J]. Agricultural Research in the Arid Areas, 34(5): 240-248. | |
| [45] | 谢婷, 张慧, 苗洁, 等, 2021. 湖北省农田生态系统温室气体排放特征与源/汇分析[J]. 农业资源与环境学报, 38(5): 839-848. |
| XIE T, ZHANG H, MIAO J, et al., 2021. Greenhouse gas emission characteristics and source/sink analysis of farmland ecosystem in Hubei Province[J]. Journal of Agricultural Resources and Environment, 38(5): 839-848. | |
| [46] | 许萍萍, 赵言文, 陈颢明, 等, 2018. 江苏省农田生态系统碳源/汇、碳足迹动态变化[J]. 水土保持通报, 38(5): 238-243. |
| XU P P, ZHAO Y W, CHEN H M, et al., 2018. Dynamic change of carbon source/sink and carbon footprint of farmland ecosystem in Jiangsu Province[J]. Bulletin of Soil and Water Conservation, 38(5): 238-243. | |
| [47] | 叶文伟, 王城城, 赵从举, 等, 2021. 近20年海南岛热带农田生态系统碳足迹时空格局演变[J]. 中国农业资源与区划, 42(10): 114-126. |
| YE W W, WANG C C, ZHAO C J, et al., 2021. Spatial and temporal evolution of carbon footprint of tropical farmland ecosystem in Hainan island in recent 20 years[J]. Chinese Journal of Agricultural Resources and Regional Planning, 42(10): 114-126. | |
| [48] | 闫树熙, 陈璐, 2020. 交通碳排放影响因素分析——以西安市为例[J]. 统计与决策, 36(4): 62-66. |
| YAN S X, CHEN L, 2020. Analysis of influencing factors of transportation carbon emissions: A case study of Xi’an[J]. Statistics & Decision, 36(4): 62-66. | |
| [49] | 张精, 方堉, 魏锦达, 等, 2021. 基于碳足迹的安徽省农田生态系统碳源/汇时空差异[J]. 福建农业学报, 36(1): 78-90. |
| ZHANG J, FANG Y, WEI J D, et al., 2021. Carbon footprint-based temporal and spatial analysis on carbon sources/sinks at farmlands in Anhui Province[J]. Fujian Journal of Agricultural Sciences, 36(1): 78-90. | |
| [50] |
张鹏岩, 何坚坚, 庞博, 等, 2017. 农田生态系统碳足迹时空变化——以河南省为例[J]. 应用生态学报, 28(9): 3050-3060.
DOI |
| ZHANG P Y, HE J J, PANG B, et al., 2017. Temporal and spatial differences in carbon footprint in farmland ecosystem: a case study of Henan Province, China[J]. Chinese Journal of Applied Ecology, 28(9): 3050-3060. | |
| [51] | 张剑, 罗贵生, 王小国, 等, 2009. 长江上游地区农作物碳储量估算及固碳潜力分析[J]. 西南农业学报, 22(2): 402-408. |
| ZHANG J, LUO G S, WANG X G, et al., 2009. Carbon stock estimation and sequestration potential of crops in the upper Yangtze river basin[J]. Southwest China Journal of Agricultural Sciences, 22(2): 402-408. |
| [1] | 李语诗, 夏志业, 张蕾. 基于SSPs多情景目标的2030年成渝经济圈土地利用碳排放预测及其空间优化[J]. 生态环境学报, 2023, 32(3): 535-544. |
| [2] | 肖国举, 李秀静, 郭占强, 胡延斌, 王静. 贺兰山东麓土壤有机碳对玉米生长发育及水分利用的影响[J]. 生态环境学报, 2022, 31(9): 1754-1764. |
| [3] | 姜超强, 李晨, 朱启法, 徐海清, 刘炎红, 沈嘉, 阎轶峰, 余飞, 祖朝龙. 皖南不同种植模式碳汇效应及经济效益评价[J]. 生态环境学报, 2022, 31(7): 1285-1292. |
| [4] | 郝永佩, 宋晓伟, 赵文珺, 向发敏. 汾渭平原大气污染时空分布及相关因子分析[J]. 生态环境学报, 2022, 31(3): 512-523. |
| [5] | 郝小雨, 王晓军, 高洪生, 毛明艳, 孙磊, 马星竹, 周宝库, 迟凤琴, 李伟群. 松嫩平原不同秸秆还田方式下农田温室气体排放及碳足迹估算[J]. 生态环境学报, 2022, 31(2): 318-325. |
| 阅读次数 | ||||||
|
全文 |
|
|||||
|
摘要 |
|
|||||