生态环境学报 ›› 2022, Vol. 31 ›› Issue (11): 2111-2123.DOI: 10.16258/j.cnki.1674-5906.2022.11.002
石智宇( ), 王雅婷, 赵清*(), 张连蓬, 朱长明
收稿日期:2022-06-03
出版日期:2022-11-18
发布日期:2022-12-22
通讯作者:
*赵清(1965年生),男,教授,博士,研究方向为景观生态与土地利用。E-mail: zhaoqingla@163.com作者简介:石智宇(1998年生),男,硕士研究生,研究方向为生态遥感与环境变化。E-mail: shizhiyu98@163.com
基金资助:
SHI Zhiyu(), WANG Yating, ZHAO Qing*(), ZHANG Lianpeng, ZHU Changming
Received:2022-06-03
Online:2022-11-18
Published:2022-12-22
摘要:
植被净初级生产力(NPP)是表征生态系统物质和能量循环的基础,也是区域和全球碳循环的重要组成部分。为揭示2001-2020年中国净初级生产力时空变化特征及其驱动机制,基于MOD17A3HGF数据产品,运用Sen趋势分析、Mann-Kendall检验以及Hurst指数等方法分析了中国植被NPP时空变化与未来发展趋势,并通过相关性、残差分析等方法定量分析了气候变化和人类活动在植被NPP变化过程中的相对作用。研究结果表明,(1)中国植被NPP空间上呈现东南高西北低的分布格局,时间上呈波动增加趋势,变化速率为2.86 g·m-2·a-1;空间变化以基本不变为主,NPP呈显著增加的面积明显大于显著减少的面积,未来中国84.38%的地区植被NPP将持续增加或由减少转为增加。(2)植被NPP与降水、气温总体上均呈正相关,其中降水对植被NPP影响更为显著;植被NPP与降水显著正相关的区域主要分布在长江以北地区,与气温显著正相关的区域主要分布在青藏高原中部和北部、云贵高原东南部、东南沿海地区以及山东南部等地。(3)气候变化和人类活动对中国植被NPP的增加均产生了重要作用,但两者在植被NPP改善区中的相对作用存在显著的空间差异性;气候变化主导的植被改善区主要集中在东北、华北、四川盆地及长江中下游平原等地区,人类活动主导植被改善区主要集中在华中、西南以及西北地区;而气候变化和人类活动对植被退化的影响在空间分布上较为一致,且气候变化对NPP退化区的影响较小,人类活动是植被NPP退化的主要因素。
中图分类号:
石智宇, 王雅婷, 赵清, 张连蓬, 朱长明. 2001-2020年中国植被净初级生产力时空变化及其驱动机制分析[J]. 生态环境学报, 2022, 31(11): 2111-2123.
SHI Zhiyu, WANG Yating, ZHAO Qing, ZHANG Lianpeng, ZHU Changming. The Spatiotemporal Changes of NPP and Its Driving Mechanisms in China from 2001 to 2020[J]. Ecology and Environment, 2022, 31(11): 2111-2123.
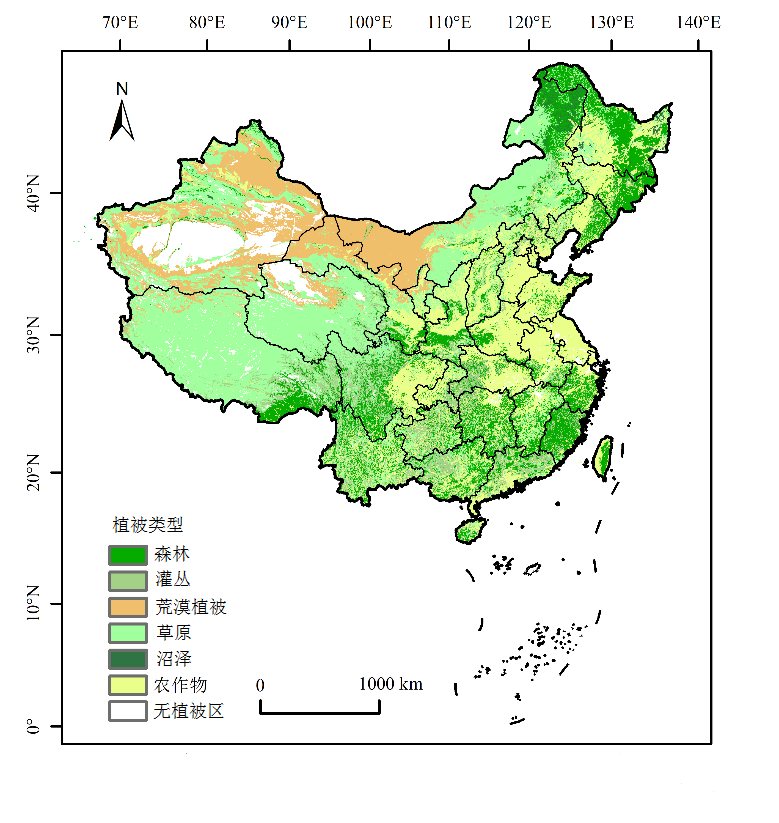
图1 中国不同植被类型的空间分布 基于自然资源部标准地图服务网站GS(2019)1822号标准地图制作,底图边界无修改。下同
Figure 1 Spatial distribution of different vegetation types in China Based on the standard map GS (2019) No.1822 of the standard map service website of the Ministry of Natural Resources, the base map boundary has not been modified. The same below
| 变化状态 Change state | 情景 Scence | KP | KH | 气候变化驱动 Climate change driven/% | 人类活动驱动 Human activity driven/% | 说明 Explanation |
|---|---|---|---|---|---|---|
| 植被恢复 Vegetation restoration (KA>0) | 1 | >0 | >0 | 100 | 0 | 气候变化主导改善 |
| 2 | <0 | <0 | 0 | 100 | 人类活动主导改善 | |
| 3 | >0 | <0 | 共同主导改善,以其各自变化量 所占的比例为各自的相对贡献 | |||
| 植被退化 Vegetation degradation (KA<0) | 4 | <0 | <0 | 100 | 0 | 气候变化主导退化 |
| 5 | >0 | >0 | 0 | 100 | 人类活动主导退化 | |
| 6 | <0 | >0 | 共同主导退化,以其各自变化量 所占的比例为各自的相对贡献 |
表1 气候变化与人类活动在植被净初级生产力变化中相对作用的评价方法
Table 1 Evaluation method of the relative role of climate change and human activities in the change of NPP
| 变化状态 Change state | 情景 Scence | KP | KH | 气候变化驱动 Climate change driven/% | 人类活动驱动 Human activity driven/% | 说明 Explanation |
|---|---|---|---|---|---|---|
| 植被恢复 Vegetation restoration (KA>0) | 1 | >0 | >0 | 100 | 0 | 气候变化主导改善 |
| 2 | <0 | <0 | 0 | 100 | 人类活动主导改善 | |
| 3 | >0 | <0 | 共同主导改善,以其各自变化量 所占的比例为各自的相对贡献 | |||
| 植被退化 Vegetation degradation (KA<0) | 4 | <0 | <0 | 100 | 0 | 气候变化主导退化 |
| 5 | >0 | >0 | 0 | 100 | 人类活动主导退化 | |
| 6 | <0 | >0 | 共同主导退化,以其各自变化量 所占的比例为各自的相对贡献 |
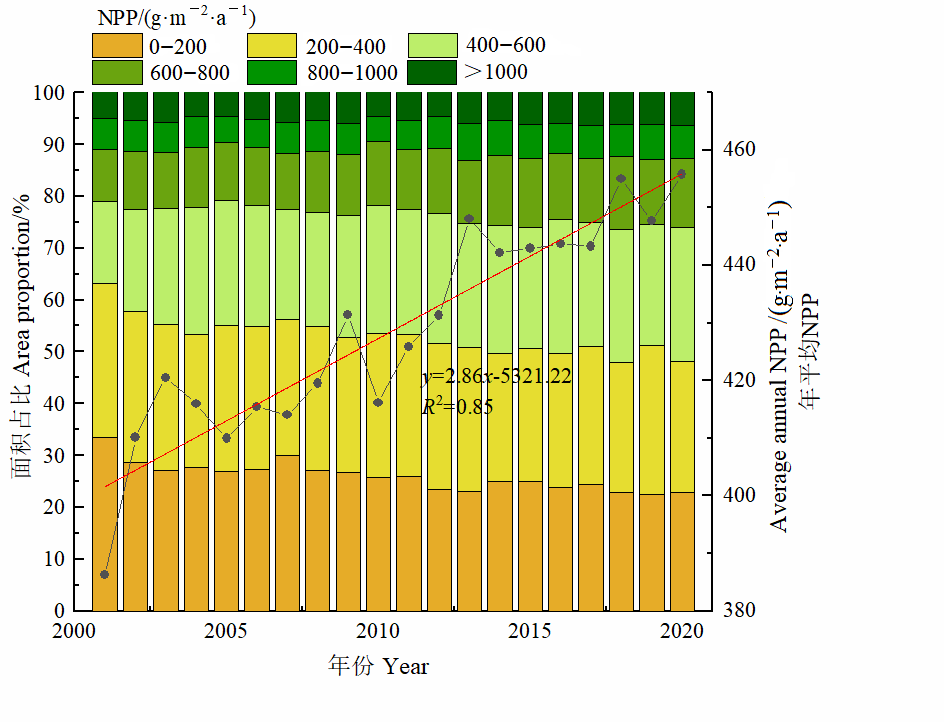
图2 2001-2020年中国平均植被NPP与各级NPP面积占比年际变化
Figure 2 Interannual variation of average NPP and percentage of each class of NPP in China from 2001 to 2020
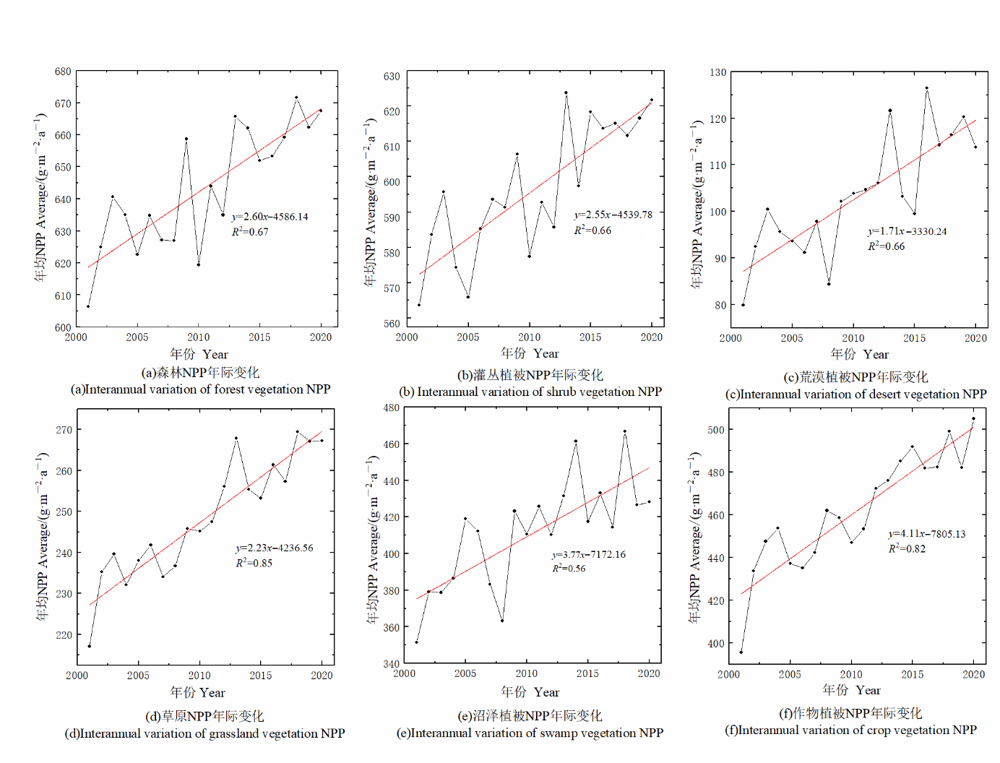
图3 2001-2020年中国不同植被类型平均NPP年际变化
Figure 3 Interannual variation of average NPP of different vegetation types in China from 2001 to 2020
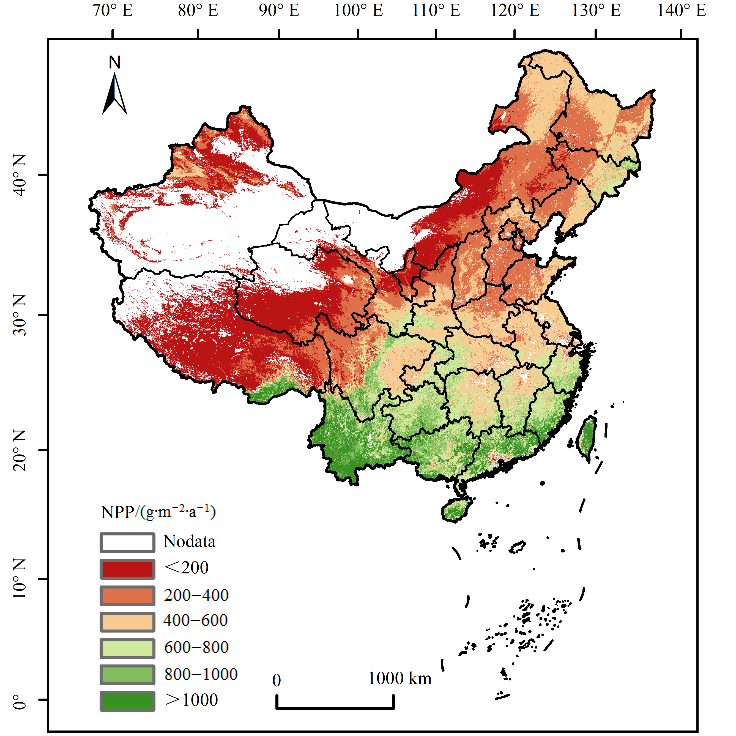
图4 2001-2020年中国平均植被NPP的分布特征
Figure 4 Distribution features of average NPP in China from 2001 to 2020
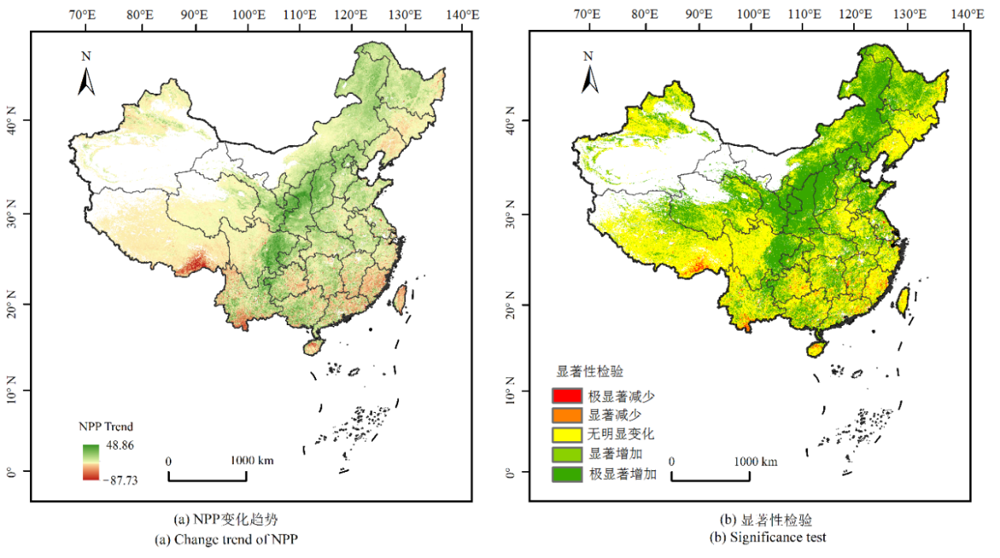
图5 2001-2020年中国植被NPP变化趋势及显著性检验
Figure 5 Change trend and significance test of NPP in China from 2001 to 2020
| 变化类型 Change type | 判断依据 Judgment based | 面积占比 Area proportion/% |
|---|---|---|
| 极显著增加 Extremely significant increase | Sen>0, |Z|>2.58 | 33.50 |
| 显著增加 Significant increase | Sen>0, |Z|>1.96 | 15.54 |
| 无明显变化 Unobvious change | |Z|≤1.96 | 47.17 |
| 显著减少 Significant decrease | Sen<0, |Z|>1.96 | 1.15 |
| 极显著减少 Extremely significant decrease | Sen<0, |Z|>2.58 | 2.64 |
表2 2001-2020年中国NPP变化趋势统计
Table 2 Statistics of NPP change trend in China from 2001 to 2020
| 变化类型 Change type | 判断依据 Judgment based | 面积占比 Area proportion/% |
|---|---|---|
| 极显著增加 Extremely significant increase | Sen>0, |Z|>2.58 | 33.50 |
| 显著增加 Significant increase | Sen>0, |Z|>1.96 | 15.54 |
| 无明显变化 Unobvious change | |Z|≤1.96 | 47.17 |
| 显著减少 Significant decrease | Sen<0, |Z|>1.96 | 1.15 |
| 极显著减少 Extremely significant decrease | Sen<0, |Z|>2.58 | 2.64 |
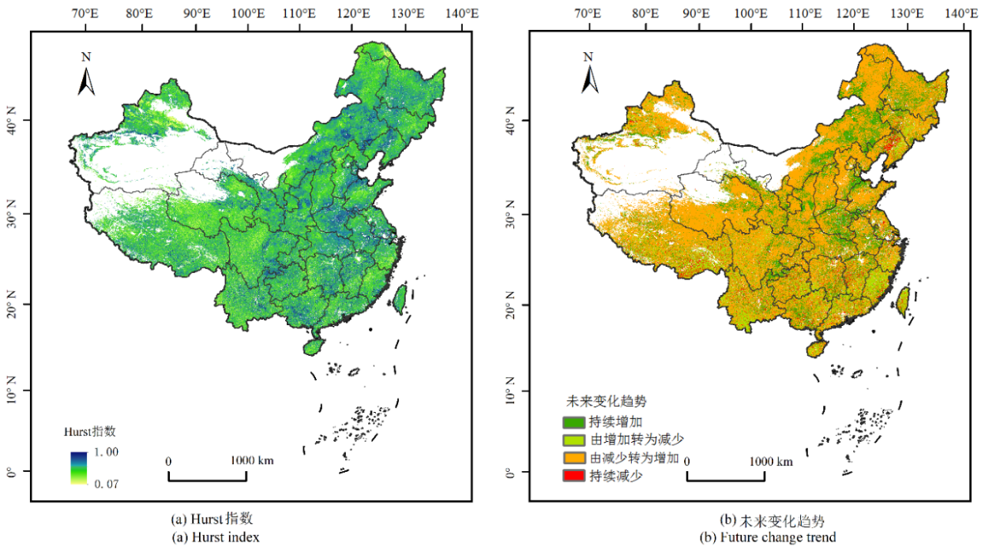
图6 中国植被NPP Hurst指数及其未来变化趋势
Figure 6 NPP Hurst index of vegetation in China and its future change trend
| 变化类型 Change type | 判断依据 Judgment based | 面积占比 Area proportion/% |
|---|---|---|
| 持续增加 Continuous increase | Sen>0, Hurst>0.5 | 21.03 |
| 增加转为减少Increase to decrease | Sen>0, Hurst<0.5 | 11.47 |
| 减少转为增加Decrease to increase | Sen<0, Hurst>0.5 | 63.35 |
| 持续减少 Continue decrease | Sen<0, Hurst>0.5 | 4.15 |
表3 中国植被NPP未来变化趋势统计
Table 3 Statistics of future change trend of NPP in China
| 变化类型 Change type | 判断依据 Judgment based | 面积占比 Area proportion/% |
|---|---|---|
| 持续增加 Continuous increase | Sen>0, Hurst>0.5 | 21.03 |
| 增加转为减少Increase to decrease | Sen>0, Hurst<0.5 | 11.47 |
| 减少转为增加Decrease to increase | Sen<0, Hurst>0.5 | 63.35 |
| 持续减少 Continue decrease | Sen<0, Hurst>0.5 | 4.15 |
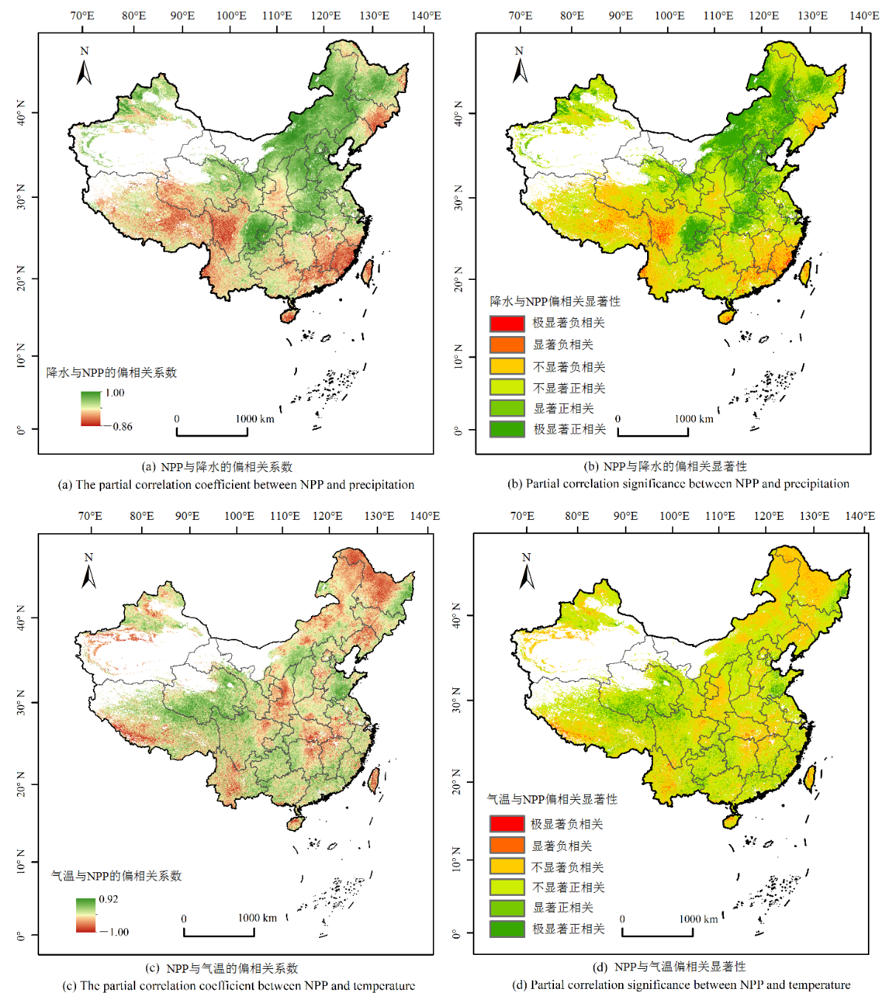
图7 植被NPP与降水和气温的偏相关系数及其显著性检验结果
Figure 7 Partial correlation coefficient and significance test results of NPP with precipitation and temperature
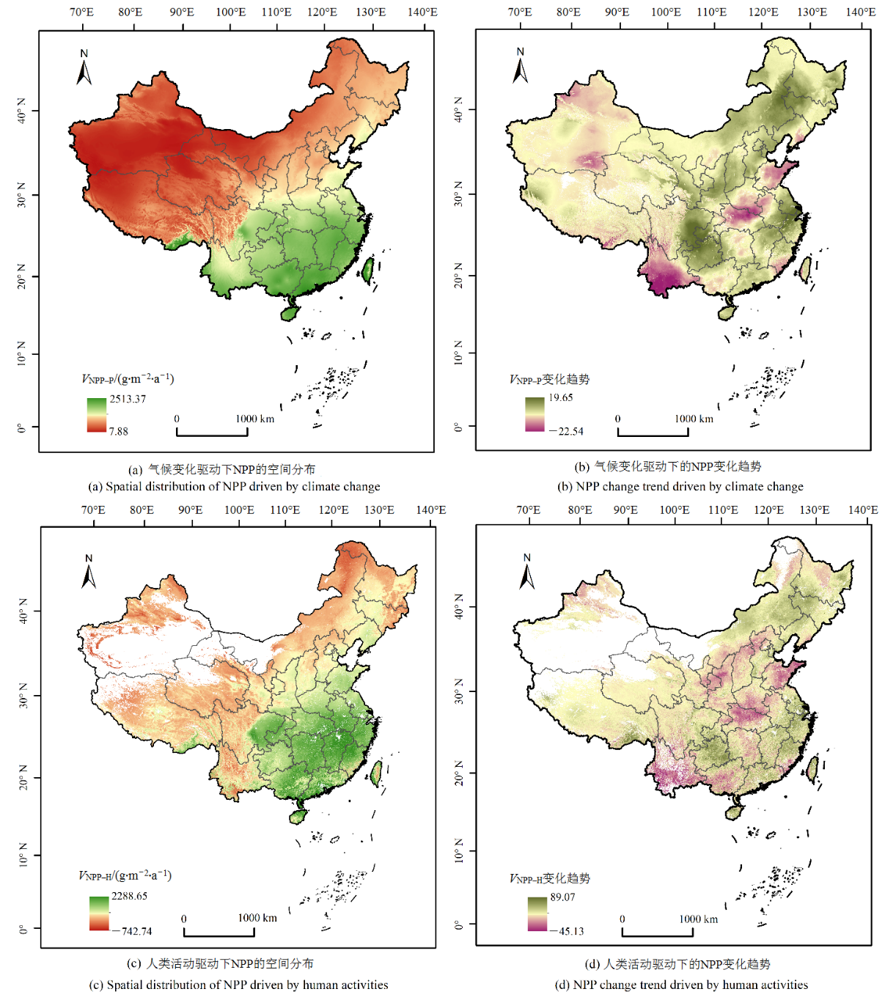
图8 2001-2020年气候变化和人类活动驱动下中国植被NPP的空间分布及变化趋势
Figure 8 Spatial distribution and change trend of NPP driven by climate change and human activities in China from 2001 to 2020
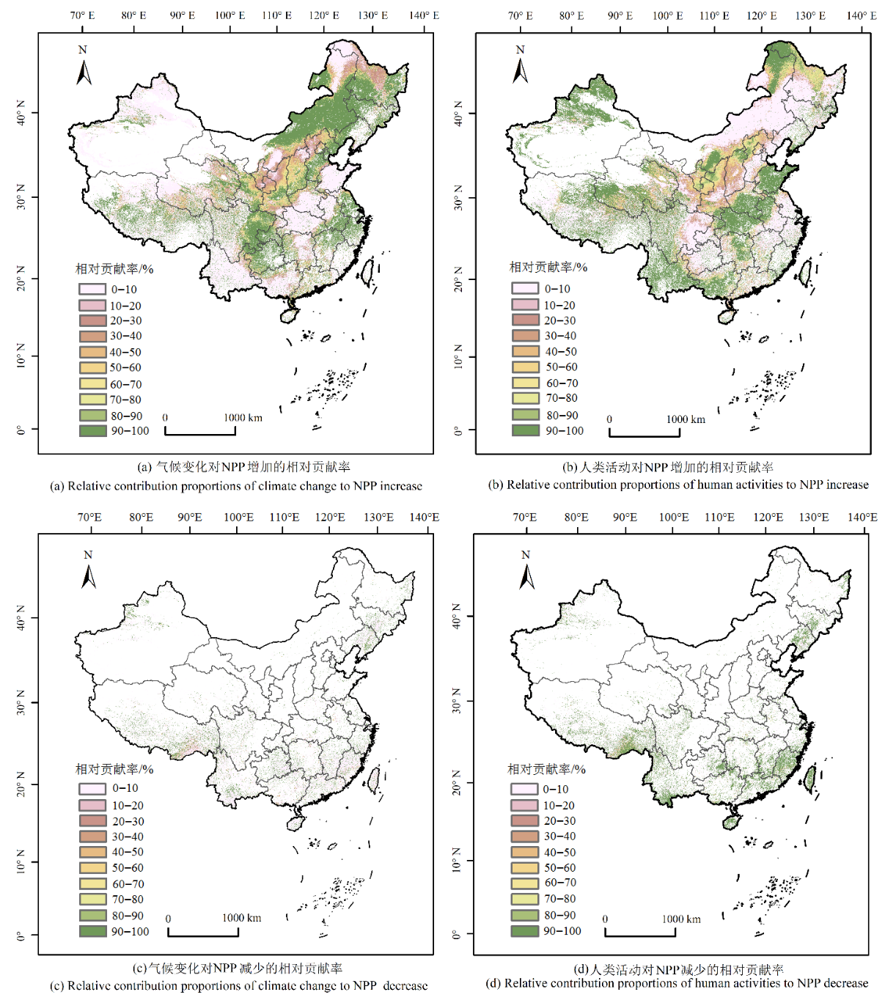
图9 气候变化与人类活动对中国NPP变化相对贡献率的空间分布
Figure 9 Spatial distribution of the relative contribution proportions of climate change and human activities to NPP changes in China
| [1] |
FENSHOLT R, LANGANKE T, RASMUSSEN K, et al., 2012. Greenness in semi-arid areas across the globe 1981-2007-An Earth Observing Satellite based analysis of trends and drivers[J]. Remote Sensing of Environment, 121: 144-158.
DOI URL |
| [2] |
GE W Y, DENG L Q, WANG F, et al., 2021. Quantifying the contributions of human activities and climate change to vegetation net primary productivity dynamics in China from 2001 to 2016[J]. Science of the Total Environment, 773: 145648.
DOI URL |
| [3] |
JI P, YUAN X, 2020. Underestimation of the warming trend over the Tibetan Plateau during 1998-2013 by global land data assimilation systems and atmospheric reanalyses[J]. Journal of Meteorological Research, 34(1): 88-100.
DOI URL |
| [4] |
JIANG W G, YUAN L H, WANG W J, et al., 2015. Spatio-temporal analysis of vegetation variation in the Yellow River Basin[J]. Ecological Indicators, 51: 117-126.
DOI URL |
| [5] | LIETH H, 1972. Modeling the primary productivity of the world[J]. Nature and Resources, 8(2): 5-10. |
| [6] | LIETH H, WHITTAKER R H, 1975. Primary Productivity of the Biosphere[M]. Berlin: Springer-Verlag, 14: 274. |
| [7] |
LIU C Y, DONG X F, LIU Y Y, 2015, Changes of NPP and their relationship to climate factors based on the transformation of different scales in Gansu, China[J]. Catena, 125: 190-199.
DOI URL |
| [8] |
LIU Z H, HU M Q, HU Y M, et al., 2018. Estimation of net primary productivity of forests by modified CASA models and remotely sensed data[J]. International Journal of Remote Sensing, 39(4): 1092-1116.
DOI URL |
| [9] | PIAO S L, FANG J, CHEN A, 2003. Seasonal dynamics of terrestrial net primary production in response to climate changes in China[J]. Acta Botanica Sinica, 45(3): 269-275. |
| [10] |
SUN Q L, LI B L, ZHANG T, et al., 2017. An improved Biome-BGC model for estimating net primary productivity of alpine meadow on the Qinghai-Tibet Plateau[J]. Ecological Modelling, 350: 55-68.
DOI URL |
| [11] |
VENTER Z S, HAWKINS H J, CRAMER M D, et al., 2021. Mapping soil organic carbon stocks and trends with satellite-driven high resolution maps over South Africa[J]. Science of the Total Environment, 771: 145384.
DOI URL |
| [12] |
WANG C D, LI W Q, SUN M X, et al., 2021. Exploring the formulation of ecological management policies by quantifying interregional primary ecosystem service flows in Yangtze River Delta Region, China[J]. Journal of Environmental Management, 284: 112042.
DOI URL |
| [13] |
ZHAO M S, HEINSCH F A, NEMANI R R, et al., 2005. Improvements of the MODIS terrestrial gross and net primary production global data set[J]. Remote Sensing of Environment, 95(2): 164-176.
DOI URL |
| [14] | 柴立夫, 田莉, 奥勇, 等, 2021. 人类活动干扰对青藏高原植被覆盖变化的影响[J]. 水土保持研究, 28(6): 382-388. |
| CHAI L F, TIAN L, AO Y, et al., 2021. Influence human disturbance on the change of vegetation cover in the Tibetan Plateau[J]. Research of Soil and Water Conservation, 28(6): 382-388. | |
| [15] | 陈峰, 李红波, 刘亚静, 2018. 基于GIS和CASA的滇南山区植被NPP时空分异及其影响因素—以云南省元阳县为例[J]. 生态学杂志, 37(7): 2148-2158. |
| CHEN F, LI H B, LIU Y J, 2018. Spatio-temporal differentiation and influencing factors of vegetation net primary productivity using GIS and CASA: A case study in Yuanyang County, Yunnan[J]. Chinese Journal of Ecology, 37(7): 2148-2158. | |
| [16] | 陈舒婷, 郭兵, 杨飞, 等, 2020. 2000-2015年青藏高原植被NPP时空变化格局及其对气候变化的响应[J]. 自然资源学报, 35(10): 2511-2527. |
|
CHEN S T, GUO B, YANG F, et al., 2020. Spatial and temporal patterns of NPP and its response to climate change in the Qinghai-Tibet Plateau from 2000 to 2015[J]. Journal of Natural Resources, 35(10): 2511-2527.
DOI URL |
|
| [17] | 程春晓, 徐宗学, 王志慧, 等, 2014. 2001-2010年东北三省植被净初级生产力模拟与时空变化分析[J]. 资源科学, 36(11): 2401-2412. |
| CHENG C X, XU Z X, WANG Z H, et al., 2014. Temporal-spatial change simulation and analysis of net primary productivity in northeast China from 2001 to 2010[J]. Resources Science, 36(11): 2401-2412. | |
| [18] | 樊奇, 2021. 中国共产党领导植树造林的百年探索及其优化路径[J]. 干旱区资源与环境, 35(10): 1-6. |
| FAN Q, 2021. A century of exploration of afforestation led by the Chinese Communist Party and its optimization path[J]. Journal of Arid Land Resources and Environment, 35(10): 1-6. | |
| [19] | 高旭旭, 于长文, 张婧, 等, 2022. 定量评估京津冀气候变化和人类活动对植被NPP变化的相对作用[J]. 中国农业气象, 43(2): 124-136. |
| GAO X X, YU C W, ZHANG J, et al., 2022. Quantitative assessment on the relative influence of climatic change and human activities on net primary productivity in Beijing-Tianjin-Hebei[J]. Chinese Journal of Agrometeorology, 43(2): 124-136. | |
| [20] | 耿庆玲, 陈晓青, 赫晓慧, 等, 2022. 中国不同植被类型归一化植被指数对气候变化和人类活动的响应[J]. 生态学报, 42(9): 3557-3568. |
| GENG Q L, CHEN X Q, HE X H, et al., 2022. Vegetation dynamics and its response to climate change and human activities based on different vegetation types in China. Acta Ecologica Sinica, 42(9): 3557-3568. | |
| [21] | 韩王亚, 张超, 曾源, 等, 2018. 2000-2015年拉萨河流域NPP时空变化及驱动因子[J]. 生态学报, 38(24): 8787-8798. |
| HAN W Y, ZHANG C, ZENG Y, et al., 2018. Spatio-temporal changes and driving factors in the net primary productivity of Lhasa River Basin from 2000 to 2015[J]. Acta Ecologica Sinica, 38(24): 8787-8798. | |
| [22] | 姬盼盼, 高敏华, 杨晓东, 2019. 中国西北部干旱区NPP驱动力分析—以新疆伊犁河谷和天山山脉部分区域为例[J]. 生态学报, 39(8): 2995-3006. |
| JI P P, GAO M H, YANG X D, 2019. Analysis of NPP driving force in an arid region of northwest China: A case study in Yili Valley and parts of Tianshan Mountains, Xinjiang, China[J]. Acta Ecologica Sinica, 39(8): 2995-3006. | |
| [23] | 李登科, 王钊, 2018. 基于MOD17A3的中国陆地植被NPP变化特征分析[J]. 生态环境学报, 27(3): 397-405. |
| LI D K, WANG Z, 2018. The characteristics of NPP of terrestrial vegetation in China based on MOD17A3 data[J]. Ecology and Environmental Sciences, 27(3): 397-405. | |
| [24] | 李登科, 王钊, 2022. 气候变化和人类活动对陕西省植被NPP影响的定量分析[J]. 生态环境学报, 31(6): 1071-1079. |
| LI D K, WANG Z, 2022. Quantitative analysis of the impact of climate change and human activities on vegetation NPP in Shaanxi Province[J]. Ecology and Environmental Sciences, 31(6): 1071-1079. | |
| [25] | 李诗瑶, 丛士翔, 王融融, 等, 2022. 气候变化和人类活动对盐池县植被净初级生产力的影响[J]. 干旱区地理, 45(4): 1186-1199. |
| LI S Y, CONG S X, WANG R R, et al., 2022. Effects of climate change and human activities on net primary productivity of vegetation in Yanchi County[J]. Arid Land Geography, 45(4): 1186-1199. | |
| [26] | 刘凤, 曾永年, 2019. 近16年青海高原植被NPP时空格局变化及气候与人为因素的影响[J]. 生态学报, 39(5): 1528-1540. |
| LIU F, ZENG Y N, 2019. Spatial-temporal change in vegetation Net Primary Productivity and its response to climate and human activities in Qinghai Plateau in the past 16 years[J]. Acta Ecologica Sinica, 39(5): 1528-1540. | |
| [27] | 刘欢, 刘冰, 花利忠, 等, 2018. 福建省植被NPP时空格局及其驱动力分析[J]. 测绘科学, 43(3): 51-57. |
| LIU H, LIU B, HUA L Z, et al., 2018. Analysis of vegetation NPP spatiotemporal pattern and driving force in Fujian[J]. Science of Surveying and Mapping, 43(3): 51-57. | |
| [28] | 刘文瑞, 李晓婷, 李彤, 等, 2022. 基于MODIS和CASA模型的伊春市森林植被NPP变化特征及其影响因子分析[J]. 生态学杂志, 41(1): 150-158. |
| LIU W R, LI X T, LI T, et al., 2022. Spatiotemporal variations of forest NPP and related driving factors based on MODIS and CASA models in Yichun[J]. Chinese Journal of Ecology, 41(1): 150-158. | |
| [29] | 茆杨, 蒋勇军, 张彩云, 等, 2022. 近20年来西南地区植被净初级生产力时空变化与影响因素及其对生态工程响应[J]. 生态学报, 42(7): 2878-2890. |
| MAO Y, JIANG Y J, ZHANG C Y, et al., 2022. Spatio-temporal changes and influencing factors of vegetation net primary productivity in southwest China in the past 20 years and its response to ecological engineering[J]. Acta Ecologica Sinica, 42(7): 2878-2890. | |
| [30] | 史雯雨, 杨胜勇, 李增永, 等, 2021. 近57年金沙江流域气温变化特征及未来趋势预估[J]. 水土保持研究, 28(1): 211-217. |
| SHI W Y, YANG S Y, LI Z Y, et al., 2021. Variation characteristics and the future trend estimation of temperature in Chinsha River Basin over the past 57 years[J]. Research of Soil and Water Conservation, 28(1): 211-217. | |
| [31] | 苏胜涛, 曾源, 赵旦, 等, 2022. 中国陆地植被净初级生产力估算模型优化与分析—基于中国生态系统研究网络数据[J]. 生态学报, 42(4): 1276-1289. |
| SU S T, ZENG Y, ZHAO D, et al., 2022. Optimization of net primary productivity estimation model for terrestrial vegetation in China based on CERN data[J]. Acta Ecologica Sinica, 42(4): 1276-1289. | |
| [32] | 孙金珂, 牛海鹏, 袁鸣, 2020. 中国陆地植被生态系统NPP空间格局变迁分析[J]. 农业机械学报, 51(6): 162-168. |
| SUN J K, NIU H P, YUAN M, 2020. Spatial pattern change and analysis of NPP in terrestrial vegetation ecosystem in China[J]. Transactions of the Chinese Society for Agricultural Machinery, 51(6): 162-168. | |
| [33] | 田义超, 黄远林, 张强, 等, 2019. 北部湾南流江流域植被净初级生产力时空分布及其驱动因素[J]. 生态学报, 39(21): 8156-8171. |
| TIAN Y C, HUANG Y L, ZHANG Q, et al., 2019. Spatiotemporal distribution of net primary productivity and its driving factors in the Nanliu River basin in the Beibu Gulf[J]. Acta Ecologica Sinica, 39(21): 8156-8171. | |
| [34] | 涂海洋, 古丽·加帕尔, 于涛, 等, 2023. 中国陆地生态系统净初级生产力时空变化特征及影响因素分析[J/OL]. 生态学报, 43(3). |
| TU H Y, JIAPAER GULI, YU T, et al., 2023. Analysis of spatio-temporal variation characteristics and influencing factors of net primary productivity in terrestrial ecosystems of China[J/OL]. Acta Ecologica Sinica, 43(3). | |
| [35] | 涂又, 姜亮亮, 刘睿, 等, 2021. 1982-2015年中国植被NDVI时空变化特征及其驱动分析[J]. 农业工程学报, 37(22): 75-84. |
| TU Y, JIAN L L, LIU R, et al., 2021. Spatiotemporal changes of vegetation NDVI and its driving forces in China during 1982-2015[J]. Transactions of the Chinese Society of Agricultural Engineering, 37(22): 75-84. | |
| [36] | 王轶虹, 史学正, 王美艳, 等, 2017. 2001-2010年中国农田生态系统NPP的时空演变特征[J]. 土壤学报, 54(2): 319-330. |
| WANG Y H, SHI X Z, WANG M Y, et al., 2017. Spatio-temporal variation of NPP in cropland ecosystem of China during the years from 2001 to 2010[J]. Acta Pedologica Sinica, 54(2): 319-330. | |
| [37] | 解晗, 同小娟, 李俊, 等, 2022. 2000-2018年黄河流域生长季NDVI、EVI变化及其对气候因子的响应[J]. 生态学报, 42(11): 4536-4549. |
| XIE H, TONG X J, LI J, et al., 2022. Changes of NDVI and EVI and their responses to climatic variables in the Yellow River Basin during the growing season of 2000-2018[J]. Acta Ecologica Sinica, 42(11): 4536-4549. | |
| [38] | 薛晓玉, 王晓云, 段含明, 等, 2021. 北方农牧交错带植被NPP的时空变化及其驱动因子分析[J]. 水土保持研究, 28(2): 190-197. |
| XUE X Y, WANG X Y, DUAN H M, et al., 2021. Temporal and spatial changes of NPP and its causes in the agricultural pastoral ecotone of northern China[J]. Research of Soil and Water Conservation, 28(2): 190-197. | |
| [39] | 闫妍, 覃金华, 房磊, 等, 2022. 湖南省植被净初级生产力时空动态及其与气候因素的关系[J]. 生态学杂志, 41(8): 1535-1544. |
| YAN Y, QIN J H, FANG L, et al., 2022. Spatiotemporal dynamics of vegetation net primary productivity and its relationships with climatic factors in Hunan Province[J]. Chinese Journal of Ecology, 41(8): 1535-1544. | |
| [40] | 杨丹, 王晓峰, 2022. 黄土高原气候和人类活动对植被NPP变化的影响[J]. 干旱区研究, 39(2): 584-593. |
| YANG D, WANG X F, 2022. Contribution of climatic change and human activities to changes in net primary productivity in the Loess Plateau[J]. Arid Zone Research, 39(2): 584-593. | |
| [41] | 杨潇, 郭兵, 韩保民, 等, 2019. 青藏高原NPP时空演变格局及其驱动机制分析[J]. 长江流域资源与环境, 28(12): 3038-3050. |
| YANG X, GUO B, HAN B M, et al., 2019. Analysis on the spatio-temporal evolution pattern and driving mechanism of NPP in the Qinghai-Tibet Plateau[J]. Resources and Environment in the Yangtze Basin, 28(12): 3038-3050. | |
| [42] | 赵志平, 吴晓莆, 李果, 等, 2015. 2009-2011年我国西南地区旱灾程度及其对植被净初级生产力的影响[J]. 生态学报, 35(2): 350-360. |
| ZHAO Z P, WU X P, LI G, et al., 2015. Drought in southwestern China and its impact on the net primary productivity of vegetation from 2009-2011[J]. Acta Ecologica Sinica, 35(2): 350-360. | |
| [43] | 周刊社, 杜军, 沈旭, 等, 2021. 气候变化背景下羌塘国家自然保护区植被净初级生产力时空变化[J]. 中国农业气象, 42(8): 627-641. |
| ZHOU K S, DU J, SHEN X, et al., 2021. Spatial and temporal variability of vegetation net primary productivity in Qiangtang National Nature Reserve under climate change[J]. Chinese Journal of Agrometeorology, 42(8): 627-641. | |
| [44] | 周妍妍, 朱敏翔, 郭晓娟, 等, 2019. 疏勒河流域气候变化和人类活动对植被NPP的相对影响评价[J]. 生态学报, 39(14): 5127-5137. |
| ZHOU Y Y, ZHU M X, GUO X J, et al., 2019. Relative effects of climate change and human activities on net primary productivity in Shule River Basin[J]. Acta Ecologica Sinica, 39(14): 5127-5137. | |
| [45] | 朱锋, 刘志明, 王宗明, 等, 2010. 东北地区农田净初级生产力时空特征及其影响因素分析[J]. 资源科学, 32(11): 2079-2084. |
| ZHU F, LIU Z M, WANG Z M, et al., 2010. Temporal-spatial characteristics and factors influencing crop NPP across northeastern China[J]. Resources Science, 32(11): 2079-2084. |
| [1] | 郝蕾, 翟涌光, 戚文超, 兰穹穹. 2001-2020年内蒙古植被碳源/碳汇时空动态及对气候因子的响应[J]. 生态环境学报, 2023, 32(5): 825-834. |
| [2] | 翁升恒, 张玉琴, 姜冬昕, 潘卫华, 李丽纯, 张方敏. 福建省森林植被NEP时空变化及影响因子分析[J]. 生态环境学报, 2023, 32(5): 845-856. |
| [3] | 陈俊芳, 吴宪, 刘啸林, 刘娟, 杨佳绒, 刘宇. 不同土壤水分下元素化学计量对微生物多样性的塑造特征[J]. 生态环境学报, 2023, 32(5): 898-909. |
| [4] | 于菲, 曾海龙, 房怀阳, 付玲芳, 林澍, 董家豪. 典型感潮河网浮游藻类功能群时空变化特征及水质评价[J]. 生态环境学报, 2023, 32(4): 756-765. |
| [5] | 李晖, 李必龙, 葛黎黎, 韩琛惠, 杨倩, 张岳军. 2000-2021年汾河流域植被时空演变特征及地形效应[J]. 生态环境学报, 2023, 32(3): 439-449. |
| [6] | 张鐥文, 杨冉, 侯文星, 王丽丽, 刘爽, 宋汉扬, 赵文吉, 李令军. 生态补水前后永定河两岸植被覆盖度变化及驱动力分析[J]. 生态环境学报, 2023, 32(2): 264-273. |
| [7] | 贾志峰, 刘鹏程, 刘宇, 吴博博, 陈丹姿, 张向飞. 气候变化和人类活动对松辽流域植被覆盖的影响[J]. 生态环境学报, 2023, 32(1): 1-10. |
| [8] | 李威闻, 黄金权, 齐瑜洁, 刘小岚, 刘纪根, 毛治超, 高绣纺. 土壤侵蚀条件下土壤微生物生物量碳含量变化及其影响因素的Meta分析[J]. 生态环境学报, 2023, 32(1): 47-55. |
| [9] | 齐月, 张强, 胡淑娟, 蔡迪花, 赵福年, 陈斐, 张凯, 王鹤龄, 王润元. 黄土高原地区气候变化及其对冬小麦生产潜力的影响[J]. 生态环境学报, 2022, 31(8): 1521-1529. |
| [10] | 邓天乐, 谢立勇, 张凤哲, 赵洪亮, 蒋语童. CO2浓度升高条件下稗草与水稻生长空间竞争关系研究[J]. 生态环境学报, 2022, 31(8): 1566-1572. |
| [11] | 苏泳松, 宋松, 陈叶, 叶子强, 钟润菲, 王昭尧. 珠江三角洲人类活动净氮输入时空特征及其影响因素[J]. 生态环境学报, 2022, 31(8): 1599-1609. |
| [12] | 卢燕宇, 孙维, 方砚秋, 唐为安, 邓汗青, 何冬燕. 基于种植结构的安徽省气候生产潜力估算及粮食安全气候承载力分析[J]. 生态环境学报, 2022, 31(7): 1293-1305. |
| [13] | 李梦华, 韩颖娟, 赵慧, 王云霞. 基于地理探测器的宁夏植被覆盖度时空变化特征及其驱动因子分析[J]. 生态环境学报, 2022, 31(7): 1317-1325. |
| [14] | 柯奇画, 张科利. 基于文献计量的中国水土流失尺度效应研究进展[J]. 生态环境学报, 2022, 31(7): 1489-1498. |
| [15] | 李登科, 王钊. 气候变化和人类活动对陕西省植被NPP影响的定量分析[J]. 生态环境学报, 2022, 31(6): 1071-1079. |
| 阅读次数 | ||||||
|
全文 |
|
|||||
|
摘要 |
|
|||||