生态环境学报 ›› 2022, Vol. 31 ›› Issue (3): 524-534.DOI: 10.16258/j.cnki.1674-5906.2022.03.011
王薇1,2,*( ), 程歆玥1
收稿日期:2021-10-21
出版日期:2022-03-18
发布日期:2022-05-25
通讯作者:
*通信作者作者简介:王薇(1975年生),女,教授,博士,研究方向为建筑技术和人居环境。E-mail: vivi.gan@126.com
基金资助:
WANG Wei1,2,*(), CHENG Xinyue1
Received:2021-10-21
Online:2022-03-18
Published:2022-05-25
摘要:
以PM2.5和PM10为代表的空气污染对城市居民的生活产生了巨大的影响。街道峡谷是城市的重要构成部分,是城市居民生活的主要场所之一。选择合肥市3种典型功能的街道峡谷,监测PM2.5和PM10质量浓度变化,采用相关分析和回归分析等方法,研究不同功能街道峡谷PM2.5和PM10的差异及其影响因素,并采用空气质量评价模型对其空气质量进行评价。结果表明,(1)街道峡谷PM2.5和PM10质量浓度之间具有较高的相关性,波峰出现在08:00—09:00,波谷多出现在14:00—15:00。PM2.5质量浓度波峰为61.22—73.71 μg∙m-3,波谷为32.73—33.59 μg∙m-3;PM10质量浓度波峰为67.65—85.19 μg∙m-3,波谷为37.35—39.81 μg∙m-3,均位于一级标准极限值上下。(2)合肥市办公型街道峡谷与商业型街道峡谷日变化呈明显的下降型双峰形式,居住型街道峡谷呈平稳型双峰形式。街道峡谷PM2.5和PM10质量浓度:办公型>商业型>居住型。街道峡谷内PM2.5和PM10质量浓度峰值多在下沉广场和次干道,低谷值多在主干道绿化带旁和主次干道交叉口。(3)夏季,合肥市街道峡谷PM2.5质量浓度与PM10质量浓度、相对湿度呈现显著的正相关,与空气温度呈现显著的负相关。(4)运用AQI对合肥市夏季不同功能街道峡谷进行评价,其空气质量级别以优良为主,空气质量级别多分布在一级和二级。该研究对合肥市不同功能街道峡谷的污染物浓度进行对照,为街道峡谷特征功能评估提供了基本参数。
中图分类号:
王薇, 程歆玥. 合肥市不同功能街道峡谷PM2.5和PM10时空分布特征及影响因素分析[J]. 生态环境学报, 2022, 31(3): 524-534.
WANG Wei, CHENG Xinyue. Analysis of Temporal and Spatial Distribution Characteristics and Influencing Factors of PM2.5 and PM10 in Different Functional Street Canyons in Hefei City[J]. Ecology and Environment, 2022, 31(3): 524-534.
| 街道峡谷 Street canyon | 商业型 Commerciality | 居住型 Residential | 办公型 Office | ||||||||
|---|---|---|---|---|---|---|---|---|---|---|---|
| 监测日期 Monitoring date | 2021-08-01 | 2021-08-02 | 2021-08-03 | 2021-08-07 | 2021-08-08 | 2021-08-09 | 2021-08-11 | 2021-08-12 | 2021-08-13 | ||
| 监测地点 Monitoring location | 蜀山区三里庵街道长江西路 | 包河区同安街道马鞍山路 | 庐阳区亳州路街道北一环 | ||||||||
| 长宽比 Aspect ratio | 3.7 | 9.4 | 15 | ||||||||
| 周边建筑 Surrounding buildings | 包括国购广场、之心城、 旺城大厦、官亭路步行街等 | 包括珠光花园、新里海顿公馆、 万振逍遥苑、金地国际城等 | 包括庐阳区政府、置地财富 广场、金鼎国际广场等 | ||||||||
表1 不同功能街道峡谷测点信息表
Table 1 Information table of measurement points in different functional streets and canyons
| 街道峡谷 Street canyon | 商业型 Commerciality | 居住型 Residential | 办公型 Office | ||||||||
|---|---|---|---|---|---|---|---|---|---|---|---|
| 监测日期 Monitoring date | 2021-08-01 | 2021-08-02 | 2021-08-03 | 2021-08-07 | 2021-08-08 | 2021-08-09 | 2021-08-11 | 2021-08-12 | 2021-08-13 | ||
| 监测地点 Monitoring location | 蜀山区三里庵街道长江西路 | 包河区同安街道马鞍山路 | 庐阳区亳州路街道北一环 | ||||||||
| 长宽比 Aspect ratio | 3.7 | 9.4 | 15 | ||||||||
| 周边建筑 Surrounding buildings | 包括国购广场、之心城、 旺城大厦、官亭路步行街等 | 包括珠光花园、新里海顿公馆、 万振逍遥苑、金地国际城等 | 包括庐阳区政府、置地财富 广场、金鼎国际广场等 | ||||||||

图1 商业型(a)、居住型(b)和办公型街道峡谷(c)样点布设
Figure 1 Layout of sample points in commercial (a), residential (b) and office street canyons (c)
| 空气质量指数 Air quality index | 空气质量级别 Air quality grade | 空气质量水平 Air quality level |
|---|---|---|
| AQI≤50 | 一级 | 优 |
| 50<AQI≤100 | 二级 | 良 |
| 100<AQI≤150 | 三级 | 轻度污染 |
| 150<AQI≤200 | 四级 | 中度污染 |
| 200<AQI≤300 | 五级 | 重度污染 |
| AQI>300 | 六级 | 严重污染 |
表2 空气污染物浓度等级评价标准
Table 2 Evaluation standards for air pollutant concentration levels
| 空气质量指数 Air quality index | 空气质量级别 Air quality grade | 空气质量水平 Air quality level |
|---|---|---|
| AQI≤50 | 一级 | 优 |
| 50<AQI≤100 | 二级 | 良 |
| 100<AQI≤150 | 三级 | 轻度污染 |
| 150<AQI≤200 | 四级 | 中度污染 |
| 200<AQI≤300 | 五级 | 重度污染 |
| AQI>300 | 六级 | 严重污染 |
| 空气质量指数 Air quality index | ρ/(μg∙m-3) |
|---|---|
| 0 | 0 |
| 50 | 35 |
| 100 | 75 |
| 150 | 115 |
| 200 | 150 |
| 300 | 250 |
| 400 | 350 |
| 500 | 500 |
表3 PM2.5的空气质量指数限值和质量浓度限值
Table 3 Air quality index limit and mass concentration limit of PM2.5
| 空气质量指数 Air quality index | ρ/(μg∙m-3) |
|---|---|
| 0 | 0 |
| 50 | 35 |
| 100 | 75 |
| 150 | 115 |
| 200 | 150 |
| 300 | 250 |
| 400 | 350 |
| 500 | 500 |
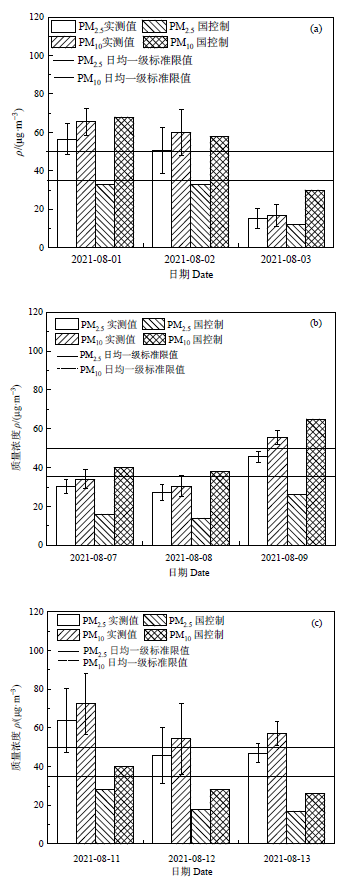
图2 商业型(a)、居住型(b)和办公型街道峡谷(c)PM2.5和PM10日均质量浓度
Figure 2 Commercial (a), residential (b) and office street canyons (c) PM2.5 and PM10 average daily mass concentration
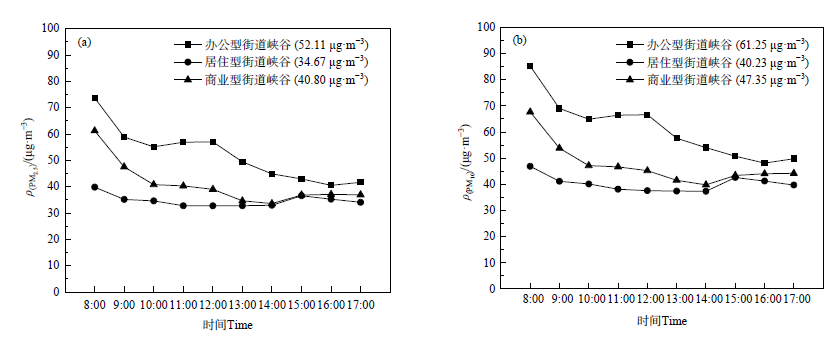
图3 不同功能街道峡谷PM2.5(a)和PM10(b)日变化
Figure 3 Diurnal changes of PM2.5 (a) and PM10 (b) in different functional street canyons
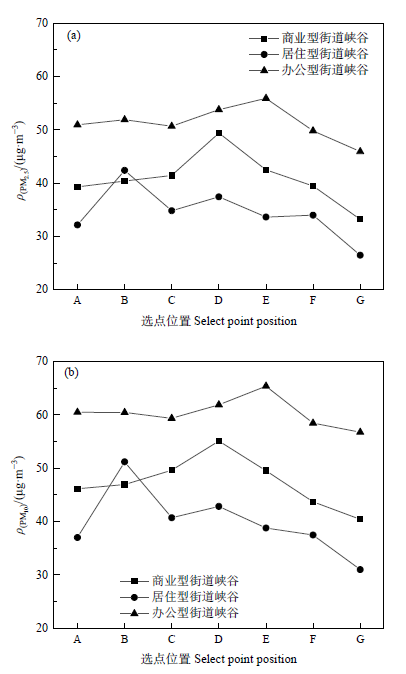
图4 街道峡谷不同测点PM2.5(a)和PM10(b)分布特征
Figure 4 Distribution characteristics of PM2.5 (a) and PM10 (b) at different measurement points in the street canyon
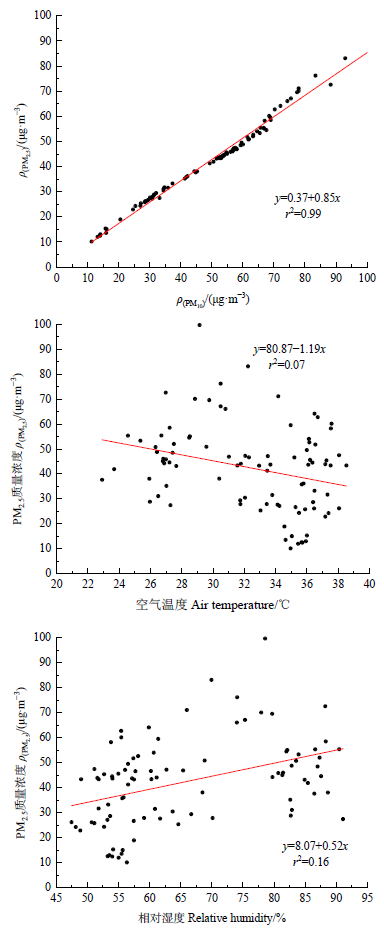
图5 街道峡谷PM2.5和PM10质量浓度和环境因子相关性分析
Figure 5 Correlation analysis of the mass concentration of PM2.5 and PM10 and environmental factors in the street canyon
| PM2.5质量浓度 PM2.5 mass concentration | PM10质量浓度 PM10 mass concentration | 空气温度 Air temperature | 相对湿度 relative humidity |
|---|---|---|---|
| 相关系数Correlation coefficient | 0.993** | -0.289** | 0.407** |
表4 街道峡谷PM2.5和PM10质量浓度和环境因子Person相关性系数
Table 4 Correlation coefficient between the mass concentration of PM2.5 and PM10 in the street canyon and the environmental factor Person
| PM2.5质量浓度 PM2.5 mass concentration | PM10质量浓度 PM10 mass concentration | 空气温度 Air temperature | 相对湿度 relative humidity |
|---|---|---|---|
| 相关系数Correlation coefficient | 0.993** | -0.289** | 0.407** |
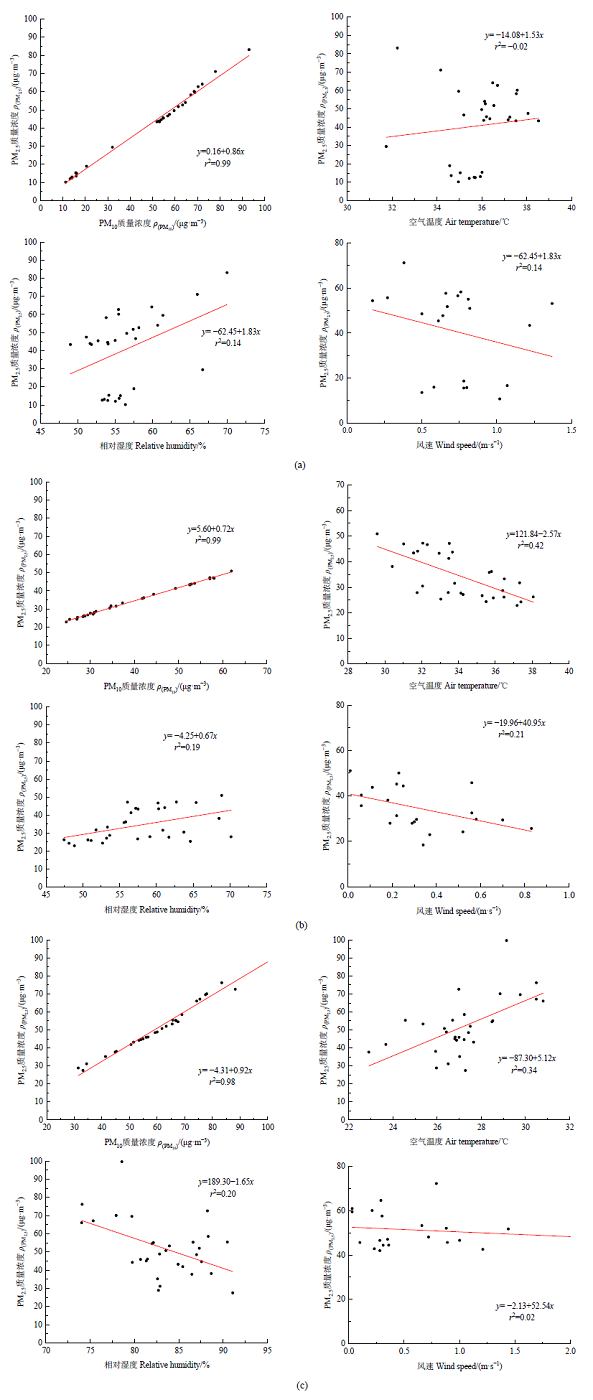
图6 商业型(a)、居住型(b)和办公型街道峡谷(c)PM2.5和PM10质量浓度和环境因子相关性分析
Figure 6 Correlation analysis of PM2.5 and PM10 mass concentrations and environmental factors in commercial (a), residential (b) and office street canyons (c)
| 街道峡谷类型 Street canyon type | 选点位置 Select point position | PM2.5 | PM10 | |||||||
|---|---|---|---|---|---|---|---|---|---|---|
| ρ(PM2.5)/ (μg∙m-3) | AQI | 空气质量水平 Air quality level | 空气质量级别 Air quality grade | ρ(PM10)/ (μg∙m-3) | AQI | 空气质量水平 Air quality level | 空气质量级别 Air quality grade | |||
| 办公型 Office | A | 39.28 | 55.35 | 良 | 二级 | 46.15 | 63.94 | 良 | 二级 | |
| B | 40.38 | 56.73 | 良 | 二级 | 46.92 | 64.90 | 良 | 二级 | ||
| C | 41.42 | 58.03 | 良 | 二级 | 49.63 | 68.29 | 良 | 二级 | ||
| D | 49.38 | 67.98 | 良 | 二级 | 55.10 | 75.13 | 良 | 二级 | ||
| E | 42.48 | 59.35 | 良 | 二级 | 49.54 | 68.18 | 良 | 二级 | ||
| F | 39.45 | 55.56 | 良 | 二级 | 43.70 | 60.88 | 良 | 二级 | ||
| G | 33.18 | 47.40 | 优 | 一级 | 40.43 | 56.79 | 良 | 二级 | ||
| 平均 | 40.80 | 57.25 | 良 | 二级 | 47.35 | 65.44 | 良 | 二级 | ||
| 居住型 Residential | A | 32.16 | 45.94 | 优 | 一级 | 37.01 | 52.51 | 良 | 二级 | |
| B | 42.38 | 59.23 | 良 | 二级 | 51.20 | 70.25 | 良 | 二级 | ||
| C | 34.81 | 49.73 | 优 | 一级 | 40.71 | 57.14 | 良 | 二级 | ||
| D | 37.42 | 53.03 | 良 | 二级 | 42.84 | 59.80 | 良 | 二级 | ||
| E | 33.62 | 48.03 | 优 | 一级 | 38.79 | 54.74 | 良 | 二级 | ||
| F | 33.98 | 48.54 | 优 | 一级 | 37.47 | 53.09 | 良 | 二级 | ||
| G | 26.47 | 37.81 | 优 | 一级 | 30.98 | 44.26 | 优 | 一级 | ||
| 平均 | 34.41 | 49.16 | 优 | 一级 | 39.86 | 56.08 | 良 | 二级 | ||
| 商业型 Commerciality | A | 50.91 | 69.89 | 良 | 二级 | 60.49 | 81.86 | 良 | 二级 | |
| B | 51.87 | 71.09 | 良 | 二级 | 60.45 | 81.81 | 良 | 二级 | ||
| C | 50.66 | 62.53 | 良 | 二级 | 59.36 | 80.45 | 良 | 二级 | ||
| D | 53.76 | 73.45 | 良 | 二级 | 61.90 | 83.63 | 良 | 二级 | ||
| E | 55.90 | 76.13 | 良 | 二级 | 65.39 | 87.99 | 良 | 二级 | ||
| F | 49.79 | 68.49 | 良 | 二级 | 58.45 | 79.31 | 良 | 二级 | ||
| G | 45.91 | 63.64 | 良 | 二级 | 56.76 | 77.20 | 良 | 二级 | ||
| 平均 | 51.26 | 70.33 | 良 | 二级 | 60.40 | 81.75 | 良 | 二级 | ||
表5 不同功能街道峡谷空气质量评价
Table 5 Evaluation of air quality in different functional streets and valleys
| 街道峡谷类型 Street canyon type | 选点位置 Select point position | PM2.5 | PM10 | |||||||
|---|---|---|---|---|---|---|---|---|---|---|
| ρ(PM2.5)/ (μg∙m-3) | AQI | 空气质量水平 Air quality level | 空气质量级别 Air quality grade | ρ(PM10)/ (μg∙m-3) | AQI | 空气质量水平 Air quality level | 空气质量级别 Air quality grade | |||
| 办公型 Office | A | 39.28 | 55.35 | 良 | 二级 | 46.15 | 63.94 | 良 | 二级 | |
| B | 40.38 | 56.73 | 良 | 二级 | 46.92 | 64.90 | 良 | 二级 | ||
| C | 41.42 | 58.03 | 良 | 二级 | 49.63 | 68.29 | 良 | 二级 | ||
| D | 49.38 | 67.98 | 良 | 二级 | 55.10 | 75.13 | 良 | 二级 | ||
| E | 42.48 | 59.35 | 良 | 二级 | 49.54 | 68.18 | 良 | 二级 | ||
| F | 39.45 | 55.56 | 良 | 二级 | 43.70 | 60.88 | 良 | 二级 | ||
| G | 33.18 | 47.40 | 优 | 一级 | 40.43 | 56.79 | 良 | 二级 | ||
| 平均 | 40.80 | 57.25 | 良 | 二级 | 47.35 | 65.44 | 良 | 二级 | ||
| 居住型 Residential | A | 32.16 | 45.94 | 优 | 一级 | 37.01 | 52.51 | 良 | 二级 | |
| B | 42.38 | 59.23 | 良 | 二级 | 51.20 | 70.25 | 良 | 二级 | ||
| C | 34.81 | 49.73 | 优 | 一级 | 40.71 | 57.14 | 良 | 二级 | ||
| D | 37.42 | 53.03 | 良 | 二级 | 42.84 | 59.80 | 良 | 二级 | ||
| E | 33.62 | 48.03 | 优 | 一级 | 38.79 | 54.74 | 良 | 二级 | ||
| F | 33.98 | 48.54 | 优 | 一级 | 37.47 | 53.09 | 良 | 二级 | ||
| G | 26.47 | 37.81 | 优 | 一级 | 30.98 | 44.26 | 优 | 一级 | ||
| 平均 | 34.41 | 49.16 | 优 | 一级 | 39.86 | 56.08 | 良 | 二级 | ||
| 商业型 Commerciality | A | 50.91 | 69.89 | 良 | 二级 | 60.49 | 81.86 | 良 | 二级 | |
| B | 51.87 | 71.09 | 良 | 二级 | 60.45 | 81.81 | 良 | 二级 | ||
| C | 50.66 | 62.53 | 良 | 二级 | 59.36 | 80.45 | 良 | 二级 | ||
| D | 53.76 | 73.45 | 良 | 二级 | 61.90 | 83.63 | 良 | 二级 | ||
| E | 55.90 | 76.13 | 良 | 二级 | 65.39 | 87.99 | 良 | 二级 | ||
| F | 49.79 | 68.49 | 良 | 二级 | 58.45 | 79.31 | 良 | 二级 | ||
| G | 45.91 | 63.64 | 良 | 二级 | 56.76 | 77.20 | 良 | 二级 | ||
| 平均 | 51.26 | 70.33 | 良 | 二级 | 60.40 | 81.75 | 良 | 二级 | ||
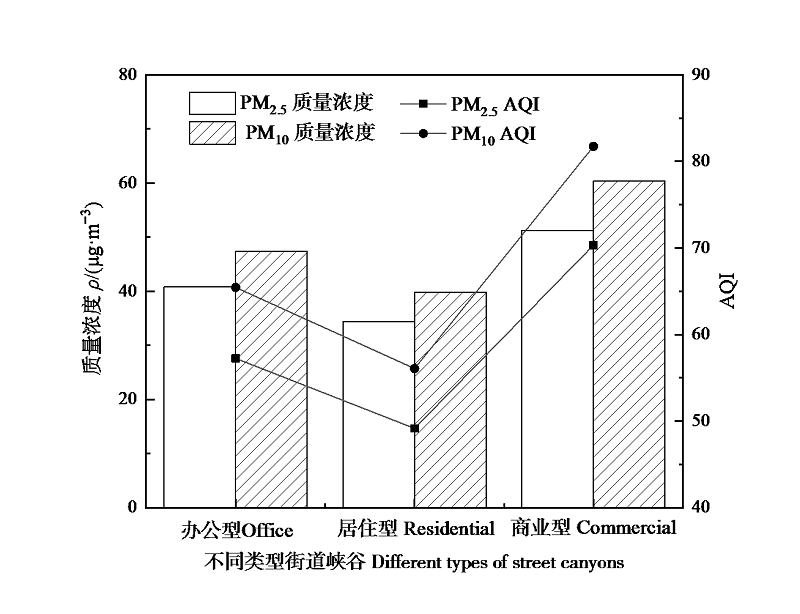
图7 不同功能街道峡谷AQI对比
Figure 7 Comparison of AQI of different functional street canyons
| [1] |
AHMADI M, MIRJALILY S, OLOOMI S, 2020. Simulation of pollutant dispersion in urban street canyons using hybrid rans-les method with two-phase model[J]. Computers and Fluids, DOI: 10.1016/j.compfluid.2020.104676.
DOI |
| [2] |
HUANG M H, HUANG Y, CAO J J, et al., 2021. Study on mitigation of automobile exhaust pollution in an urban street canyon: Emission reduction and air cleaning street lamps[J]. Building and Environment, DOI: 10.1016/j.buildenv.2021.107651.
DOI |
| [3] | MESZAROS D, MARKOS J, FITZGERALD D G, et al., 2015. An observational study of PM10 and hospital admissions for acute exacerbations of chronic respiratory disease in Tasmania, Australia 1992-2002 [J]. BMJ Open Respiratory Research, 2(1): 1-8. |
| [4] |
MIAO C P, YU S, HU Y M, et al., 2020. How the morphology of urban street canyons affects suspended particulate matter concentration at the pedestrian level: An in-situ investigation[J]. Sustainable Cities and Society, DOI: /10.1016/j.scs.2020.102042.
DOI |
| [5] | NICHOLSON S E, 1975. A pollution model for street-level air[J]. Atmospheric Environment, 9(1): 19-31. |
| [6] |
RUAN T C, RIM D Y, 2019. Indoor air pollution in office buildings in mega-cities: Effects of filtration efficiency and outdoor air ventilation rates[J]. Sustainable Cities and Society, DOI: 10.1016/j.scs.2019.101609.
DOI |
| [7] |
SHE Q N, CHOI M, BELLE J, et al., 2020. Satellite-based estimation of hourly PM2.5 levels during heavy winter pollution episodes in the Yangtze River Delta, China[J]. Chemosphere, DOI: 10.1016/j.chemosphere.2019.124678.
DOI |
| [8] | 安永碳中和课题组, 2021. 一本书读懂碳中和[M]. 北京: 机械工业出版社: 124-131. |
| Ernst & Young Carbon Neutrality Research Group, 2021. Understanding Carbon Neutrality in a Book[M]. Beijing: Machinery Industry Press: 124-131. | |
| [9] | 陈岚琪, 夏铧, 张习文, 等, 2020. 郑州市道路网络结构特征对大气颗粒物污染的影响及尺度效应[J]. 生态环境学报, 29(3): 562-568. |
| CHEN L Q, XIA H, ZHANG X W, et al., 2020. Scale-dependent effects of structural characteristics of road network on particulate matters pollution in Zhengzhou[J]. Journal of Ecological Environment, 29(3): 562-568. | |
| [10] | 邓寄豫, 郑炘, 2017. 街区层峡几何形态与微气候的关联性研究[J]. 建筑与文化, 14(5): 212-213. |
| DENG J Y, ZHENG X, 2017. Research on the correlation between the geometric forms of the strata and the microclimate in the block[J]. Architecture and Culture, 14(5): 212-213. | |
| [11] | 刁贝娣, 丁镭, 成金华, 2021. 不同类型城市的PM2.5健康风险及影响因素差异[J]. 中国人口·资源与环境, 31(8): 90-100. |
| DIAO B D, DING L, CHENG J H, 2021. PM2.5 health risks and influencing factors differences in different types of cities[J]. China Population·Resources and Environment, 31(8): 90-100. | |
| [12] | 高嵩, 田蓉, 郭彬, 等, 2018. 长三角典型城市PM2.5浓度变化特征及与气象要素的关系[J]. 科学技术与工程, 18(9): 142-155. |
| GAO S, TIAN R, GUO B, et al., 2018. The characteristics of PM2.5 concentration changes in typical cities in the Yangtze River Delta and its relationship with meteorological elements[J]. Science Technology and Engineering, 18(9): 142-155. | |
| [13] | 葛晓燕, 2018. 城市典型街谷道路中污染物扩散特征模拟[D]. 西安: 西安建筑科技大学: 29-56. |
| GE X Y, 2018. Simulation of the diffusion characteristics of pollutants in typical urban street-valley roads[D]. Xi'an: Xi'an University of Architecture and Technology:29-56. | |
| [14] | 合肥市生态环境局, 2021. 2020年合肥市环境状况公报[N/OL]. (2021-06-04) [2021-06-04]. http://sthjj.hefei.gov.cn/hbzx/gsgg/18085969.html. |
| Hefei Ecological Environment Bureau, 2021.2020 Hefei Environmental Status Bulletin[N/OL]. (2021-06-04) [2021-06-04]. http://sthjj.hefei.gov.cn/hbzx/gsgg/18085969.html. | |
| [15] | 黄润秋, 2021. 生态环境部部长黄润秋国新办新闻发布会答记者问[N/OL].(2021-08-18) [2021-08-18]. http://www.mee.gov.cn/ywdt/zbft/202108/t20210818_858184.shtml. |
| HUANG R Q, 2021. Minister of the Ministry of Ecology and Environment Huang Runqiu answered reporters' questions at the press conference of the new office[N/OL].(2021-08-18) [2021-08-18]. http://www.mee.gov.cn/ywdt/zbft/202108/t20210818_858184.shtml. | |
| [16] | 李克强, 2021. 2021年政府工作报告[N/OL].(2021-03-05) [2021-03-05]. http://www.gov.cn/zhuanti/2021lhzfgzbg/index.htm. |
| LI K Q, 2021. 2021 Government Work Report[N/OL].(2021-03-05) [2021-03-05]. http://www.gov.cn/zhuanti/2021lhzfgzbg/index.htm. | |
| [17] | 李绥, 杨二东, 石铁矛, 等, 2014. 商业街区可吸入颗粒物空间分布及其气象要素的相关性[J]. 沈阳建筑大学学报 (自然科学版), 30(5): 923-930. |
| LI S, YANG E D, SHI T M, et al., 2014. The spatial distribution of inhalable particulate matter in commercial blocks and the correlation between meteorological factors[J]. Journal of Shenyang Jianzhu University (Natural Science Edition), 30(5): 923-930. | |
| [18] | 刘超, 金梦怡, 朱星航, 等, 2021. 多尺度时空PM2.5分布特征、影响要素、方法演进的综述及城市规划展望[J]. 西部人居环境学刊, 36(4): 9-18. |
| LIU C, JIN M Y, ZHU X H, et al., 2021. A review of multi-scale spatiotemporal PM2.5 distribution characteristics, influencing factors, method evolution and urban planning prospects[J]. Western Human Settlements and Environment Journal, 36(4): 9-18. | |
| [19] | 刘晴, 高鹏, 李成, 等, 2019. 泰安市典型生态功能区空气负离子的时空分布及影响因素分析[J]. 环境化学, 38(1): 169-176. |
| LIU Q, GAO P, LI C, et al., 2019. Spatial-temporal distribution and influencing factors of negative air ions in typical ecological function areas in Tai'an City[J]. Environmental Chemistry, 38(1): 169-176. | |
| [20] | 生态环境部, 2018. 关于发布《环境空气质量标准》(GB 3095-2012)修改单的公告[N/OL].(2021-06-04) [2021-06-04]. http://www.mee.gov.cn/gkml/sthjbgw/sthjbgg/201808/t20180815_451398.htm. |
| Ministry of Ecology and Environment, 2018. Announcement on the issuance of amendments to “Ambient Air Quality Standards” (GB 3095-2012)[N/OL].(2021-06-04) [2021-06-04]. http://www.mee.gov.cn/gkml/sthjbgw/sthjbgg/201808/t20180815_451398.htm. | |
| [21] | 孙金龙, 黄润秋, 2021. 坚持以习近平生态文明思想为指引深入打好污染防治攻坚战[J]. 环境保护, 49(23): 8-9. |
| SUN J L, HUANG R Q, 2021. Adhere to Xi Jinping's ecological civilization thought as the guide to fight the tough battle of pollution prevention and control[J]. Environmental Protection, 49(23): 8-9. | |
| [22] | 王宝民, 柯咏东, 桑建国, 2005. 城市街谷大气环境研究进展[J]. 北京大学学报(自然科学版), 41(1): 146-153. |
| WANG B M, KE Y D, SANG J G, 2005. Research progress of atmospheric environment in urban street canyons[J]. Journal of Peking University (Natural Science Edition), 41(1): 146-153. | |
| [23] | 王佳佳, 夏晓圣, 程先富, 等, 2020. 合肥市PM2.5浓度时空分布特征及影响因素分析[J]. 长江流域资源与环境, 29(6): 1413-1421. |
| WANG J J, XIA X S, CHENG X F, et al., 2020. Analysis of the temporal and spatial distribution characteristics and influencing factors of PM2.5 concentration in Hefei City[J]. Resources and Environment in the Yangtze Basin, 29(6): 1413-1421. | |
| [24] | 王薇, 程歆玥, 2021a. 室内垂直绿墙对环境因子时空分布特征影响[J]. 中国城市林业, 19(5): 53-59, 82. |
| WANG W, CHENG X Y, 2021. Influence of indoor vertical green walls on spatial and temporal distribution characteristics of environmental factors[J]. China Urban Forestry, 19(5): 53-59, 82. | |
| [25] | 王薇, 程歆玥, 胡春, 等, 2021b. 城市街道峡谷PM2.5时空分布特征与空气质量评价--以合肥市长淮街道为例[J]. 生态环境学报, 30(11): 2157-2164. |
| WANG W, CHENG X Y, HU C, et al., 2021. Spatio-temporal distribution characteristics of PM2.5 and air quality evaluation in urban street canyons: Take Changhuai street in Hefei as an example[J]. Journal of Ecological Environment, 30(11): 2157-2164. | |
| [26] | 王薇, 夏斯涵, 张蕾, 2021c. 基于ENVI-met的高密度城市住区空间PM2.5分布模拟研究[J]. 住宅科技, 41(11): 29-34. |
| WANG W, XIA S H, ZHANG L, 2021. Simulation of PM2.5 distribution in high-density urban residential areas based on ENVI-met[J]. Housing Science and Technology, 41(11): 29-34. | |
| [27] | 王薇, 张蕾, 2021d. 基于CiteSpace的城市环境中细颗粒物研究进展的可视化分析[J]. 生态环境学报, 30(6): 1321-1332. |
| WANG W, ZHANG L, 2021. Visual analysis of research progress of fine particles in urban environment based on CiteSpace[J]. Journal of Ecological Environment, 30(6): 1321-1332. | |
| [28] | 吴凌云, 谢军飞, 张欣, 2021. 冬季采暖优化对北京地区空气质量的影响[J]. 气候与环境研究, 26(4): 391-402. |
| WU L Y, XIE J F, ZHANG X, 2021. The influence of winter heating optimization on air quality in Beijing[J]. Climatic and Environmental Research, 26(4): 391-402. | |
| [29] | 夏斯涵, 2021. 基于细颗粒物模拟的高层高密度城市住区空间形态研究[D]. 合肥: 安徽建筑大学. |
| XIA S H, 2021. Research on the spatial morphology of high-rise and high-density urban settlements based on simulation of fine particles[D]. Hefei: Anhui University of Architecture and Architecture. | |
| [30] | 闫秀婧, 2009. 青岛市森林与湿地负离子水平时空分布研究[D]. 北京: 北京林业大学: 13-14. |
| YAN X J, 2009. Research on the temporal and spatial distribution of negative ion levels in forests and wetlands in Qingdao[D]. Beijing: Beijing Forestry University: 13-14. | |
| [31] | 于洋, 刘晓宇, 田达睿, 等, 2020. 街道峡谷几何形态规划要素对太阳能潜力的影响研究[J]. 工业建筑, 50(7): 137-142. |
| YU Y, LIU X Y, TIAN D R, et al., 2020. Research on the influence of street canyon geometry planning elements on solar energy potential[J]. Industrial Architecture, 50(7): 137-142. | |
| [32] | 张丹龙, 方凤满, 姚有如, 等, 2016. 淮南市不同功能区叶面尘和地表灰尘中重金属分布特征、来源及健康风险评价[J]. 环境科学学报, 36(9): 3322-3332. |
| ZHANG D L, FANG F M, YAO Y R, et al., 2016. Distribution characteristics, sources and health risk assessment of heavy metals in leaf dust and surface dust in different functional areas of Huainan City[J]. Acta Scientiae Circumstantiae, 36(9): 3322-3332. | |
| [33] | 周洪昌, 杨佩昆, 高延令, 1994. 城市街道汽车排放物扩散过程的风洞试验[J]. 同济大学学报 (自然科学版), 39(3): 306-311. |
| ZHOU H C, YANG P K, GAO Y L, 1994. Wind tunnel test on the diffusion process of vehicle emissions from urban streets[J]. Journal of Tongji University (Natural Science Edition), 39(3): 306-311. |
| [1] | 董洁芳, 邓椿, 张仲伍. 渭河流域PM2.5时空演化及人口暴露风险[J]. 生态环境学报, 2023, 32(6): 1078-1088. |
| [2] | 李建辉, 党争, 陈琳. 黄河几字弯都市圈PM2.5时空特征及影响因素分析[J]. 生态环境学报, 2023, 32(4): 697-705. |
| [3] | 张莉, 李铖, 谭皓泽, 韦家怡, 程炯, 彭桂香. 广州典型城市林地对大气颗粒物的削减效应及影响因素[J]. 生态环境学报, 2023, 32(2): 341-350. |
| [4] | 陈小南, 李琼雯, 余建平, 余顺海, 李双, 曹铭昌. 钱江源国家公园白颈长尾雉生境适宜性评价研究[J]. 生态环境学报, 2022, 31(9): 1832-1839. |
| [5] | 江明, 张子洋, 李婷婷, 林勃机, 张正恩, 廖彤, 袁鸾, 潘苏红, 李军, 张干. 基于氮同位素的珠三角典型地区大气PM2.5中NH4+来源解析[J]. 生态环境学报, 2022, 31(9): 1840-1848. |
| [6] | 魏小锋, 韩红, 闫学军, 王在峰, 李圣增, 田勇, 梁第, 马明亮, 张桂芹. 基于卫星遥感与CMB模型的济南市冬季重污染过程PM2.5溯源分析[J]. 生态环境学报, 2022, 31(6): 1175-1183. |
| [7] | 赵锐, 詹梨苹, 周亮, 张军科. 地理探测联合地理加权岭回归的PM2.5驱动因素分析[J]. 生态环境学报, 2022, 31(2): 307-317. |
| [8] | 蒋斌, 陈多宏, 张涛, 袁鸾, 周炎, 沈劲, 张春林, 王伯光. 华南水稻秸秆焚烧期碳质气溶胶组分特征及源贡献评估[J]. 生态环境学报, 2022, 31(12): 2358-2366. |
| [9] | 邢冉, 沈国锋, 程和发, 陶澍. 东北地区农村生活能源结构变迁及其对区域污染物排放的影响[J]. 生态环境学报, 2022, 31(12): 2367-2373. |
| [10] | 李圣增, 郝赛梅, 谭路遥, 张怀成, 徐标, 谷树茂, 潘光, 王淑妍, 闫怀忠, 张桂芹. 济南市PM2.5中二次组分的时空变化特征及其影响因素[J]. 生态环境学报, 2022, 31(1): 100-109. |
| [11] | 王薇, 程歆玥, 胡春, 夏斯涵, 王甜. 城市街道峡谷PM2.5时空分布特征与空气质量评价——以合肥市长淮街道为例[J]. 生态环境学报, 2021, 30(11): 2157-2164. |
| 阅读次数 | ||||||
|
全文 |
|
|||||
|
摘要 |
|
|||||