生态环境学报 ›› 2021, Vol. 30 ›› Issue (7): 1492-1502.DOI: 10.16258/j.cnki.1674-5906.2021.07.018
梁永春1( ), 尹芳2,*(), 赵英芬3, 刘磊1
收稿日期:2021-02-25
出版日期:2021-07-18
发布日期:2021-10-09
通讯作者:
*尹芳,女,副教授,博士,主要从事遥感与GIS应用研究。E-mail: yinf@chd.edu.cn作者简介:梁永春(1994年生),女,博士研究生,主要从事资源环境遥感应用研究。E-mail: 1359205300@qq.com
基金资助:
LIANG Yongchun1(), YIN Fang2,*(), ZHAO Yingfen3, LIU Lei1
Received:2021-02-25
Online:2021-07-18
Published:2021-10-09
摘要:
生化需氧量(BOD)是监测水体有机污染的重要水质参数,运用遥感技术进行水体BOD监测具有快速、便捷的优势。利用2016年7月27日和2016年8月28日Landsat 8/OLI影像数据与2016年8月1—4日和2016年9月1—8日40个样点实测BOD浓度数据,对BOD浓度与Landsat 8像元光谱反射率进行相关分析并选取敏感波段,运用建模集数据构建偏最小二乘回归模型(模型决定系数为0.61,预测均方根误差为0.69 mg∙L-1,预测偏差比为1.61)进行数据验证,实测值和预测值的相关系数达到0.85,预测均方根误差为0.74 mg∙L-1,预测模型效果较好,说明应用Landsat 8/OLI数据进行太湖BOD浓度监测具有可行性。将得到的偏最小二乘回归模型运用至2016年7月27日和2016年8月28日Landsat 8影像得到BOD遥感反演图,遥感反演图中BOD空间分布特征与2016年8月1—4日和2016年9月1—8日样点BOD空间插值结果吻合较好。遥感反演图能更清楚地表征太湖BOD的分布情况,BOD浓度从太湖南部向北部逐渐增加,中南部区域BOD浓度低,西北部、边缘地区以及东南部区域BOD浓度较高。运用太湖其他时段Landsat 8影像与实测BOD浓度构建偏最小二乘回归模型,2016年4月和2017年3月建模效果均比较好,说明偏最小二乘回归方法具有较强的适用性。分析多时段反演结果,2016年中期太湖有机污染状况较初期严重,说明水体有机物质受季节和温度等因素的影响。综上,偏最小二乘回归模型能够较准确估算水体BOD浓度及其空间分布,可为太湖有机污染的评价和治理提供依据。
中图分类号:
梁永春, 尹芳, 赵英芬, 刘磊. 基于Landsat 8影像的太湖生化需氧量遥感反演[J]. 生态环境学报, 2021, 30(7): 1492-1502.
LIANG Yongchun, YIN Fang, ZHAO Yingfen, LIU Lei. Remote Sensing Inversion of Biochemical Oxygen Demand in Taihu Lake Based on Landsat 8 Images[J]. Ecology and Environment, 2021, 30(7): 1492-1502.
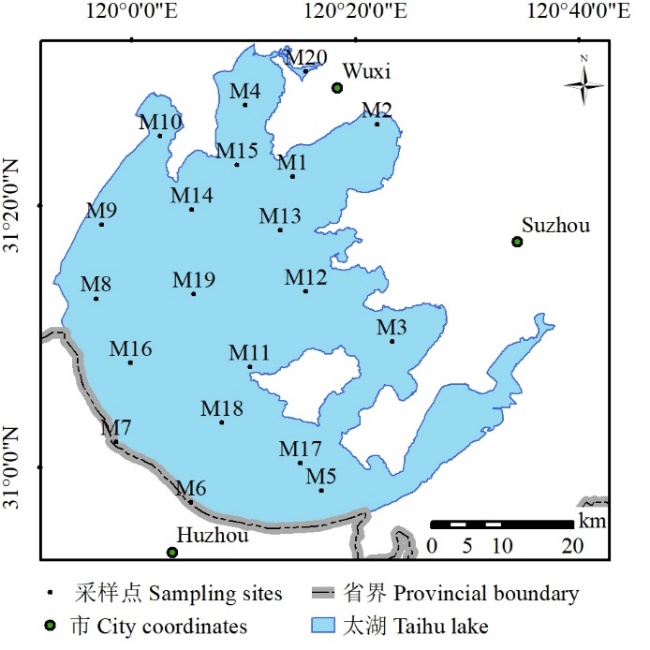
图1 太湖采样点位置
Fig. 1 Sampling points distribution of Taihu Lake
| 编号 Serial numbers | 采样点 Sampling points |
|---|---|
| M1 | 沙渚南 South Shazhu |
| M2 | 锡东 Xidong |
| M3 | 胥湖心 Centre Xuhu Lake |
| M4 | 梅梁湖心 Centre Meiliang Lake |
| M5 | 漾西港 Yangxi Port |
| M6 | 小梅口 Xiaomei Mouth |
| M7 | 新塘港 Xintang Port |
| M8 | 兰山嘴 Lanshan Mouth |
| M9 | 大浦口 Dapu Mouth |
| M10 | 竺山湖心 Centre Zhushan Lake |
| M11 | 西山西 West Xishan Mountain |
| M12 | 漫山 Manshan Mountain |
| M13 | 乌龟山南 South Turtle Mountain |
| M14 | 椒山 JiaoShan Mountain |
| M15 | 拖山 Tuoshan Mountain |
| M16 | 大雷山 Daleishan Mountain |
| M17 | 泽山 Zeshan Mountain |
| M18 | 十四号灯标 Fourteen Beacon |
| M19 | 平台山 Pingtaishan Mountain |
| M20 | 五里湖心 Centre Wuli Lake |
表1 太湖采样点与编号对应表
Table 1 Table of sampling points and serial numbers in Taihu lake
| 编号 Serial numbers | 采样点 Sampling points |
|---|---|
| M1 | 沙渚南 South Shazhu |
| M2 | 锡东 Xidong |
| M3 | 胥湖心 Centre Xuhu Lake |
| M4 | 梅梁湖心 Centre Meiliang Lake |
| M5 | 漾西港 Yangxi Port |
| M6 | 小梅口 Xiaomei Mouth |
| M7 | 新塘港 Xintang Port |
| M8 | 兰山嘴 Lanshan Mouth |
| M9 | 大浦口 Dapu Mouth |
| M10 | 竺山湖心 Centre Zhushan Lake |
| M11 | 西山西 West Xishan Mountain |
| M12 | 漫山 Manshan Mountain |
| M13 | 乌龟山南 South Turtle Mountain |
| M14 | 椒山 JiaoShan Mountain |
| M15 | 拖山 Tuoshan Mountain |
| M16 | 大雷山 Daleishan Mountain |
| M17 | 泽山 Zeshan Mountain |
| M18 | 十四号灯标 Fourteen Beacon |
| M19 | 平台山 Pingtaishan Mountain |
| M20 | 五里湖心 Centre Wuli Lake |
| 水质参数 Water quality parameter | 分类 Classification | Class Ⅰ | Class Ⅱ | Class Ⅲ | Class Ⅳ | Class Ⅴ | Class Worst Ⅴ |
|---|---|---|---|---|---|---|---|
| 生化需氧量 Biochemical oxygen demand/(mg∙L-1) | ≤ | 3 | 3 | 4 | 6 | 10 | >10 |
表2 生化需氧量地表水环境质量标准1)
Table 2 Environmental quality standards for surface water
| 水质参数 Water quality parameter | 分类 Classification | Class Ⅰ | Class Ⅱ | Class Ⅲ | Class Ⅳ | Class Ⅴ | Class Worst Ⅴ |
|---|---|---|---|---|---|---|---|
| 生化需氧量 Biochemical oxygen demand/(mg∙L-1) | ≤ | 3 | 3 | 4 | 6 | 10 | >10 |
| 传感器类型 Sensor type | 中心坐标 Scene center location | 传感器高度 Sensor altitude/km | 地面海拔 Ground elevation/km | 像元大小 Pixel size/m | 大气模型 Atmospheric model |
|---|---|---|---|---|---|
| OLI | 120.40°N/31.74°E | 705 | 0.016 | 30 | Tropical |
| 飞行时间 Flight time GMT/ (hh: mm: ss) | 飞行日期 Flight data | 水汽反演 Water retrieval | 气溶胶模型 Aerosol model | 气溶胶反演 Aerosol retrieval | 初始可见度 Initial visibility/ km |
| 02:31:21 | 2016-8-28 | NO | Rural | 2-Band-(K-T) | 40 |
| 气溶胶标高 Aerosol scale height/ km | CO2比例 CO2 mixing ratio/ 10-6 | 平均分割函数 Use square slit function | 领域校正 Use adjacency correction | MODRTAN分辨率MODTRAN resolution/ cm-1 | MODTRAN多散射模型MODTRAN multiscatter model |
| 1.5 | 390 | NO | Yes | 15 | Scaled DISORT |
表3 FLAASH大气校正模型参数(以2016年8月28日影像数据为例)
Table 3 FLAASH atmospheric correction model parameters (the image in August 28, 2016 as an example)
| 传感器类型 Sensor type | 中心坐标 Scene center location | 传感器高度 Sensor altitude/km | 地面海拔 Ground elevation/km | 像元大小 Pixel size/m | 大气模型 Atmospheric model |
|---|---|---|---|---|---|
| OLI | 120.40°N/31.74°E | 705 | 0.016 | 30 | Tropical |
| 飞行时间 Flight time GMT/ (hh: mm: ss) | 飞行日期 Flight data | 水汽反演 Water retrieval | 气溶胶模型 Aerosol model | 气溶胶反演 Aerosol retrieval | 初始可见度 Initial visibility/ km |
| 02:31:21 | 2016-8-28 | NO | Rural | 2-Band-(K-T) | 40 |
| 气溶胶标高 Aerosol scale height/ km | CO2比例 CO2 mixing ratio/ 10-6 | 平均分割函数 Use square slit function | 领域校正 Use adjacency correction | MODRTAN分辨率MODTRAN resolution/ cm-1 | MODTRAN多散射模型MODTRAN multiscatter model |
| 1.5 | 390 | NO | Yes | 15 | Scaled DISORT |
| July 27, 2016 | August 28, 2016 | ||
|---|---|---|---|
| 波段Band | 相关系数 Correlation coefficient (r) | 波段Band | 相关系数 Correlation coefficient (r) |
| B1 | 0.128 | B1 | 0.643** |
| B2 | 0.032 | B2 | 0.639** |
| B3 | 0.083 | B3 | 0.686** |
| B4 | 0.387 | B4 | 0.733** |
| B5 | 0.652** | B5 | 0.506* |
| B6 | 0.316 | B6 | 0.339 |
| B7 | 0.204 | B7 | 0.342 |
表4 Landsat 8单波段光谱反射率与BOD浓度相关性分析
Table 4 Correlation of single spectral reflectance and BOD concentration
| July 27, 2016 | August 28, 2016 | ||
|---|---|---|---|
| 波段Band | 相关系数 Correlation coefficient (r) | 波段Band | 相关系数 Correlation coefficient (r) |
| B1 | 0.128 | B1 | 0.643** |
| B2 | 0.032 | B2 | 0.639** |
| B3 | 0.083 | B3 | 0.686** |
| B4 | 0.387 | B4 | 0.733** |
| B5 | 0.652** | B5 | 0.506* |
| B6 | 0.316 | B6 | 0.339 |
| B7 | 0.204 | B7 | 0.342 |
| 时间 Time | 波段组合 Band combination | 相关系数Correlation coefficient (r) | 波段组合 Band combination | 相关系数Correlation coefficient (r) | 波段组合 Band combination | 相关系数Correlation coefficient (r) | 波段组合 Band combination | 相关系数Correlation coefficient (r) |
|---|---|---|---|---|---|---|---|---|
| July 27, 2016 | B3/B4 | -0.692** | B4/B5 | -0.583** | B5+B7 | 0.591** | B4/B3 | 0.689** |
| B3-B5 | -0.644** | B3-B4 | -0.578** | B5+B6 | 0.596** | B5/B3 | 0.707** | |
| B3/B5 | -0.634** | B2/B4 | -0.553** | B6-B7 | 0.609** | (B4+B5)/(B4-B5) | 0.531** | |
| B2-B5 | -0.622** | B1+B5 | 0.504** | B5-B7 | 0.621** | (B2+B5)/(B2-B5) | 0.629** | |
| B2/B5 | -0.614** | B4/B2 | 0.537** | B5/B4 | 0.627** | (B3+B4)/(B3-B4) | 0.638** | |
| B1/B5 | -0.601** | B5-B6 | 0.582** | B5/B1 | 0.663** | (B1+B5)/(B1-B5) | 0.642** | |
| B1-B5 | -0.591** | B4+B5 | 0.588** | B5/B2 | 0.673** | (B3+B5)/(B3-B5) | 0.683** | |
| August 28, 2016 | B4+B7 | -0.760** | B3+B5 | -0.697** | B1+B2 | -0.643** | B1/B4 | 0.534* |
| B4+B6 | -0.750** | B3+B7 | -0.693** | B2+B7 | -0.638** | B1-B4 | 0.546* | |
| B4/B3 | -0.746** | B1+B3 | -0.679** | B1+B7 | -0.635** | B2/B4 | 0.587** | |
| B4+B5 | -0.742** | B3+B6 | -0.676** | B2+B6 | -0.619** | B2-B4 | 0.640** | |
| B1+B4 | -0.721** | B2+B3 | -0.671** | B1+B6 | -0.617** | B3-B4 | 0.734** | |
| B3+B4 | -0.717** | B1+B5 | -0.665** | B4/B2 | -0.583** | B3/B4 | 0.742** | |
| B2+B4 | -0.712** | B2+B5 | -0.664** | B4/B1 | -0.537* | (B3+B4)/(B3-B4) | -0.527* |
表5 Landsat 8 波段组合光谱反射率与BOD浓度相关性分析
Table 5 Correlation of band combination spectral reflectance and BOD concentration
| 时间 Time | 波段组合 Band combination | 相关系数Correlation coefficient (r) | 波段组合 Band combination | 相关系数Correlation coefficient (r) | 波段组合 Band combination | 相关系数Correlation coefficient (r) | 波段组合 Band combination | 相关系数Correlation coefficient (r) |
|---|---|---|---|---|---|---|---|---|
| July 27, 2016 | B3/B4 | -0.692** | B4/B5 | -0.583** | B5+B7 | 0.591** | B4/B3 | 0.689** |
| B3-B5 | -0.644** | B3-B4 | -0.578** | B5+B6 | 0.596** | B5/B3 | 0.707** | |
| B3/B5 | -0.634** | B2/B4 | -0.553** | B6-B7 | 0.609** | (B4+B5)/(B4-B5) | 0.531** | |
| B2-B5 | -0.622** | B1+B5 | 0.504** | B5-B7 | 0.621** | (B2+B5)/(B2-B5) | 0.629** | |
| B2/B5 | -0.614** | B4/B2 | 0.537** | B5/B4 | 0.627** | (B3+B4)/(B3-B4) | 0.638** | |
| B1/B5 | -0.601** | B5-B6 | 0.582** | B5/B1 | 0.663** | (B1+B5)/(B1-B5) | 0.642** | |
| B1-B5 | -0.591** | B4+B5 | 0.588** | B5/B2 | 0.673** | (B3+B5)/(B3-B5) | 0.683** | |
| August 28, 2016 | B4+B7 | -0.760** | B3+B5 | -0.697** | B1+B2 | -0.643** | B1/B4 | 0.534* |
| B4+B6 | -0.750** | B3+B7 | -0.693** | B2+B7 | -0.638** | B1-B4 | 0.546* | |
| B4/B3 | -0.746** | B1+B3 | -0.679** | B1+B7 | -0.635** | B2/B4 | 0.587** | |
| B4+B5 | -0.742** | B3+B6 | -0.676** | B2+B6 | -0.619** | B2-B4 | 0.640** | |
| B1+B4 | -0.721** | B2+B3 | -0.671** | B1+B6 | -0.617** | B3-B4 | 0.734** | |
| B3+B4 | -0.717** | B1+B5 | -0.665** | B4/B2 | -0.583** | B3/B4 | 0.742** | |
| B2+B4 | -0.712** | B2+B5 | -0.664** | B4/B1 | -0.537* | (B3+B4)/(B3-B4) | -0.527* |
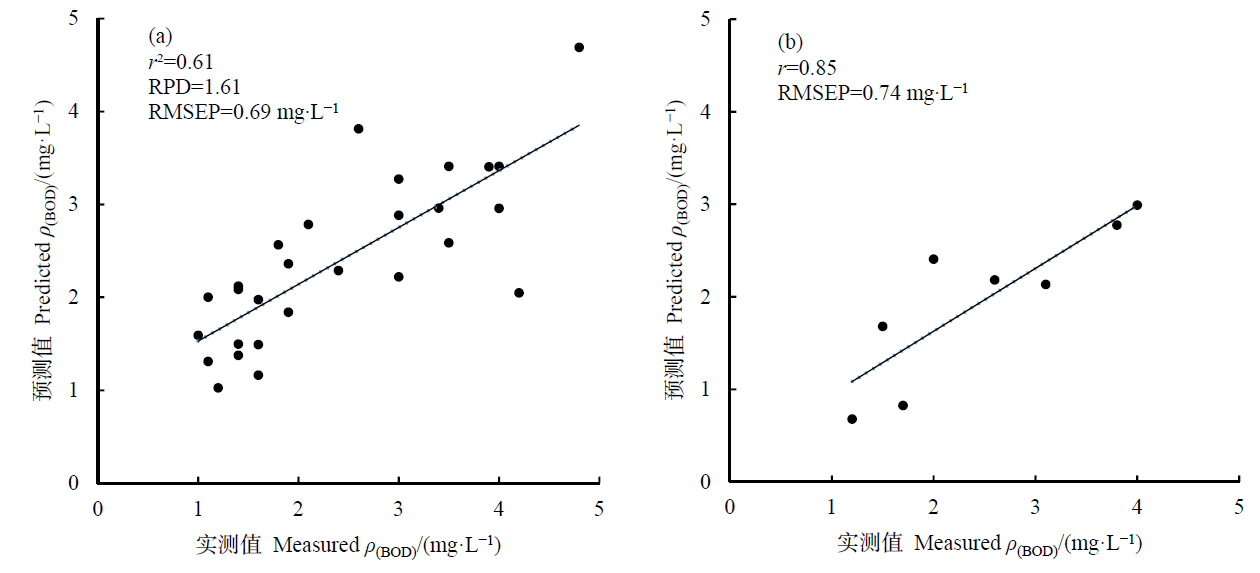
图2 BOD实测值和遥感反演值相关关系 (a)建模集;(b)验证集
Fig. 2 Correlativity of predicted value and the measured values of BOD concentration (a) Modeling datasets; (b) Verifying datasets
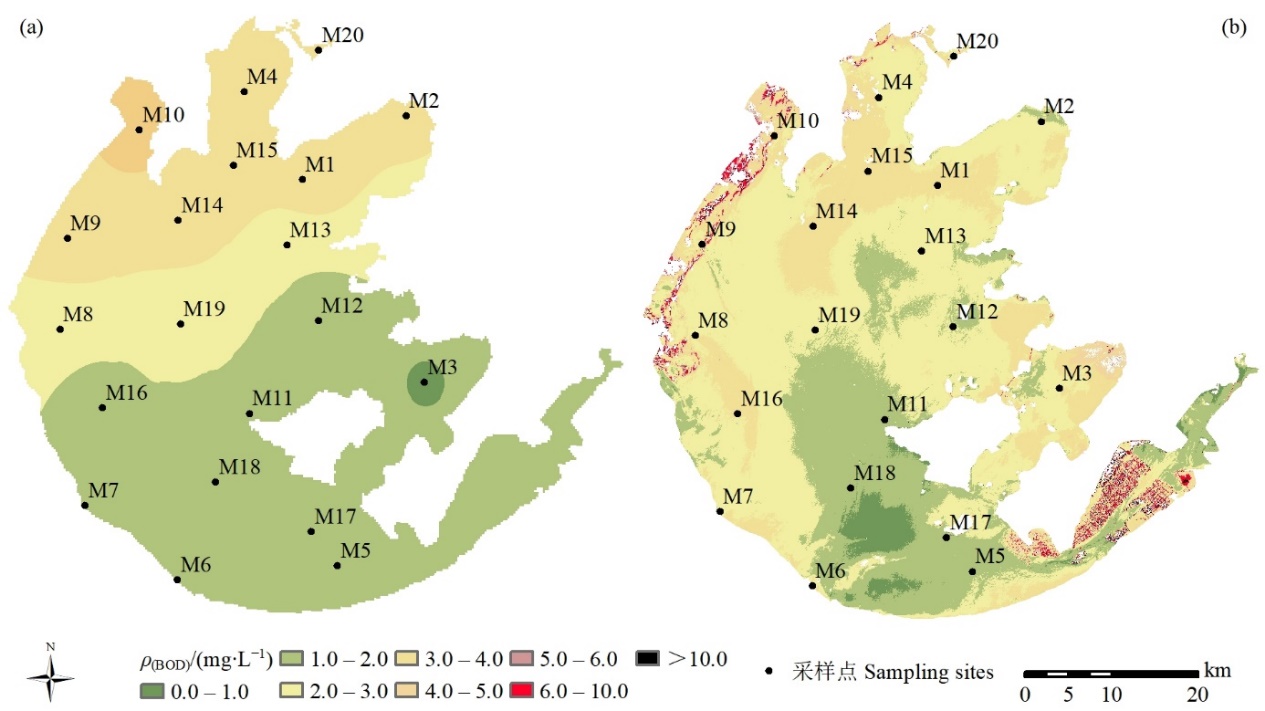
图3 2016年8月太湖BOD实测值插值图(a)、2016年7月太湖BOD影像反演图(b)
Fig. 3 Interpolation of measured BOD concentration of Taihu Lake in August 2016 (a) and inversion of BOD concentration of Taihu Lake in July 2016 (b)
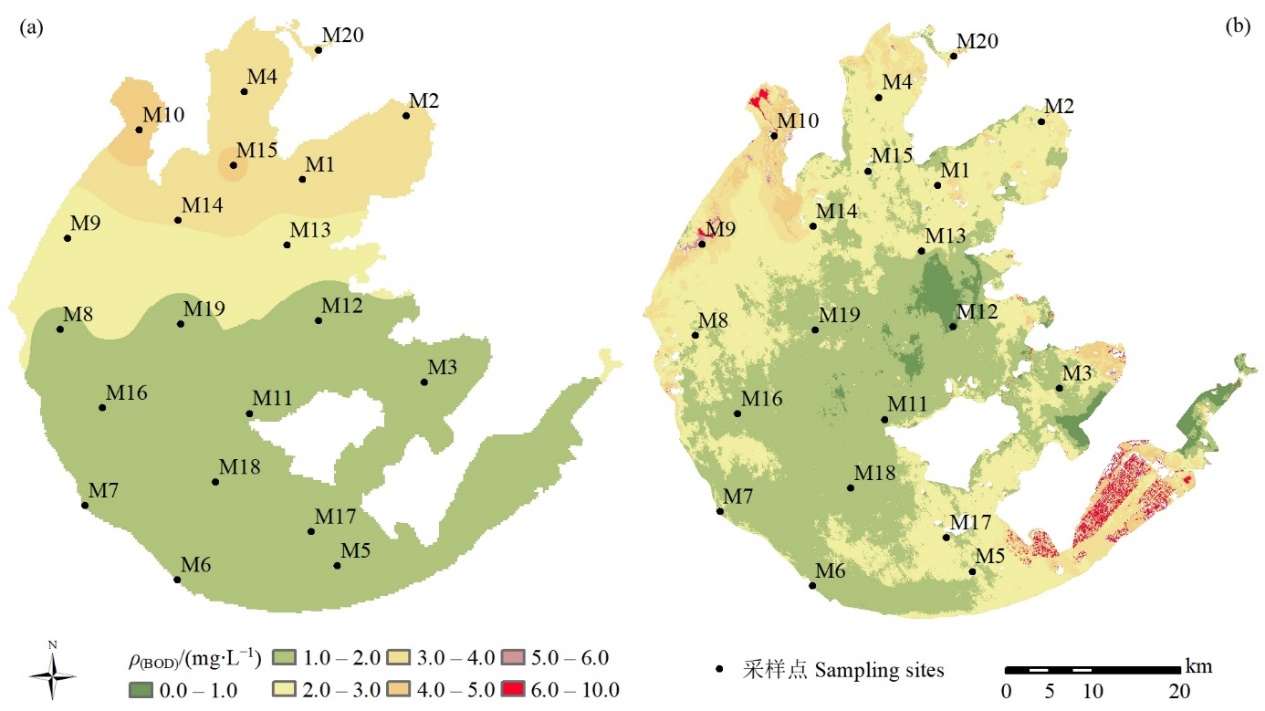
图4 2016年9月太湖BOD实测值插值图(a)、2016年8月太湖BOD影像反演图(b)
Fig. 4 Interpolation of measured BOD concentration of Taihu Lake in September 2016 (a) and inversion of BOD concentration of Taihu Lake in August 2016 (b)
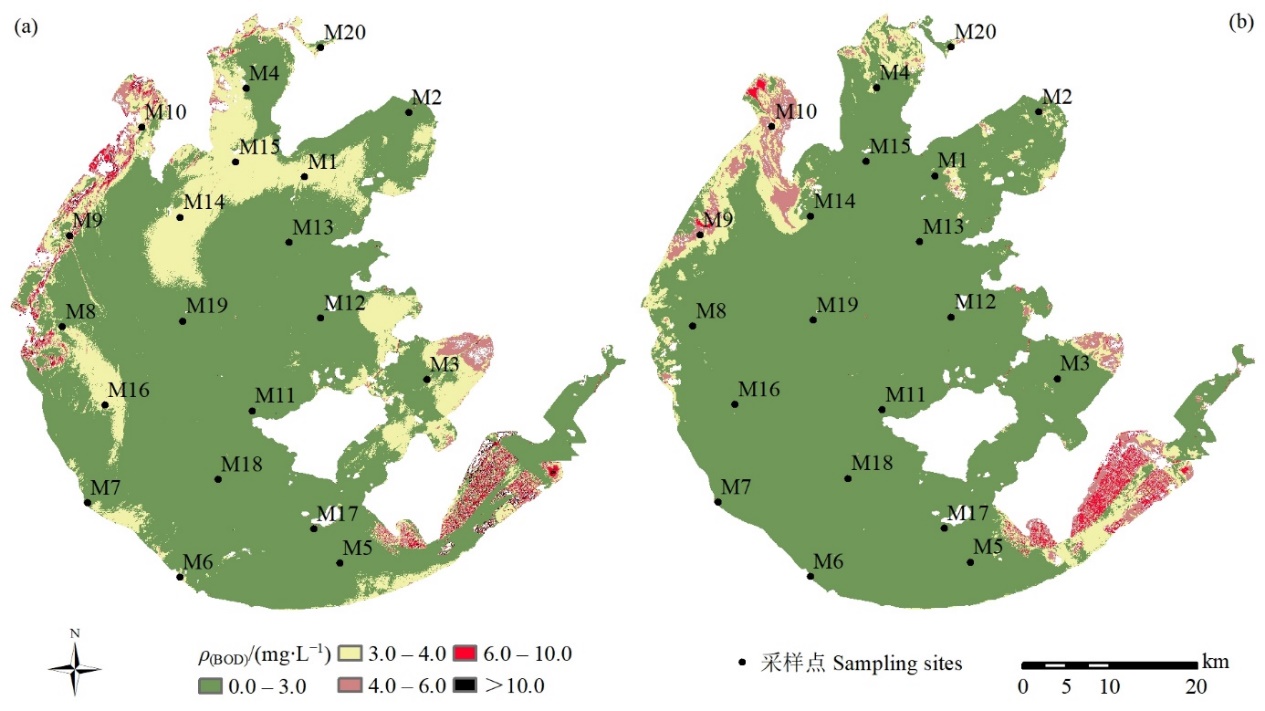
图5 基于Landsat8影像太湖水质分级图(2016年7月27日 (a) 和2016年8月28日 (b))
Fig. 5 Map of water quality classification of Taihu Lake based on Landsat 8 remote sensing images in July, 27, 2016 (a) and August, 28, 2016 (b)
| 时间 Time | 模型 Model | 决定系数 R2 | 预测偏差比RPD | 预测均方根误差RMSEP |
|---|---|---|---|---|
| April, 2016 | Y=5.2473-0.0007B1-0.0008B2-0.0008B3-0.0007B4+0.0007B5+0.0011B6+0.0012B7 | 0.60 | 1.45 | 0.62 |
| March, 2017 | Y=10.6089-0.0012B1-0.0013B2-0.0013B3-0.0008B4-0.0005B5+0.003B6-0.0032B7 | 0.69 | 1.70 | 0.71 |
表6 多个时间生化需氧量预测模型
Table 6 Multi-time prediction model of biochemical oxygen demand
| 时间 Time | 模型 Model | 决定系数 R2 | 预测偏差比RPD | 预测均方根误差RMSEP |
|---|---|---|---|---|
| April, 2016 | Y=5.2473-0.0007B1-0.0008B2-0.0008B3-0.0007B4+0.0007B5+0.0011B6+0.0012B7 | 0.60 | 1.45 | 0.62 |
| March, 2017 | Y=10.6089-0.0012B1-0.0013B2-0.0013B3-0.0008B4-0.0005B5+0.003B6-0.0032B7 | 0.69 | 1.70 | 0.71 |
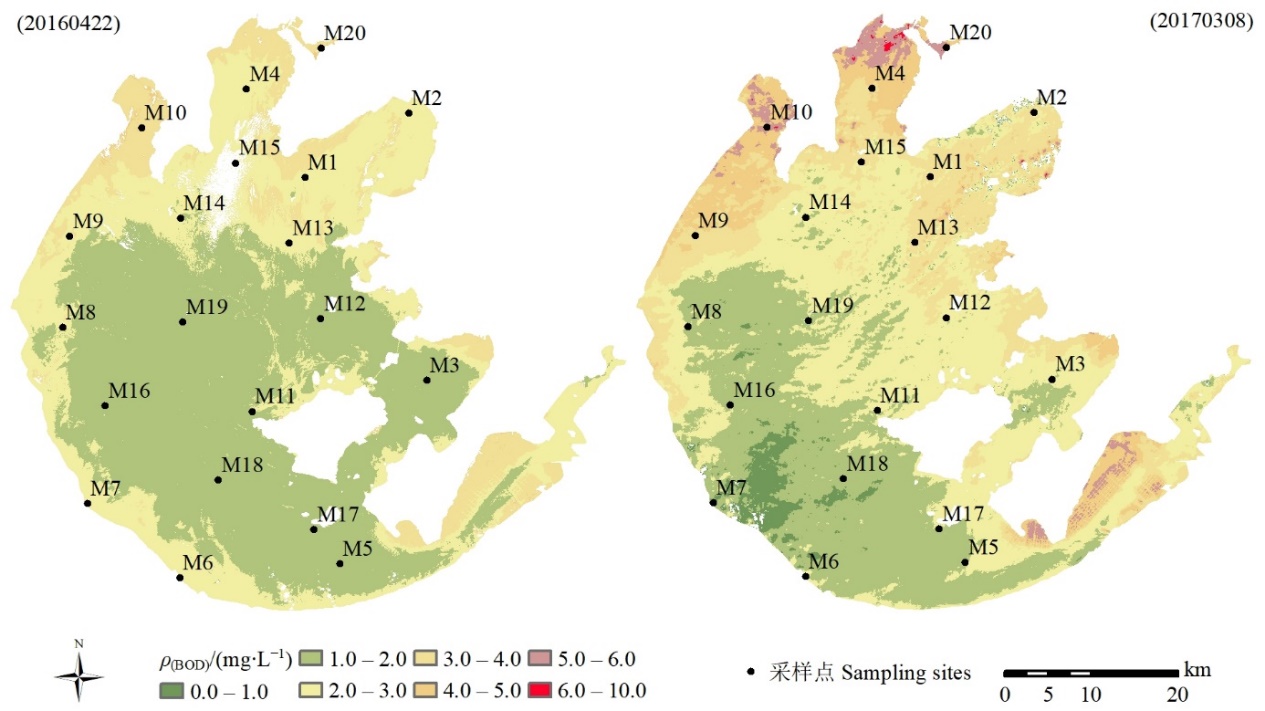
图6 基于多时间Landsat 8 影像BOD遥感反演图
Fig. 6 Inversion of the BOD concentration based on the multi-time Landsat 8 remote sensing images
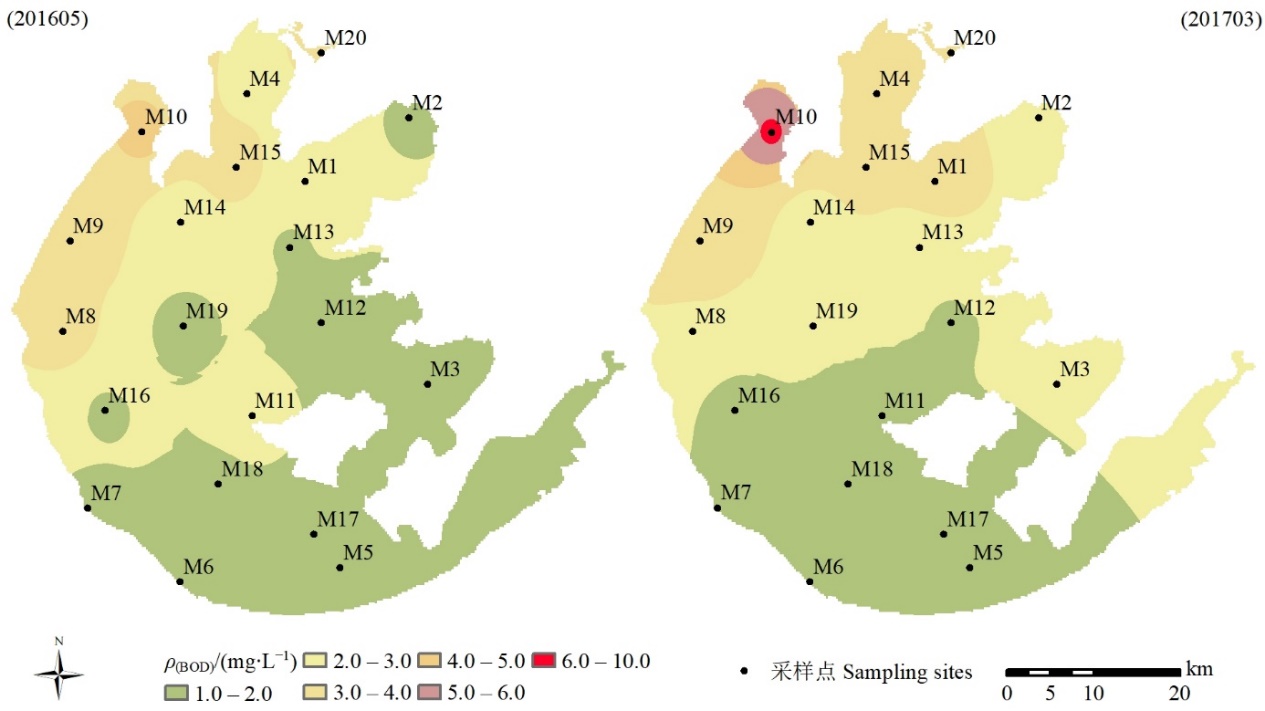
图7 基于多时间实测BOD浓度插值图
Fig. 7 Interpolation based on the multi-time measured BOD concentration
| [1] |
GOLABI M R, FARZI S, KHODABAKHSHI F, et al., 2020. Biochemical oxygen demand prediction: development of hybrid wavelet-random forest and M5 model tree approach using feature selection algorithms[J]. Environmental Science and Pollution Research, 27: 34322-34336.
DOI URL |
| [2] |
HUR J, CHO J W, 2012. Prediction of BOD, COD, and Total Nitrogen Concentrations in a Typical Urban River Using a Fluorescence Excitation-Emission Matrix with PARAFAC and UV Absorption Indices[J]. Sensors, 12(1): 972-986.
DOI URL |
| [3] |
LIU C Y, LI Z H, JIANG D M, et al., 2016. Demonstration study of biofilm reactor based rapid biochemical oxygen demand determination of surface water[J]. Sensing and Bio-Sensing Research, 8: 8-13.
DOI URL |
| [4] |
NAJAFZADEH M, GHAEMI A, 2019. Prediction of the five-day biochemical oxygen demand and chemical oxygen demand in natural streams using machine learning methods[J]. Environmental Monitoring and Assessment, 191: 380.
DOI URL |
| [5] |
SHARAF EL DIN E, ZHANG Y, 2017. Estimation of both optical and nonoptical surface water quality parameters using Landsat 8OLI imagery and statistical techniques[J]. Journal of Applied Remote Sensing, DOI: 10.1117/1.JRS.11.046008.
DOI |
| [6] |
TAO H, BOBAKER A M, RAMAL M M, et al., 2019. Determination of biochemical oxygen demand and dissolved oxygen for semi-arid river environment: Application of soft computing models[J]. Environmental Science and Pollution Research, 26(1): 923-937.
DOI URL |
| [7] |
XU J, JIN G Q, MO Y M, et al., 2020. Assessing anthropogenic impacts on chemical and biochemical oxygen demand in different spatial scales with Bayesian Networks[J]. Water, 12(1): 246.
DOI URL |
| [8] |
ZHANG H J, HU W P, GU K, et al., 2013. An improved ecological model and software for short-term algal bloom forecasting[J]. Environmental Modelling and Software, 48: 152-162.
DOI URL |
| [9] | 陈良富, 闫珺, 范闻捷, 等, 2016. 《遥感学报》20年: 从热点到前沿[J]. 遥感学报, 20(5): 794-806. |
| CHEN L F, YAN J, FAN W J, et al., 2016. Twentieth anniversary of the Journal of Remote Sensing[J]. Journal of Remote Sensing, 20(5): 794-806. | |
| [10] | 丁岳水, 1980. 关于合理确定污水BOD分析中稀释倍数问题的探讨[J]. 重庆环境保护 (5): 26-27, 48. |
| DING Y S, 1980. Discussion on reasonable determination of dilution factor in BOD analysis of sewage[J]. Chongqing Environmental Science (5): 26-27, 48. | |
| [11] | 杜成功, 李云梅, 王桥, 等, 2016. 面向GOCI数据的太湖总磷浓度反演及其日内变化研究[J]. 环境科学, 37(3): 862-872. |
| DU C G, LI Y M, WANG Q, et al., 2016. Inversion model and daily variation of total phosphorus concentrations in Taihu Lake based on GOCI data[J]. Environmental Science, 37(3): 862-872. | |
| [12] | 国家环保总局, 国家质量监督检验检疫总局, 2002. 地表水环境质量标准: GB 3838—2002 [S]. |
| State Environmental Protection Administration, General administration of quality supervision, inspection and quarantine of the PRC, 2002. Environmental quality standards for surface water: GB 3838—2002 [S]. | |
| [13] | 范成新, 1996. 太湖水体生态环境历史演变[J]. 湖泊科学 (4): 297-304. |
| FAN C X, 1996. Historical evolution of water ecological setting in Taihu Lake[J]. Journal of Lake Sciences (4): 297-304. | |
| [14] |
黄耀欢, 王浩, 肖伟华, 等, 2010. 内陆水体环境遥感监测研究评述[J]. 地理科学进展, 29(5): 549-556.
DOI |
| HUANG Y H, WANG H, XIAO W H, et al., 2010. The review of inland water environment monitoring based on remote sensing[J]. Progress in Geography, 29(5): 549-556. | |
| [15] | 贾军梅, 罗维, 杜婷婷, 等, 2015. 近十年太湖生态系统服务功能价值变化评估[J]. 生态学报, 35(7): 2255-2264. |
| JIA J M, LUO W, DU T T, et al., 2015. Valuation of changes of ecosystem services of Tai Lake in recent 10 years[J]. Acta Ecologica Sinica, 35(7): 2255-2264. | |
| [16] | 李国刚, 王德龙, 2004. 生化需氧量 (BOD) 测定方法综述[J]. 中国环境监测, 20(2): 54-57. |
| LI G G, WANG D L, 2004. Review on determination methods of biological oxygen demand (BOD)[J]. Environmental Monitoring in China, 20(2): 54-57. | |
| [17] | 林剑远, 张长兴, 2019. 航空高光谱遥感反演城市河网水质参数[J]. 遥感信息, 34(2): 23-29. |
| LIN J Y, ZHANG C X, 2019. Inversion of water quality parameters of urban river network using airborne hyperspectral remote sensing[J]. Remote Sensing Information, 34(2): 23-29. | |
| [18] | 刘忠华, 李云梅, 吕恒, 等, 2011. 基于偏最小二乘法的巢湖悬浮物浓度反演[J]. 湖泊科学, 23(3): 357-365. |
|
LIU Z H, LI Y M, LU H, et al., 2011. Inversion of suspended matter concentration in Lake Chaohu based on partial least squares regression[J]. Journal of Lake Sciences, 23(3): 357-365.
DOI URL |
|
| [19] | 林泽新, 2002. 太湖流域水环境变化及缘由分析[J]. 湖泊科学, 14(2):111-116. |
| LIN Z X, 2002. Analysis of Water Environmental Change in Taihu Watershed[J]. Journal of Lake Science, 14(2): 111-116. | |
| [20] | 柳后起, 方正, 孟岩, 等, 2020. 环太湖水体污染现状分析[J]. 生态环境学报, 29(11): 2262-2269. |
| LIU H Q, FANG Z, MENG Y, et al., 2020. Water quality assessment around Lake Taihu[J]. Ecology and Environmental Sciences, 29(11): 2262-2269. | |
| [21] | 蒲莉莉, 刘斌, 2015. 结合光谱响应函数的Landsat-8影像大气校正研究[J]. 遥感信息, 30(2): 116-119. |
| PU L L, LIU B, 2015. Atmospheric correction of Landsat-8 imagery based on spectral response function[J]. Remote Sensing Information, 30(2): 116-119. | |
| [22] | 盛翼, 张虎军, 王洁尘, 2019. 2016年太湖水质状况的综合评价与分析[J]. 干旱环境监测, 33(2): 49-54. |
| SHENG Y, ZHANG H J, WANG J C, 2019. Comprehensive evaluation and analysis of water quality of Tai Lake in 2016[J]. Arid Environmental Monitoring. 33(2): 49-54. | |
| [23] | 田野, 郭子祺, 乔彦超, 等, 2015. 基于遥感的官厅水库水质监测研究[J]. 生态学报, 35(7): 2217-2226. |
| TIAN Y, GUO Z Q, QIAO Y C, et al., 2015. Remote sensing of water quality monitoring in GuanTing Reservoir[J]. Acta Ecologica Sinica, 35(7): 2217-2226. | |
| [24] | 陶玉强, 赵睿涵, 2020. 持久性有机污染物在中国湖库水体中的污染现状及分布特征[J]. 湖泊科学, 32(2): 309-324. |
| TAO Y Q, ZHAO R H, 2020. Occurrence and distribution of persistent organic pollutants in water of Chinese lakes and reservoirs[J]. Journal of Lake Science, 32(2): 309-324. | |
| [25] | 王洪伟, 王波, 纪童, 等, 2021. 基于高光谱的水体BOD含量模拟估算[J]. 光谱学与光谱分析, 41(3): 978-983. |
| WANG H W, WANG B, JI T, et al., 2021. Simulation estimation of BOD content in water based on hyperspectral[J]. Spectroscopy and Spectral Analysis, 41(3): 978-983. | |
| [26] | 王林, 白洪伟, 2013. 基于遥感技术的湖泊水质参数反演研究综述[J]. 全球定位系统, 38(1): 57-61, 72. |
| WANG L, BAI H W, 2013. Method of Attitude Measurement and Prospect of GPS Compass[J]. GNSS World of China, 38(1): 57-61, 72. | |
| [27] | 谢红彬, 燕乃玲, 虞孝感, 2004. 工业化过程的差异对太湖流域水环境质量的影响——以无锡市和湖州市为例[J]. 湖泊科学, 16(4): 349-355. |
| XIE H B, YAN N L, YU X G, 2004. The impact of regional difference of industrialization on water quality in Taihu Basin: A case study on Wuxi and Huzhou[J]. Journal of Lake Science, 16(4): 349-355. | |
| [28] | 徐涵秋, 唐菲, 2013. 新一代Landsat系列卫星: Landsat8遥感影像新增特征及其生态环境意义[J]. 生态学报, 33(11): 3249-3257. |
|
XU H Q, TANG F, 2013. Analysis of new characteristics of the first Landsat 8 image and their eco-environmental significance[J]. Acta Ecologica Sinica, 33(11): 3249-3257.
DOI URL |
|
| [29] | 徐冠华, 柳钦火, 陈良富, 等, 2016. 遥感与中国可持续发展: 机遇和挑战[J]. 遥感学报, 20(5): 679-688. |
| XU G H, LIU Q H, CHEN L F, et al., 2016. Remote sensing for China’s sustainable development: Opportunities and challenges[J]. Journal of Remote Sensing, 20(5): 679-688. | |
| [30] | 徐伟朴, 陈同斌, 刘俊良, 等, 2004. 规模化畜禽养殖对环境的污染及防治策略[J]. 环境科学, 25(S1):105-108. |
| XU W P, CHEN T B, LIU J L, et al., 2004. Environmental pollution, comprehensive prevention and control tactics of the scale and intensify poultry farming[J]. Environmental Science, 25(S1): 105-108. | |
| [31] | 杨柳, 韩瑜, 汪祖茂, 等, 2013. 基于BP神经网络的温榆河水质参数反演模型研究[J]. 水资源与水工程学报, 24(6): 25-28. |
| YANG L, HAN Y, WANG Z M, et al., 2013. Study on retrieval model of water quality parameter in Wenyu River based on BP neural network[J]. Journal of Water Resources & Water Engineering, 24(6): 25-28. | |
| [32] | 殷燕, 张运林, 时志强, 等, 2010. 太湖化学耗氧量和生化需氧量的时空分布特征[J]. 环境科学学报, 30(12): 2544-2552. |
| YIN Y, ZHANG Y L, SHI Z Q, et al., 2010. Temporal-spatial variations of chemical oxygen demand and biochemical oxygen demand in Lake Taihu[J]. Acta Scientiae Circumstantiae, 30(12): 2544-2552. | |
| [33] | 曾庆飞, 谷孝鸿, 周露洪, 等, 2011. 东太湖水质污染特征研究[J]. 中国环境科学, 31(8): 1355-1360. |
| ZENG Q F, GU X H, ZHOU L H, et al., 2011. Water quality pollution characteristics in East Taihu Lake[J]. China Environmental Science, 31(8): 1355-1360. | |
| [34] | 曾祥英, 李尔, 2010. 基于反演算法的感潮型佛山水道BOD5水质模型[J]. 市政技术, 28(2): 117-118. |
| ZENG X Y, LI R, 2010. Application of inverse calculation models for BOD5 in Tidal Foshan River[J]. Environment Protection Engineering, 28(2): 117-118. | |
| [35] | 查慧铭, 朱梦圆, 朱广伟, 等, 2018. 太湖出入湖河道与湖体水质季节差异分析[J]. 环境科学, 39(3): 1102-1112. |
| ZHA H M, ZHU M Y, ZHU G W, et al., 2018. Seasonal difference in water quality between lake and inflow/outflow rivers of lake Taihu, China[J]. Environmental Science, 39(3): 1102-1112. | |
| [36] | 张长飞, 丁克强, 李红艺, 等, 2015. 太湖上游地区规模化畜禽养殖污染控制研究[J]. 化工装备技术, 36(1): 55-58. |
| ZHANG C F, DING K Q, LI H Y, et al., 2015. Research on pollution control of the large-scale livestock and poultry breeding in the upper reaches of Taihu Lake[J]. Chemical Equipment Technology, 36(1): 55-58. | |
| [37] | 张运林, 朱广伟, 秦伯强, 等, 2020. 有色可溶性有机物 (CDOM) 吸收作为湖库化学需氧量监测替代指标的探讨[J]. 湖泊科学, 32(6): 1575-1584. |
|
ZHANG Y L, ZHU G W, QIN B Q, et al., 2020. Application feasibility of chromophoric dissolved organic matter (CDOM) absorption coefficient as the substitute for chemical oxygen demand concentration in lakes and reservoirs[J]. Journal of Lake Sciences, 32(6): 1575-1584.
DOI URL |
|
| [38] | 赵晨露, 马荣华, 郝景燕, 等, 2012. 太湖水体吸收分解(Ⅱ): 浮游植物色素吸收分解[J]. 湖泊科学, 24(6): 905-913. |
|
ZHAO C L, MA R H, HAO J Y, et al., 2012. The absorption spectral decomposition of water in Lake Taihu, China (Ⅱ): The decomposition of absorption due to phytoplankton pigments[J]. Journal of Lake Sciences, 24(6): 905-913.
DOI URL |
| [1] | 董智今, 张呈春, 展秀丽, 张维福. 宁夏河东沙地生物土壤结皮及其下伏土壤养分的空间分布特征[J]. 生态环境学报, 2023, 32(5): 910-919. |
| [2] | 杨春亮, 刘旻霞, 王千月, 苗乐乐, 肖音迪, 王敏. 单户与联户放牧经营下草玉梅与嵩草种群空间格局及其关联性[J]. 生态环境学报, 2023, 32(4): 651-659. |
| [3] | 吴胜义, 王飞, 徐干君, 马浩, 党禹杰, 吴菲. 川西北高山峡谷区森林碳储量及空间分布研究--以四川洛须自然保护区为例[J]. 生态环境学报, 2022, 31(9): 1735-1744. |
| [4] | 李秀华, 赵玲, 滕应, 骆永明, 黄标, 刘冲, 刘本乐, 赵其国. 贵州汞矿区周边农田土壤汞镉复合污染特征空间分布及风险评估[J]. 生态环境学报, 2022, 31(8): 1629-1636. |
| [5] | 温智峰, 魏识广, 李林, 叶万辉, 练琚愉. 南亚热带常绿阔叶林植物不同分类水平上的空间分布格局及空间关联[J]. 生态环境学报, 2022, 31(3): 440-450. |
| [6] | 刘沙沙, 陈诺, 杨晓茵. 微塑料对有机污染物的吸附-解吸特性及其复合毒性效应研究进展[J]. 生态环境学报, 2022, 31(3): 610-620. |
| [7] | 刘娣, 苏超, 张红, 秦冠宇. 典型煤炭产业聚集区土壤重金属污染特征与风险评价[J]. 生态环境学报, 2022, 31(2): 391-399. |
| [8] | 张楷悦, 刘增辉, 王颜昊, 王敬宽, 崔德杰, 柳新伟. 黄河三角洲自然保护区土壤PAHs的风险评估和空间特征[J]. 生态环境学报, 2022, 31(11): 2198-2205. |
| [9] | 王海鹤, 孙媛媛, 张帅, 徐小蓉, 商成梅, 黎春想. 贵阳市集中式饮用水源地重金属污染特征及健康风险评价[J]. 生态环境学报, 2022, 31(10): 2039-2047. |
| [10] | 刘畅, 罗艳丽, 刘晨通, 郑玉红, 晁博, 董乐乐. 奎屯河下游区域地下水和农田土壤砷的空间分布特征[J]. 生态环境学报, 2022, 31(10): 2070-2078. |
| [11] | 任丽江, 张妍, 张鑫, 山泽萱, 张成前. 渭河流域关中段地表水重金属的污染特征与健康风险评价[J]. 生态环境学报, 2022, 31(1): 131-141. |
| [12] | 王浩, 陈永金, 刘加珍, 万波, 张丽. 黄河三角洲新生湿地3种柽柳灌丛对土壤有机碳空间分布的影响研究[J]. 生态环境学报, 2022, 31(1): 9-16. |
| [13] | 许冬雪, 李兴, 王勇, 勾芒芒. 冰封期乌梁素海不同形态氮、磷和叶绿素a的空间分布特征及其响应关系[J]. 生态环境学报, 2021, 30(9): 1855-1864. |
| [14] | 李海萍, 李光一, 万华伟, 李利平. 基于矩阵分析法的鸟类与哺乳动物物种丰富度空间差异研究——以新疆为例[J]. 生态环境学报, 2021, 30(7): 1333-1341. |
| [15] | 薛力园, 刘志亮, 宋伟, 安颖, 袁晓博, 陈晓. 秦皇岛海域春季海月水母碟状幼体空间分布及其与海洋环境因子的关系[J]. 生态环境学报, 2021, 30(6): 1240-1248. |
| 阅读次数 | ||||||
|
全文 |
|
|||||
|
摘要 |
|
|||||