生态环境学报 ›› 2023, Vol. 32 ›› Issue (5): 910-919.DOI: 10.16258/j.cnki.1674-5906.2023.05.009
董智今( ), 张呈春, 展秀丽*(), 张维福
收稿日期:2023-02-03
出版日期:2023-05-18
发布日期:2023-08-09
通讯作者:
*展秀丽(1983年生),女,副教授,博士,从事荒漠化防治研究。E-mail: zhanxiuli@mail.bnu.edu.cn作者简介:董智今(1997年生),女,硕士研究生,主要从事干旱区生态水文与荒漠化防治等研究。E-mail: dzj327805@163.com
基金资助:
DONG Zhijin(), ZHANG Chengchun, ZHAN Xiuli*(), ZHANG Weifu
Received:2023-02-03
Online:2023-05-18
Published:2023-08-09
摘要:
为了揭示沙地生物土壤结皮的生长发育情况及其下伏土壤养分的空间分布特征,选择宁夏河东沙地为研究区,通过野外采样和室内实验,应用经典统计学、地学统计学和地理系统预测,分析了藻类和藓类结皮及其下伏0-5、5-10 cm土层土壤有机碳(SOC)、全氮(TN)、全磷(TP)含量以及结皮层厚度的空间分布特征。结果表明:(1)SOC、TN、TP质量分数的变异系数(CV)呈中等变异,CVTN (57.1%)>CVSOC (48.7%)>CVTP (30.5%),生物土壤结皮对下伏土壤养分影响显著,其中藓类结皮对SOC和TN的影响更显著,藻类结皮则对TP的影响更显著;(2)藻类结皮下5-10 cm土层TN质量分数呈现强烈空间自相关性,块金系数(N/S)为20.3%,其余土层的SOC、TN、TP质量分数空间自相关性中等,TP质量分数空间变异由随机因素主导,SOC和TN则由结构因素主导;(3)在区域尺度和剖面尺度上,生物土壤结皮及下伏土壤的养分空间分布特征差异显著,结皮层土壤SOC质量分数中部和北部高、南部低,TN质量分数中南部高、西北部低,TP质量分数中东部高、西北部低,均呈条带状分布,0-5、5-10 cm土层SOC和TP质量分数呈中部高四周低的分布特征,TN质量分数呈南部和东部高、西部和中部低的分布特征,SOC与TP形成了典型的“肥岛”,而TN则形成了典型的“水岛”;研究区内TN的空间分布与SOC和TP的空间分布特征不一致,但是与藻类结皮层厚度的空间分布有较高的相似性。这表明,生物土壤结皮能够影响其下伏土壤的养分空间分布。此结果可以为研究旱区荒漠生态系统中生物土壤结皮的生态功能提供数据参考。
中图分类号:
董智今, 张呈春, 展秀丽, 张维福. 宁夏河东沙地生物土壤结皮及其下伏土壤养分的空间分布特征[J]. 生态环境学报, 2023, 32(5): 910-919.
DONG Zhijin, ZHANG Chengchun, ZHAN Xiuli, ZHANG Weifu. Spatial Distribution Characteristics of Soil Nutrients of Biological Soil Crusts and Their Underlying Soil of Sandy Land in the East of Yellow River in Ningxia[J]. Ecology and Environment, 2023, 32(5): 910-919.
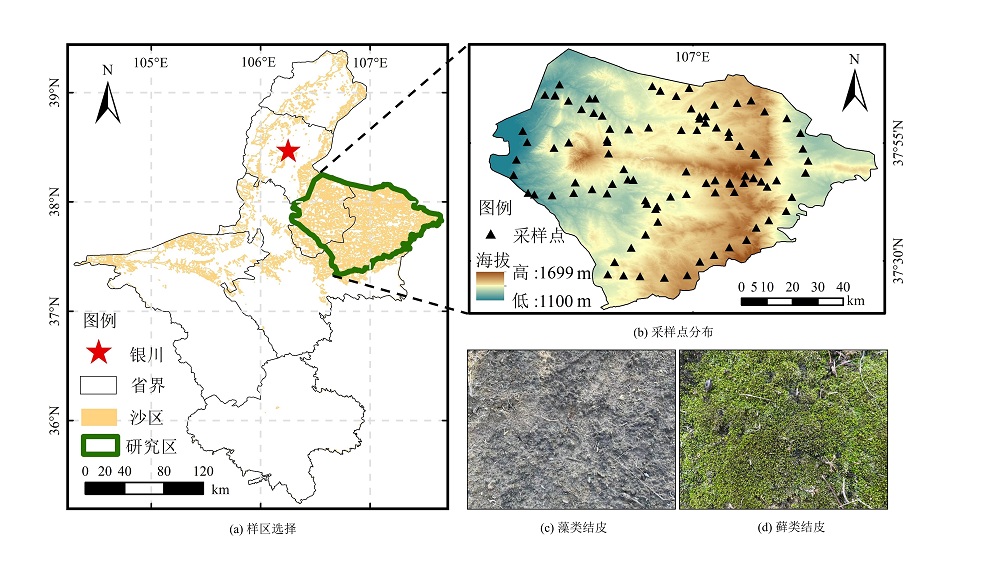
图1 研究区与样点位置
Figure 1 Studied area and sampling site locations
| 指标 | 结皮类型 | 土层深度/cm | 最小值 | 最大值 | 平均值 | 标准差 | 变异系数/% | 峰度 | 偏度 | K-S检验 |
|---|---|---|---|---|---|---|---|---|---|---|
| 结皮厚度/ mm | 藻类 | 结皮层 | 1.55 | 8.06 | 4.20 | 1.33 | 31.7 | 0.12 | 0.55 | N |
| 藓类 | 结皮层 | 5.76 | 20.3 | 11.2 | 3.01 | 27.0 | 1.17 | 0.83 | N | |
| w(土壤有机碳)/ (g·kg-1) | 藻类 | 结皮层 | 2.46 | 28.8 | 13.1 | 5.28 | 40.2 | -0.12 | 0.39 | N |
| 0-5 | 0.77 | 20.8 | 4.99 | 3.04 | 61.1 | 7.69 | 2.02 | LN | ||
| 5-10 | 0.47 | 7.88 | 3.01 | 1.61 | 53.4 | 1.03 | 0.84 | SQRT | ||
| 藓类 | 结皮层 | 4.94 | 28.3 | 16.8 | 5.85 | 34.9 | -0.76 | -0.11 | N | |
| 0-5 | 0.62 | 18.2 | 6.50 | 3.31 | 51.0 | 2.15 | 1.35 | LN | ||
| 5-10 | 0.13 | 9.42 | 3.69 | 1.89 | 51.4 | 0.44 | 0.66 | N | ||
| w(土壤全氮)/ (g·kg-1) | 藻类 | 结皮层 | 0.09 | 2.22 | 1.03 | 0.45 | 43.4 | 0.11 | 0.24 | N |
| 0-5 | 0.02 | 0.90 | 0.34 | 0.20 | 59.5 | -0.61 | 0.57 | SQRT | ||
| 5-10 | 0.00 | 0.37 | 0.12 | 0.08 | 67.4 | 0.08 | 0.63 | N | ||
| 藓类 | 结皮层 | 0.11 | 2.88 | 1.38 | 0.65 | 47.1 | -0.01 | 0.17 | N | |
| 0-5 | 0.02 | 1.06 | 0.34 | 0.21 | 63.0 | 0.10 | 0.71 | LN | ||
| 5-10 | 0.01 | 0.31 | 0.12 | 0.08 | 62.4 | -0.45 | 0.56 | SQRT | ||
| w(土壤全磷)/ (g·kg-1) | 藻类 | 结皮层 | 0.18 | 0.65 | 0.34 | 0.10 | 30.2 | 0.71 | 0.90 | N |
| 0-5 | 0.13 | 0.54 | 0.26 | 0.09 | 33.2 | 1.50 | 1.25 | N | ||
| 5-10 | 0.13 | 0.50 | 0.25 | 0.08 | 32.5 | 0.98 | 1.01 | N | ||
| 藓类 | 结皮层 | 0.22 | 0.58 | 0.37 | 0.09 | 24.2 | -0.34 | 0.44 | SQRT | |
| 0-5 | 0.16 | 0.55 | 0.31 | 0.09 | 29.6 | 0.20 | 0.78 | LN | ||
| 5-10 | 0.12 | 0.57 | 0.28 | 0.09 | 33.3 | 0.41 | 0.76 | LN |
表1 生物土壤结皮及下伏土壤SOC、TN、TP和结皮层厚度的统计特征
Table 1 Statistical characteristics of SOC, TN, TP and thickness of crusts in biological soil crusts
| 指标 | 结皮类型 | 土层深度/cm | 最小值 | 最大值 | 平均值 | 标准差 | 变异系数/% | 峰度 | 偏度 | K-S检验 |
|---|---|---|---|---|---|---|---|---|---|---|
| 结皮厚度/ mm | 藻类 | 结皮层 | 1.55 | 8.06 | 4.20 | 1.33 | 31.7 | 0.12 | 0.55 | N |
| 藓类 | 结皮层 | 5.76 | 20.3 | 11.2 | 3.01 | 27.0 | 1.17 | 0.83 | N | |
| w(土壤有机碳)/ (g·kg-1) | 藻类 | 结皮层 | 2.46 | 28.8 | 13.1 | 5.28 | 40.2 | -0.12 | 0.39 | N |
| 0-5 | 0.77 | 20.8 | 4.99 | 3.04 | 61.1 | 7.69 | 2.02 | LN | ||
| 5-10 | 0.47 | 7.88 | 3.01 | 1.61 | 53.4 | 1.03 | 0.84 | SQRT | ||
| 藓类 | 结皮层 | 4.94 | 28.3 | 16.8 | 5.85 | 34.9 | -0.76 | -0.11 | N | |
| 0-5 | 0.62 | 18.2 | 6.50 | 3.31 | 51.0 | 2.15 | 1.35 | LN | ||
| 5-10 | 0.13 | 9.42 | 3.69 | 1.89 | 51.4 | 0.44 | 0.66 | N | ||
| w(土壤全氮)/ (g·kg-1) | 藻类 | 结皮层 | 0.09 | 2.22 | 1.03 | 0.45 | 43.4 | 0.11 | 0.24 | N |
| 0-5 | 0.02 | 0.90 | 0.34 | 0.20 | 59.5 | -0.61 | 0.57 | SQRT | ||
| 5-10 | 0.00 | 0.37 | 0.12 | 0.08 | 67.4 | 0.08 | 0.63 | N | ||
| 藓类 | 结皮层 | 0.11 | 2.88 | 1.38 | 0.65 | 47.1 | -0.01 | 0.17 | N | |
| 0-5 | 0.02 | 1.06 | 0.34 | 0.21 | 63.0 | 0.10 | 0.71 | LN | ||
| 5-10 | 0.01 | 0.31 | 0.12 | 0.08 | 62.4 | -0.45 | 0.56 | SQRT | ||
| w(土壤全磷)/ (g·kg-1) | 藻类 | 结皮层 | 0.18 | 0.65 | 0.34 | 0.10 | 30.2 | 0.71 | 0.90 | N |
| 0-5 | 0.13 | 0.54 | 0.26 | 0.09 | 33.2 | 1.50 | 1.25 | N | ||
| 5-10 | 0.13 | 0.50 | 0.25 | 0.08 | 32.5 | 0.98 | 1.01 | N | ||
| 藓类 | 结皮层 | 0.22 | 0.58 | 0.37 | 0.09 | 24.2 | -0.34 | 0.44 | SQRT | |
| 0-5 | 0.16 | 0.55 | 0.31 | 0.09 | 29.6 | 0.20 | 0.78 | LN | ||
| 5-10 | 0.12 | 0.57 | 0.28 | 0.09 | 33.3 | 0.41 | 0.76 | LN |
| 指标 | 结皮类型 | 土层深度/cm | 拟合模型 | 块金值 (C0) | 基台值 (C0+C) | 块金系数[C0/(C0+C)]/% | 变程/km | 决定系数 | 残差 |
|---|---|---|---|---|---|---|---|---|---|
| 结皮层厚度/ mm | 藻类 | 结皮层 | 指数 | 1.70×10⁻² | 4.50×10⁻² | 37.8 | 63.3 | 0.74 | 4.02×10⁻⁵ |
| 藓类 | 结皮层 | 指数 | 0.60×10⁻² | 0.10×10⁻¹ | 60.0 | 11.3 | 0.67 | 2.69×10⁻⁵ | |
| w(土壤有机碳)/ (g·kg-1) | 藻类 | 结皮层 | 球状 | 1.08×10⁻¹ | 2.16×10⁻¹ | 50.0 | 22.4 | 0.75 | 2.69×10⁻³ |
| 0-5 | 指数 | 2.50×10⁻² | 0.50×10⁻¹ | 50.0 | 21.2 | 0.62 | 1.03×10⁻⁴ | ||
| 5-10 | 指数 | 2.40×10⁻² | 0.56×10⁻¹ | 42.9 | 23.3 | 0.79 | 9.50×10⁻⁵ | ||
| 藓类 | 结皮层 | 高斯 | 2.20×10⁻² | 0.50×10⁻¹ | 44.0 | 19.7 | 0.92 | 3.09×10⁻⁵ | |
| 0-5 | 高斯 | 1.82×10⁻¹ | 3.05×10⁻¹ | 59.7 | 38.9 | 0.95 | 9.03×10⁻² | ||
| 5-10 | 球状 | 1.97×10⁻¹ | 3.95×10⁻¹ | 49.9 | 147 | 0.92 | 2.09×10⁻³ | ||
| w(土壤全氮)/ (g·kg-1) | 藻类 | 结皮层 | 指数 | 4.40×10⁻² | 1.10×10⁻¹ | 40.0 | 42.7 | 0.67 | 3.04×10⁻⁴ |
| 0-5 | 球状 | 1.80×10⁻² | 0.37×10⁻¹ | 48.7 | 42.0 | 0.92 | 4.49×10⁻⁵ | ||
| 5-10 | 指数 | 1.60×10⁻² | 0.79×10⁻¹ | 20.3 | 52.5 | 0.87 | 0.04×10⁻⁵ | ||
| 藓类 | 结皮层 | 高斯 | 5.80×10⁻² | 1.16×10⁻¹ | 50.0 | 134 | 0.81 | 0.65×10⁻³ | |
| 0-5 | 球状 | 1.70×10⁻² | 0.35×10⁻¹ | 48.6 | 15.5 | 0.47 | 1.22×10⁻⁴ | ||
| 5-10 | 高斯 | 0.70×10⁻² | 0.12×10⁻¹ | 58.3 | 61.3 | 0.74 | 4.32×10⁻⁵ | ||
| w(土壤全磷)/ (g·kg-1) | 藻类 | 结皮层 | 球状 | 0.50×10⁻² | 0.70×10⁻² | 71.4 | 7.14 | 0.64 | 1.81×10⁻⁴ |
| 0-5 | 指数 | 0.50×10⁻² | 0.70×10⁻² | 71.4 | 6.30 | 0.58 | 2.82×10⁻⁵ | ||
| 5-10 | 指数 | 0.60×10⁻² | 0.13×10⁻¹ | 46.2 | 63.3 | 0.63 | 0.62×10⁻⁵ | ||
| 藓类 | 结皮层 | 高斯 | 0.50×10⁻² | 0.11×10⁻¹ | 45.5 | 26.7 | 0.97 | 0.02×10⁻⁵ | |
| 0-5 | 指数 | 3.40×10⁻² | 0.54×10⁻¹ | 63.0 | 117 | 0.80 | 9.85×10⁻³ | ||
| 5-10 | 指数 | 6.20×10⁻² | 1.02×10⁻¹ | 60.8 | 110 | 0.73 | 6.63×10⁻³ |
表2 生物土壤结皮及下伏土壤养分变异函数理论模型与相关系数
Table 2 Theoretical models and correlation coefficients for nutrient variation functions in biological soil crusts
| 指标 | 结皮类型 | 土层深度/cm | 拟合模型 | 块金值 (C0) | 基台值 (C0+C) | 块金系数[C0/(C0+C)]/% | 变程/km | 决定系数 | 残差 |
|---|---|---|---|---|---|---|---|---|---|
| 结皮层厚度/ mm | 藻类 | 结皮层 | 指数 | 1.70×10⁻² | 4.50×10⁻² | 37.8 | 63.3 | 0.74 | 4.02×10⁻⁵ |
| 藓类 | 结皮层 | 指数 | 0.60×10⁻² | 0.10×10⁻¹ | 60.0 | 11.3 | 0.67 | 2.69×10⁻⁵ | |
| w(土壤有机碳)/ (g·kg-1) | 藻类 | 结皮层 | 球状 | 1.08×10⁻¹ | 2.16×10⁻¹ | 50.0 | 22.4 | 0.75 | 2.69×10⁻³ |
| 0-5 | 指数 | 2.50×10⁻² | 0.50×10⁻¹ | 50.0 | 21.2 | 0.62 | 1.03×10⁻⁴ | ||
| 5-10 | 指数 | 2.40×10⁻² | 0.56×10⁻¹ | 42.9 | 23.3 | 0.79 | 9.50×10⁻⁵ | ||
| 藓类 | 结皮层 | 高斯 | 2.20×10⁻² | 0.50×10⁻¹ | 44.0 | 19.7 | 0.92 | 3.09×10⁻⁵ | |
| 0-5 | 高斯 | 1.82×10⁻¹ | 3.05×10⁻¹ | 59.7 | 38.9 | 0.95 | 9.03×10⁻² | ||
| 5-10 | 球状 | 1.97×10⁻¹ | 3.95×10⁻¹ | 49.9 | 147 | 0.92 | 2.09×10⁻³ | ||
| w(土壤全氮)/ (g·kg-1) | 藻类 | 结皮层 | 指数 | 4.40×10⁻² | 1.10×10⁻¹ | 40.0 | 42.7 | 0.67 | 3.04×10⁻⁴ |
| 0-5 | 球状 | 1.80×10⁻² | 0.37×10⁻¹ | 48.7 | 42.0 | 0.92 | 4.49×10⁻⁵ | ||
| 5-10 | 指数 | 1.60×10⁻² | 0.79×10⁻¹ | 20.3 | 52.5 | 0.87 | 0.04×10⁻⁵ | ||
| 藓类 | 结皮层 | 高斯 | 5.80×10⁻² | 1.16×10⁻¹ | 50.0 | 134 | 0.81 | 0.65×10⁻³ | |
| 0-5 | 球状 | 1.70×10⁻² | 0.35×10⁻¹ | 48.6 | 15.5 | 0.47 | 1.22×10⁻⁴ | ||
| 5-10 | 高斯 | 0.70×10⁻² | 0.12×10⁻¹ | 58.3 | 61.3 | 0.74 | 4.32×10⁻⁵ | ||
| w(土壤全磷)/ (g·kg-1) | 藻类 | 结皮层 | 球状 | 0.50×10⁻² | 0.70×10⁻² | 71.4 | 7.14 | 0.64 | 1.81×10⁻⁴ |
| 0-5 | 指数 | 0.50×10⁻² | 0.70×10⁻² | 71.4 | 6.30 | 0.58 | 2.82×10⁻⁵ | ||
| 5-10 | 指数 | 0.60×10⁻² | 0.13×10⁻¹ | 46.2 | 63.3 | 0.63 | 0.62×10⁻⁵ | ||
| 藓类 | 结皮层 | 高斯 | 0.50×10⁻² | 0.11×10⁻¹ | 45.5 | 26.7 | 0.97 | 0.02×10⁻⁵ | |
| 0-5 | 指数 | 3.40×10⁻² | 0.54×10⁻¹ | 63.0 | 117 | 0.80 | 9.85×10⁻³ | ||
| 5-10 | 指数 | 6.20×10⁻² | 1.02×10⁻¹ | 60.8 | 110 | 0.73 | 6.63×10⁻³ |
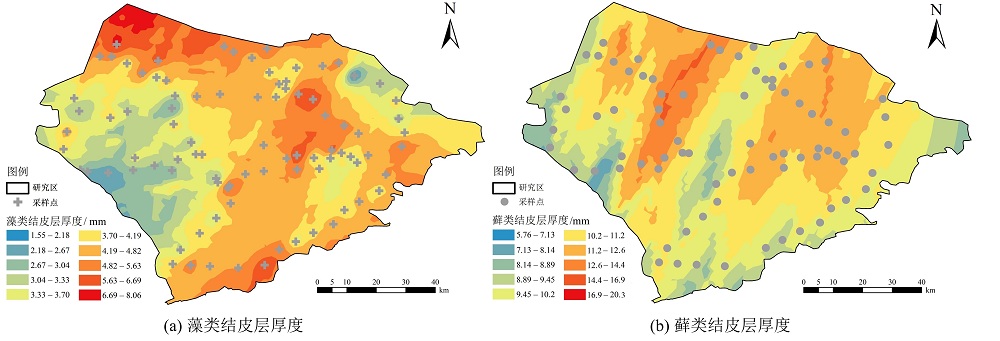
图2 宁夏河东沙地生物土壤结皮层厚度的空间分布
Figure 2 Spatial distribution of the thickness of biological soil crusts in the sandy land in east of Yellow River in Ningxia
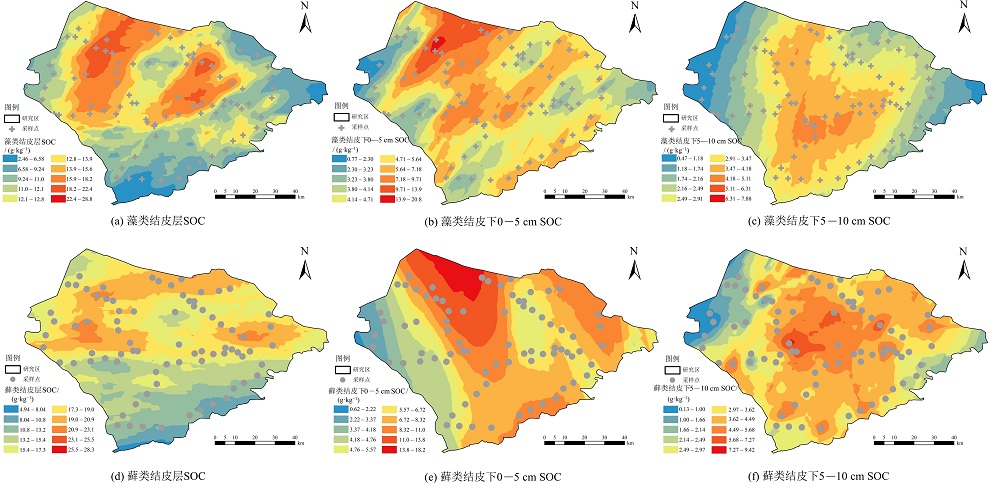
图3 宁夏河东沙地生物土壤结皮及下伏土壤SOC质量分数空间分布
Figure 3 Spatial distribution of SOC content in biological soil crusts in the sandy land the east of Yellow River in Ningxia
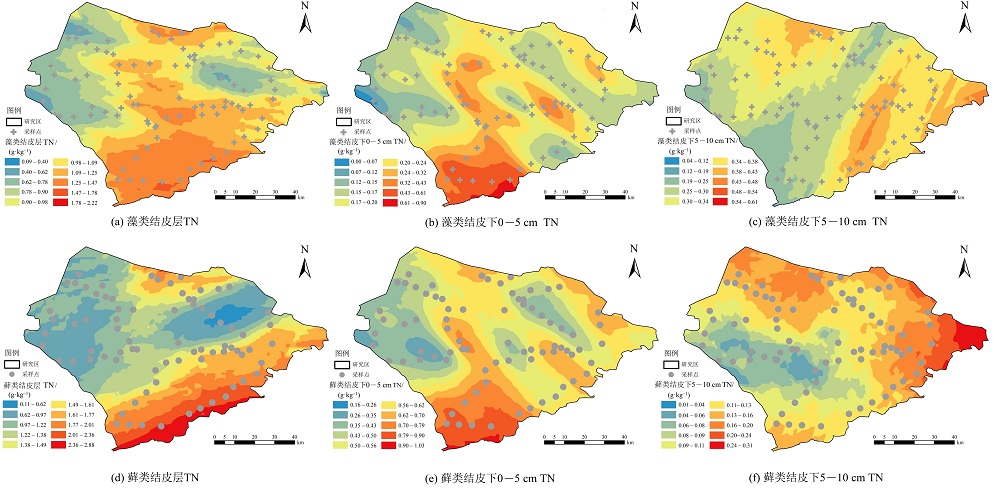
图4 宁夏河东沙地生物土壤结皮及下伏土壤TN质量分数空间分布
Figure 4 Spatial distribution of TN content in biological soil crusts in the sandy land the east of Yellow River in Ningxia
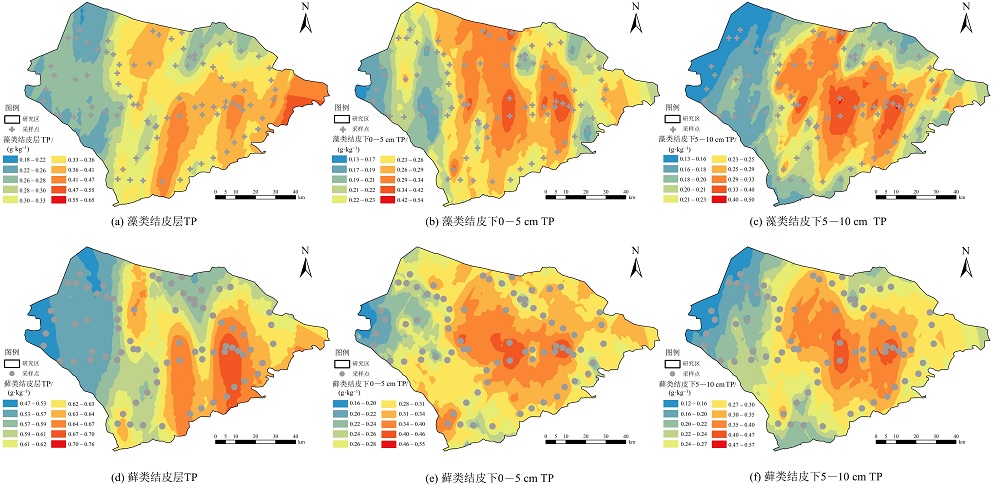
图5 宁夏河东沙地生物土壤结皮及下伏土壤TP质量分数空间分布
Figure 5 Spatial distribution of TP content in biological soil crusts in the sandy land the east of Yellow River in Ningxia
| 指标 | 极高 | 高 | 中上 | 中 | 低 | 极低 |
|---|---|---|---|---|---|---|
| 土壤有机质质量分数 | >40.0 | 30.0-40.0 | 20.0-30.0 | 10.0-20.0 | 6.00-10.0 | <6.00 |
| 全氮质量分数 | >2.00 | 1.50-2.00 | 1.00-1.50 | 0.75-1.00 | 0.50-0.75 | <0.50 |
| 全磷质量分数 | >2.00 | 1.50-2.00 | 1.00-1.50 | 0.75-1.00 | 0.50-0.75 | <0.50 |
表3 全国土壤养分分级标准表
Table 3 National soil nutrient content classification standard table g·kg-1
| 指标 | 极高 | 高 | 中上 | 中 | 低 | 极低 |
|---|---|---|---|---|---|---|
| 土壤有机质质量分数 | >40.0 | 30.0-40.0 | 20.0-30.0 | 10.0-20.0 | 6.00-10.0 | <6.00 |
| 全氮质量分数 | >2.00 | 1.50-2.00 | 1.00-1.50 | 0.75-1.00 | 0.50-0.75 | <0.50 |
| 全磷质量分数 | >2.00 | 1.50-2.00 | 1.00-1.50 | 0.75-1.00 | 0.50-0.75 | <0.50 |
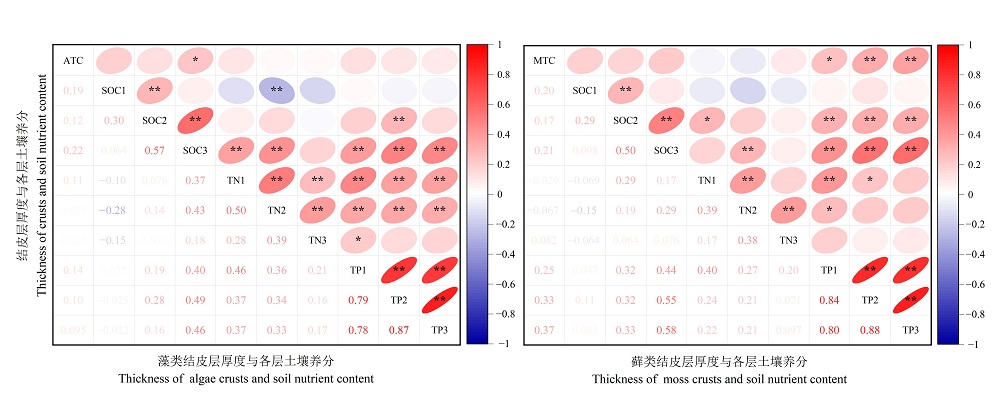
图6 生物土壤结皮层厚度与各层土壤养分的相关性分析 图中不同颜色、不同大小的椭圆表示相关系数的大小,椭圆倾斜方向表示相关系数的正负,数字表示相关系数,*P<0.05,**P<0.01。ATC:藻类结皮层厚度,MTC:藓类结皮层厚度,SOC1、SOC2、SOC3:分别对应藻类与藓类结皮层、0-5、5-10 cm土壤有机质质量分数,TN1、TN2、TN3:分别对应藻类与藓类结皮层、0-5、5-10 cm土壤全氮质量分数,TP1、TP2、TP3:分别对应藻类与藓类结皮层、0-5、5-10 cm土壤全磷质量分数
Figure 6 Correlation analysis of biological soil crusts thickness and soil nutrient content
| [1] | BARGER N N, WEBER B, GARCIA-PICHEL F, et al., 2016. Patterns and controls on nitrogen cycling of biological soil crusts[M]//Biological soil crusts: an organizing principle in drylands. Springer, Cham: 257-285. |
| [2] |
BELNAP J, 1995. Surface disturbances: their role in accelerating desertification[J]. Environmental Monitoring and Assessment, 37(1): 39-57.
DOI URL |
| [3] |
BELNAP J, 2002. Nitrogen fixation in biological soil crusts from southeast Utah, USA[J]. Biology and Fertility of Soils, 35(2): 128-135.
DOI URL |
| [4] |
BELNAP J, 2003. Biological soil crusts in deserts: a short review of their role in soil fertility, stabilization, and water relations[J]. Algological Studies, 109(1): 113-126.
DOI URL |
| [5] |
BU C F, WU S F, XIE Y S, et al., 2013. The study of biological soil crusts: hotspots and prospects[J]. Clean-Soil, Air, Water, 41(9): 899-906.
DOI URL |
| [6] |
CHAMIZO S, CANTÓN Y, MIRALLES I, 2012. Biological soil crust development affects physicochemical characteristics of soil surface in semiarid ecosystems[J]. Soil Biology and Biochemistry, 49: 96-105.
DOI URL |
| [7] |
CHEN N, WANG X P, ZHANG Y F, et al., 2018. Ecohydrological effects of biological soil crust on the vegetation dynamics of restoration in a dryland ecosystem[J]. Journal of Hydrology, 563: 1068-1077.
DOI URL |
| [8] |
LI X R, ZHANG P, SU Y G, et al., 2012. Carbon fixation by biological soil crusts following revegetation of sand dunes in arid desert regions of China: A four-year field study[J]. Catena, 97: 119-126.
DOI URL |
| [9] | XIAO B, BOWERK M A, 2020. Moss-biocrusts strongly decrease soil surface albedo, altering land-surface energy balance in a dryland ecosystem[J]. Science of the Total Environment, 741: 140425. |
| [10] |
ZHANG Y M, CHEN J, WANG L, et al., 2007. The spatial distribution patterns of biological soil crusts in the Gurbantunggut Desert, Northern Xinjiang, China[J]. Journal of Arid Environments, 68(4): 599-610.
DOI URL |
| [11] |
ZHANG Y M, WU N, ZHANG B C, et al., 2010. Species composition, distribution patterns andecological functions of biological soil crusts inthe Gurbantunggut Desert[J]. Journal of Arid Land, 2(3): 180-189.
DOI URL |
| [12] | 鲍士旦, 2000. 土壤农化分析[M]. 第3版. 北京: 中国农业出版社: 14-97. |
| BAO S D, 2000. Soil and agricultural chemistry analysis[M]. The third edition. Beijing: China Agriculture Press: 14-97. | |
| [13] |
卜崇峰, 张朋, 叶菁, 等, 2014. 陕北水蚀风蚀交错区小流域苔藓结皮的空间特征及其影响因子[J]. 自然资源学报, 29(3): 490-499.
DOI |
| BU C F, ZHANG P, YE Q, et al., 2014. Spatial characteristics of moss-dominated soil crust and its impact factors in small watershed in wind-water erosion crisscross region, northern Shaanxi province, China[J]. Journal of Natural Resources, 29(3): 490-499. | |
| [14] | 崔燕, 吕贻忠, 李保国, 2017. 鄂尔多斯沙地土壤生物结皮的理化性质[J]. 土壤, 36(2): 197-202. |
| CUI Y, LÜ Y Z, LI B G, 2017. Physico-chemical properties of soil microbiotic crusts on erdos plateau[J]. Soils, 36(2): 197-202. | |
| [15] | 董智今, 张呈春, 展秀丽, 2022. 宁夏河东沙地生物土壤结皮对土壤性质及入渗过程的影响[J]. 生态学报, 42(17): 7128-7136. |
| DONG Z J, ZHANG C C, ZHAN X L, 2022. Effects of biological soil crusts on soil properties and soil water infiltration process of sandy land in the east of Yellow River in Ningxia[J]. Acta Ecologica Sinica, 42(17): 7128-7136. | |
| [16] |
樊瑾, 李诗瑶, 余海龙, 等, 2021. 毛乌素沙地不同类型生物结皮与下层土壤酶活性及土壤碳氮磷化学计量特征[J]. 中国沙漠, 41(4): 109-120.
DOI |
| FAN J, LI S Y, YU H L, et al., 2021. Soil enzyme activity and carbon, nitrogen and phosphorus stoichiometric characteristics under different types of biocrusts and subsoil in Mu Us Sandland[J]. Journal of Desert Research, 41(4): 109-120. | |
| [17] | 高丽倩, 赵允格, 许明祥, 等, 2018. 生物土壤结皮演替对土壤生态化学计量特征的影响[J]. 生态学报, 38(2): 678-688. |
| GAO L Q, ZHAO Y G, XU M X, et al., 2018. The effects of biological soil crust succession on soil ecological stoichiometry characteristics[J]. Acta Ecologica Sinica, 38(2): 678-688. | |
| [18] | 郭琦, 卜崇峰, 李宜坪, 等, 2022. 区域尺度生物结皮下伏土壤养分的空间分布特征——以毛乌素沙地为例[J]. 土壤学报, 59(3): 699-707. |
| GUO Q, BU C F, L1 Y P, et al., 2022. The spatial distribution characteristics of soil nutrients underlying biological crusts at regional scale: A case study of Mu Us Sandy Land[J]. Acta Pedologica Sinica, 59(3): 699-707. | |
| [19] | 何明珠, 李新荣, 张景光, 等, 2006. 土壤生物结皮蒸散特征研究[J]. 中国沙漠, 26(2): 159-164. |
| HE M Z, LI X R, ZHANG J G, et al., 2006. Evapotranspiration characteristics of soil microbiotic crusts[J]. Journal of Desert Research, 26(2): 159-164. | |
| [20] | 吉雪花, 张元明, 周小兵, 等, 2014. 不同尺度苔藓结皮土壤性状的空间分布特征[J]. 生态学报, 34(14): 4006-4016. |
| JI X H, ZHANG Y M, ZHOU X B, et al., 2014. Spatial distribution of soil properties covered by moss crusts on different scales[J]. Acta Ecologica Sinica, 34(14): 4006-4016. | |
| [21] | 李从娟, 雷加强, 徐新文, 等, 2014. 古尔班通古特沙漠土壤水分与化学性质的空间分布[J]. 生态学报, 34(15): 4380-4389. |
| LI C J, LEI J Q, XU X W, et al., 2014. Spatial pattern for soil water and chemical properties in Gurbantunggut Desert[J]. Acta Ecologica Sinica, 34(15): 4380-4389. | |
| [22] |
李亚红, 卜崇峰, 郭琦, 等, 2021. 毛乌素沙地藓、藻结皮生态功能对比[J]. 中国沙漠, 41(2): 138-144.
DOI |
|
LI Y H, BU C F, GUO Q, et al., 2021. Ecological functions comparison of moss crust and algae crust in the Mu Us Sand Land[J]. Journal of Desert Research, 41(2): 138-144.
DOI |
|
| [23] | 李新荣, 谭会娟, 回嵘, 等, 2018. 中国荒漠与沙地生物土壤结皮研究[J]. 科学通报, 63(23): 2320-2334. |
| LI X R, TAN H J, HUI R, et al., 2018. Researches in biological soil crust of China[J]. Chinese Science Bulletin, 63(23): 2320-2334. | |
| [24] | 李新荣, 张志山, 王新平, 等, 2009. 干旱区土壤植被系统恢复的生态水文学研究进展[J]. 中国沙漠, 29(5): 845-852. |
| LI X R, ZHANG Z S, WANG X P, et al., 2009. The ecohydrology of the soil vegetation system restoration in arid zones[J]. Journal of Desert Research, 29(5): 845-852. | |
| [25] | 李云飞, 马晓俊, 李小军, 2020. 固沙植被演替过程中藓类结皮及其表层土壤理化性质变化[J]. 兰州大学学报 (自然科学版), 56(4): 463-470. |
| LI Y F, MA X J, II X J, et al., 2020. Changes in physicochemical properties of moss crusts and the underlying soil during the succession of sand-binding-vegetation[J]. Journal of Lanzhou University (Natural Sciences), 56(4): 463-470. | |
| [26] | 刘铮瑶, 董治宝, 赵杰, 等, 2020. 人工固沙措施对沙丘沉积物特征及土壤养分的影响[J]. 生态学报, 40(4): 1383-1391. |
| LIU Z Y, DONG Z B, ZHAO J, et al., 2020. Effects of artificial sand fixation on sediment characteristics and soil nutrients[J]. Acta Ecologica Sinica, 40(4): 1383-1391. | |
| [27] |
麻云霞, 王月林, 李钢铁, 等, 2019. 生物地毯治沙工程——生物结皮现状的研究进展[J]. 草地学报, 27(3): 531-538.
DOI |
| MA Y X, WANG Y L, LI G T, et al., 2019. Research progress on the status of biological crust-a kind of biological carpet sand control engineering[J]. Acta Agrestia Sinica, 27(3): 531-538. | |
| [28] |
庞景文, 卜崇峰, 郭琦, 等, 2022. 毛乌素沙地区域尺度生物结皮有机碳空间分布特征及其影响因素[J]. 应用生态学报, 33(7): 1755-1763.
DOI |
| PANG J W, BU C F, GUO Q, et al., 2022. Spatial distribution and the influencing factors of organic carbon of biological crusts on a regional scale in Mu Us sandy land, China[J]. Chinese Journal of Applied Ecology, 33(7): 1755-1763. | |
| [29] |
孙英君, 王劲峰, 柏延臣, 2004. 地统计学方法进展研究[J]. 地球科学进展, 19(2): 268-274.
DOI |
|
SUN Y J, WANG J F, BAI Y C, 2004. Study on progress of methods in geostatistics[J]. Advances in Earth Science, 19(2): 268-274.
DOI |
|
| [30] | 王雪芹, 张元明, 张伟民, 等, 2004. 古尔班通古特沙漠生物结皮对地表风蚀作用影响的风洞实验[J]. 冰川冻土, 26(5): 632-638. |
| WANG X Q, ZHAMG Y M, ZHANG W M, et al., 2004. Wind tunnel experiment of biological crust effect on wind erodibility of sand surface in Gurbantunggut Desert, Xinjiang[J]. Journal of Glaciology and Geocryology, 26(5): 632-638. | |
| [31] | 吴楠, 张元明, 王红玲, 等, 2007. 古尔班通古特沙漠生物结皮固氮活性[J]. 生态学报, 27(9): 3785-3793. |
| WU N, ZHANG Y M, WANG H L, et al., 2007. On the nitrogen fixation by biological soil crusts in the Gurbantunggut Desert, northern Xinjiang of China[J]. Acta Ecologica Sinica, 27(9): 3785-3793. | |
| [32] | 谢正丰, 王冬梅, 张鹏, 等, 2022. 黄土高寒区小流域土壤水分空间变异与环境影响因子[J]. 水土保持学报, 36(4): 196-203. |
| XIE Z F, WANG D M, ZHANG P, et al., 2022. Spatial variation of soil moisture and its environmental influencing factors in a small watershed in the Loess Alpine Region[J]. Journal of Soil and Water Conservation, 36(4): 196-203. | |
| [33] | 闫德仁, 黄海广, 张胜男, 等, 2018. 沙漠苔藓生物结皮层养分及颗粒组成特征[J]. 干旱区资源与环境, 32(10): 111-116. |
| YAN D R, HUANG H G, ZHANG S N, et al., 2018. Nutrients and particle composition characteristics in moss biological crusts[J]. Journal of Arid Land Resources and Environment, 32(10): 111-116. | |
| [34] | 闫德仁, 张胜男, 闫婷, 2019. 苔藓结皮层土壤矿质元素含量变化特征[J]. 干旱区资源与环境, 33(10): 145-149. |
| YAN D R, ZHANG S N, YAN T, et al., 2019. Variety characteristics of total soil minerals in mossy biological crusts[J]. Journal of Arid Land Resources and Environment, 33(10): 145-149. | |
| [35] | 杨贵森, 吕星宇, 虎瑞, 等, 2022. 腾格里沙漠固沙植被区微生境土壤微生物功能群时空格局[J]. 土壤学报, 59(2): 580-590. |
| YANG G S, LÜ X Y, HU R, et al., 2022. Spatial and temporal patterns of soil microbial functional groups in different microhabitats in sand-fixing revegetation area in the Tengger Desert[J]. Acta Pedologica Sinica, 59(2): 580-590. | |
| [36] |
杨静涵, 刘梦云, 张杰, 等, 2020. 黄土高原沟壑区小流域土壤养分空间变异特征及其影响因素[J]. 自然资源学报, 35(3): 743-754.
DOI |
|
YANG J H, LIU M Y, ZHANG J, et al., 2020. Spatial variability of soil nutrients and its affecting factors at small watershed in gully region of the Loess Plateau[J]. Journal of Natural Resources, 35(3): 743-754.
DOI URL |
|
| [37] |
杨巧云, 赵允格, 包天莉, 等, 2019. 黄土丘陵区不同类型生物结皮下的土壤生态化学计量特征[J]. 应用生态学报, 30(8): 2699-2706.
DOI |
| YANG Q Y, ZHAO Y G, BAO T L, et al., 2019. Soil ecological stoichiometry characteristics under different types of biological soil crusts in the hilly Loess Plateau region, China[J]. Chinese Journal of Applied Ecology, 30(8): 2699-2706. | |
| [38] | 展秀丽, 董智今, 韩磊, 2021. 宁夏盐池县防沙治沙区土壤粒度、SOC及TN的空间异质性[J]. 东北林业大学学报, 49(1): 101-105, 124. |
| ZHAN X L, DONG Z J, HAN L, 2021. Spatial Heterogeneity of Grain Size, SOC and TN in Areas of Desertification Combating of Yanchi in Ningxia[J]. Journal of Northeast Forestry University, 49(1): 101-105, 124. | |
| [39] | 张冠华, 胡甲均, 2019. 生物结皮土壤-水文-侵蚀效应研究进展[J]. 水土保持学报, 33(1): 1-8. |
| ZHANG G H, HU J J, 2019. Advances in soil-hydrology-erosion effects of biological soil crusts[J]. Journal of Soil and Water Conservation, 33(1): 1-8. | |
| [40] | 张健, 徐明, 邹晓, 等, 2019. 不同土壤和植被生境下生物结皮对土壤性质的影响[J]. 水土保持学报, 33(5): 323-328. |
| ZHANG J, XU M, ZOU X, et al., 2019. Effects of biological crusts on soil properties under different soil and vegetation habitats[J]. Journal of Soil and Water Conservation, 33(5): 323-328. | |
| [41] | 张元明, 王雪芹, 2010. 荒漠地表生物土壤结皮形成与演替特征概述[J]. 生态学报, 30(16): 4484-4492. |
| ZHANG Y M, WANG X Q, 2010. Summary on formation and developmental characteristics of biological soil crusts in desert areas[J]. Acta Ecologica Sinica, 30(16): 4484-4492. | |
| [42] |
张宇鹏, 吴笑天, 李希来, 等, 2022. 黄河源流域单元退化高寒草甸空间分布及其对土壤理化性质的响应[J]. 草地学报, 30(3): 503-512.
DOI |
| ZHANG Y P, WU X T, LI X L, et al., 2022. Responses and distributions of degraded alpine meadow on the physical and chemical properties of soil in river basin units in the source region of Yellow River[J]. Acta Agrestia Sinica, 30(3): 503-512. | |
| [43] |
周晓兵, 张丙昌, 张元明, 2021. 生物土壤结皮固沙理论与实践[J]. 中国沙漠, 41(1): 164-173.
DOI |
|
ZHOU X B, ZHANG B C, ZHANG Y M, 2021. The theory and practices of biological soil crust rehabilitation[J]. Journal of Desert Research, 41(1): 164-173.
DOI |
| [1] | 潘昱伶, 璩向宁, 李琴, 王磊, 王筱平, 谭鹏, 崔庚, 安雨, 佟守正. 黄河宁夏段典型滩涂湿地土壤理化因子空间分布特征及其对微地形的响应[J]. 生态环境学报, 2023, 32(4): 668-677. |
| [2] | 张贝儿, 吴建强, 王敏, 熊丽君, 谭娟, 沈城, 黄波涛, 黄沈发. 耕地生态保育工程的土壤健康度评价方法初探[J]. 生态环境学报, 2023, 32(2): 388-396. |
| [3] | 夏恩龙, 农珺清, 魏松坡, 刘希珍, 刘广路. 毛竹向阔叶林扩展过程中土壤养分变化特征[J]. 生态环境学报, 2022, 31(6): 1110-1117. |
| [4] | 龙靖, 黄耀, 刘占锋, 简曙光, 魏丽萍, 王俊. 西沙热带珊瑚岛典型乔木叶片性状和养分再吸收特征[J]. 生态环境学报, 2022, 31(2): 248-256. |
| [5] | 余斐, 叶彩红, 许窕孜, 张中瑞, 朱航勇, 张耕, 华雷, 邓鉴锋, 丁晓纲. 韶关市花岗岩地区森林土壤重金属污染评价[J]. 生态环境学报, 2022, 31(2): 354-362. |
| [6] | 盛基峰, 李垚, 于美佳, 韩艳英, 叶彦辉. 氮磷添加对高寒草地土壤养分和相关酶活性的影响[J]. 生态环境学报, 2022, 31(12): 2302-2309. |
| [7] | 张晓丽, 王国丽, 常芳弟, 张宏媛, 逄焕成, 张建丽, 王婧, 冀宏杰, 李玉义. 生物菌剂对根际盐碱土壤理化性质和微生物区系的影响[J]. 生态环境学报, 2022, 31(10): 1984-1992. |
| [8] | 宋贤冲, 蔡雪梅, 陈韬, 潘文, 石媛媛, 唐健, 曹继钊. 不同萌芽代次桉树根际和非根际土壤养分的变化特征[J]. 生态环境学报, 2021, 30(9): 1814-1820. |
| [9] | 许冬雪, 李兴, 王勇, 勾芒芒. 冰封期乌梁素海不同形态氮、磷和叶绿素a的空间分布特征及其响应关系[J]. 生态环境学报, 2021, 30(9): 1855-1864. |
| [10] | 李海萍, 李光一, 万华伟, 李利平. 基于矩阵分析法的鸟类与哺乳动物物种丰富度空间差异研究——以新疆为例[J]. 生态环境学报, 2021, 30(7): 1333-1341. |
| [11] | 廖迎春, 段洪浪, 施星星, 孟庆银, 刘文飞, 沈芳芳, 樊后保, 朱涛. 杉木(Cunninghamia lanceolate)人工林生长状况与根系生物量相关性研究[J]. 生态环境学报, 2021, 30(6): 1121-1128. |
| [12] | 郝丽虹, 刘桂青, 张世晨, 苗宇萍. 城市加油站场地典型有机污染物空间分布特征[J]. 生态环境学报, 2021, 30(11): 2175-2184. |
| [13] | 徐文印, 张宇鹏, 段成伟, 柴瑜, 宋娴, 李希来. 黄河源不同区域退化高寒草甸土壤养分空间变异研究[J]. 生态环境学报, 2021, 30(10): 1968-1975. |
| [14] | 隋阳辉, 高继平, 王延波, 肖万欣, 刘晶, 史磊, 赵海岩, 张洋. 氮肥配施生物炭对旱地土壤养分和玉米根系径级分布的影响[J]. 生态环境学报, 2021, 30(10): 2026-2032. |
| [15] | 张子璇, 牛蓓蓓, 李新举. 不同改良模式对滨海盐渍土土壤理化性质的影响[J]. 生态环境学报, 2020, 29(2): 275-284. |
| 阅读次数 | ||||||
|
全文 |
|
|||||
|
摘要 |
|
|||||