生态环境学报 ›› 2021, Vol. 30 ›› Issue (5): 984-994.DOI: 10.16258/j.cnki.1674-5906.2021.05.011
洪莹莹1( ), 陈辰2, 保鸿燕3, 沈劲4,*()
收稿日期:2020-12-19
出版日期:2021-05-18
发布日期:2021-08-06
通讯作者:
* 沈劲(1985年生),男,高级工程师,硕士,从事大气污染与大气质量模型。E-mail:15120092912@163.com作者简介:洪莹莹(1990年生),女,工程师,硕士,从事空气质量数值模拟研究。E-mail:hongyy3@mail2.sysu.edu.cn
基金资助:
HONG Yingying1(), CHEN Chen2, BAO Hongyan3, SHEN Jin4,*()
Received:2020-12-19
Online:2021-05-18
Published:2021-08-06
摘要:
随着近年臭氧污染程度的加剧,珠三角春季也出现了较严重的大范围臭氧污染事件。然而,目前对于春季臭氧污染的研究仍较少,深入分析研究春季臭氧污染的气象条件、污染成因及其来源对于臭氧污染防治具有重大的现实意义。2017年4月珠三角西南部出现了多次臭氧中度以上污染,该研究以此为例分析了该时段气象条件与臭氧质量浓度的相关关系,利用HYSPLIT轨迹模型分析西南部地区臭氧污染的气团来源,使用WRF/CAMx模型定量分析了珠三角西南部春季臭氧来源与臭氧生成敏感性。结果表明,春季臭氧质量浓度随日照时长和气温日较差的增加而增加,随相对湿度的增加而减少。当局地风向为偏东时,珠三角西南部臭氧污染最严重。东北和偏东路径的气团输送对高质量浓度臭氧有重要贡献,春季白天天然源的贡献为12%—13%,工业源的贡献为15%—18%,交通源的贡献约为10%。除去背景臭氧后,广州和佛山等珠三角中部城市对江门、中山和珠海的臭氧贡献分别为30%、27%和20%,东莞、惠州和深圳等珠三角东部城市对珠海东面站点的臭氧贡献约为27%,但对珠海西部站点的臭氧贡献仅约为10%。粤北地区的前体物排放对江门和中山的臭氧也有超过10%的贡献,珠三角西南部本地的贡献相对较少,这说明臭氧的区域输送特征明显,每个城市排放的污染物主要影响其下风向的城市。臭氧生成敏感性分析结果表明,春季珠三角西南部臭氧主要在VOCs敏感区中生成。综上,春季臭氧污染治理宜从区域VOCs联防联控的角度进行治理。
中图分类号:
洪莹莹, 陈辰, 保鸿燕, 沈劲. 珠三角西南部春季臭氧来源与敏感性分析[J]. 生态环境学报, 2021, 30(5): 984-994.
HONG Yingying, CHEN Chen, BAO Hongyan, SHEN Jin. Sources and Sensitivity Analysis of Ozone in Spring Over the Southwestern Part of Pearl River Delta Region[J]. Ecology and Environment, 2021, 30(5): 984-994.
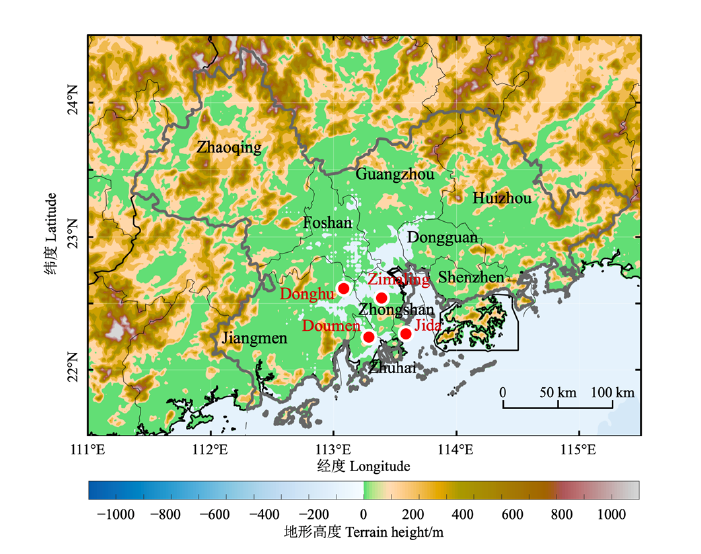
图1 代表性观测站点位置
Fig. 1 Locations of the representative monitoring stations
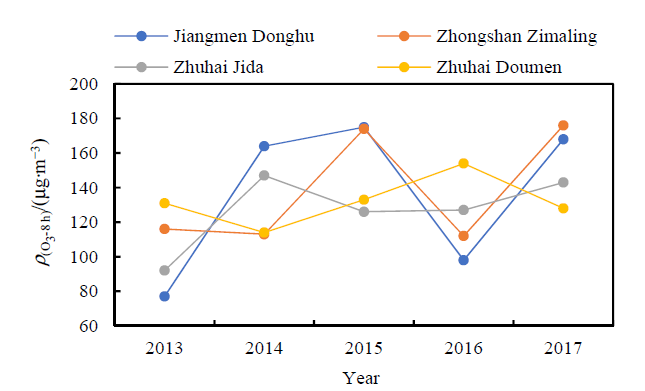
图2 2013—2017年珠三角西南部城市观测站点4月O3-8 h质量浓度第90百分位数月均值变化图
Fig. 2 Variations of the 90th percentile of O3-8 h mass concentrations in April at monitoring sites in southwestern cities of Pearl River Delta from 2013 to 2017
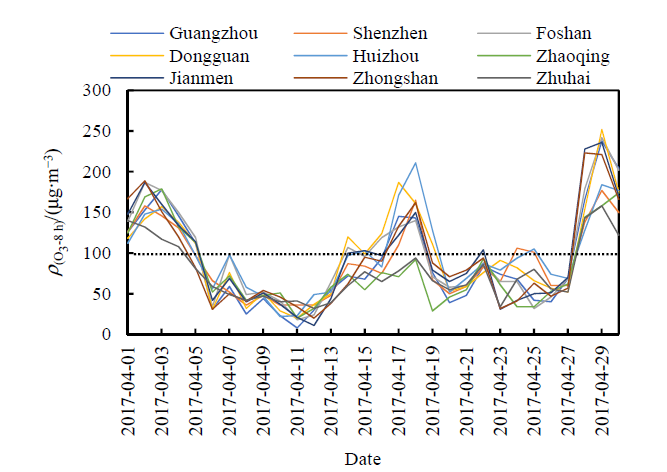
图3 2017年4月珠三角9城市O3-8 h质量浓度变化图
Fig. 3 Variations of O3-8 h mass concentrations in 9 cities of Pearl River Delta in April of 2017
| O3-8 h质量浓度 O3-8 h mass concentration | 日照时数 Sunshine duration | 相对湿度 Relative humidity | 气温日较差 Daily temperature difference |
|---|---|---|---|
| 江门东湖 Jiangmen Donghu | 0.761 | -0.727 | 0.747 |
| 中山紫马岭 Zhongshan Zimaling | 0.819 | -0.731 | 0.746 |
| 珠海吉大 Zhuhai Jida | 0.727 | -0.706 | 0.471 |
| 珠海斗门 Zhuhai Doumen | 0.634 | -0.776 | 0.768 |
表1 2017年4月逐日O3-8 h质量浓度与气象要素之间的相关系数
Table 1 Correlation coefficients between daily O3-8 h mass concentrations and meteorological factors in April of 2017
| O3-8 h质量浓度 O3-8 h mass concentration | 日照时数 Sunshine duration | 相对湿度 Relative humidity | 气温日较差 Daily temperature difference |
|---|---|---|---|
| 江门东湖 Jiangmen Donghu | 0.761 | -0.727 | 0.747 |
| 中山紫马岭 Zhongshan Zimaling | 0.819 | -0.731 | 0.746 |
| 珠海吉大 Zhuhai Jida | 0.727 | -0.706 | 0.471 |
| 珠海斗门 Zhuhai Doumen | 0.634 | -0.776 | 0.768 |
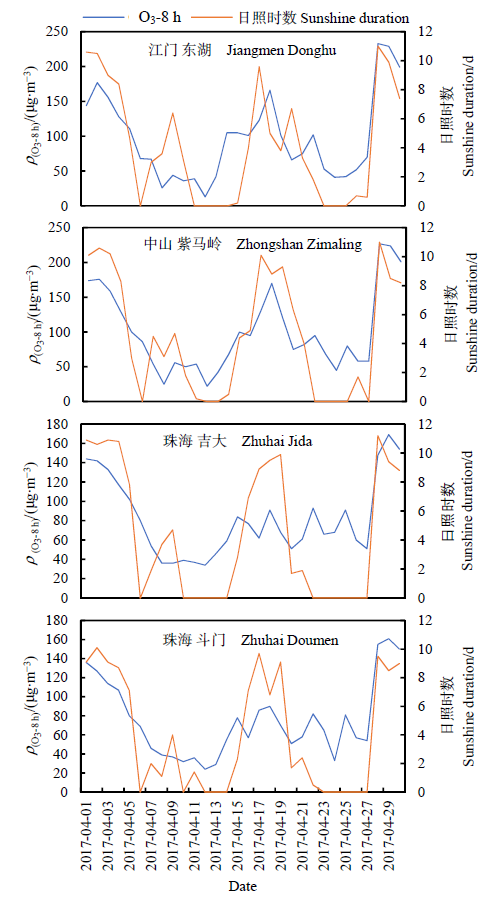
图4 代表性点位4月逐日O3-8 h质量浓度与日照时数变化趋势
Fig. 4 Daily variations of O3-8 h concentrations and sunshine duration in April at the representative stations
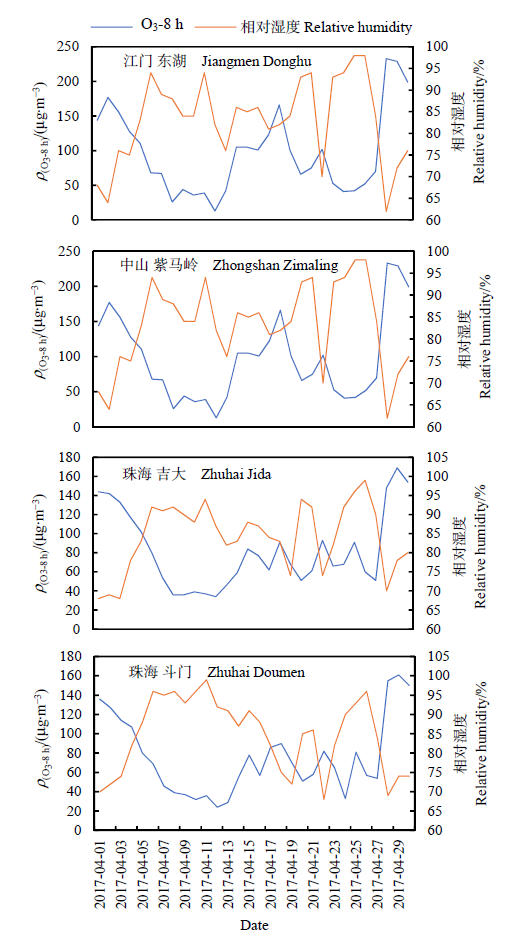
图5 代表性点位4月逐日O3-8 h质量浓度与相对湿度变化趋势
Fig. 5 Daily variations of O3-8 h concentrations and relative humidity in April at the representative stations
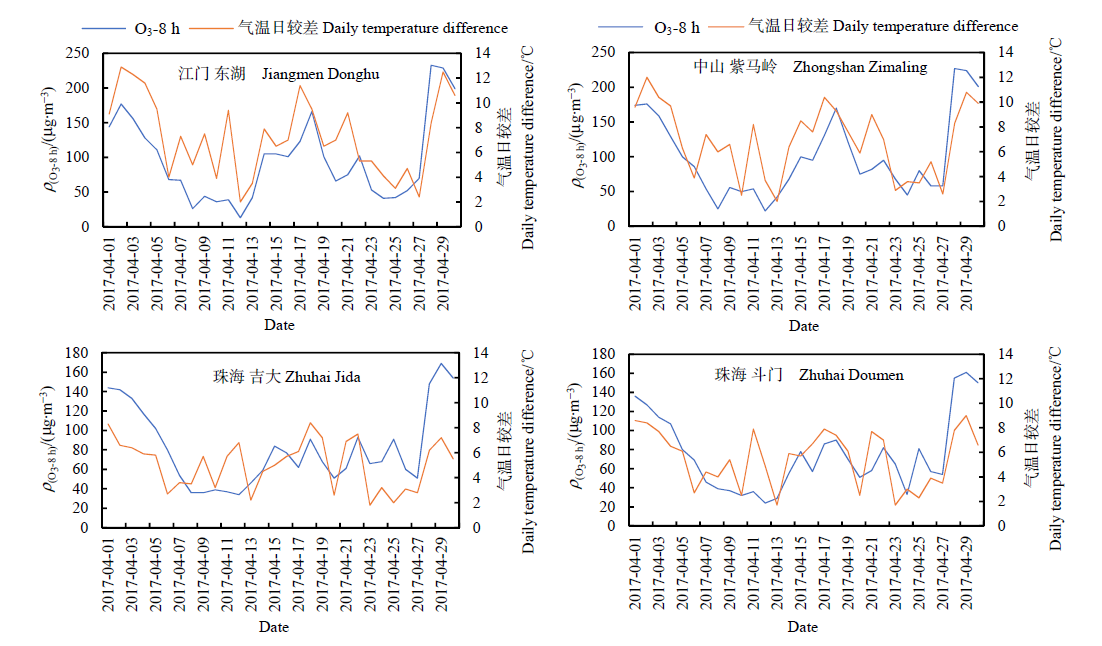
图6 代表性点位4月逐日O3-8 h质量浓度与气温日较差变化趋势
Fig. 6 Daily variations of O3-8 h concentrations and daily temperature difference in April at the representative stations

图7 2017年4月代表性站点O3质量浓度风玫瑰图径向代表风速,颜色代表出现该风向风速时的O3质量浓度
Fig. 7 Wind rose map for O3 mass concentrations at the representative stations in April of 2017The Radius represents the wind speeds, and the color represents the O3 mass concentration at the wind speed and direction
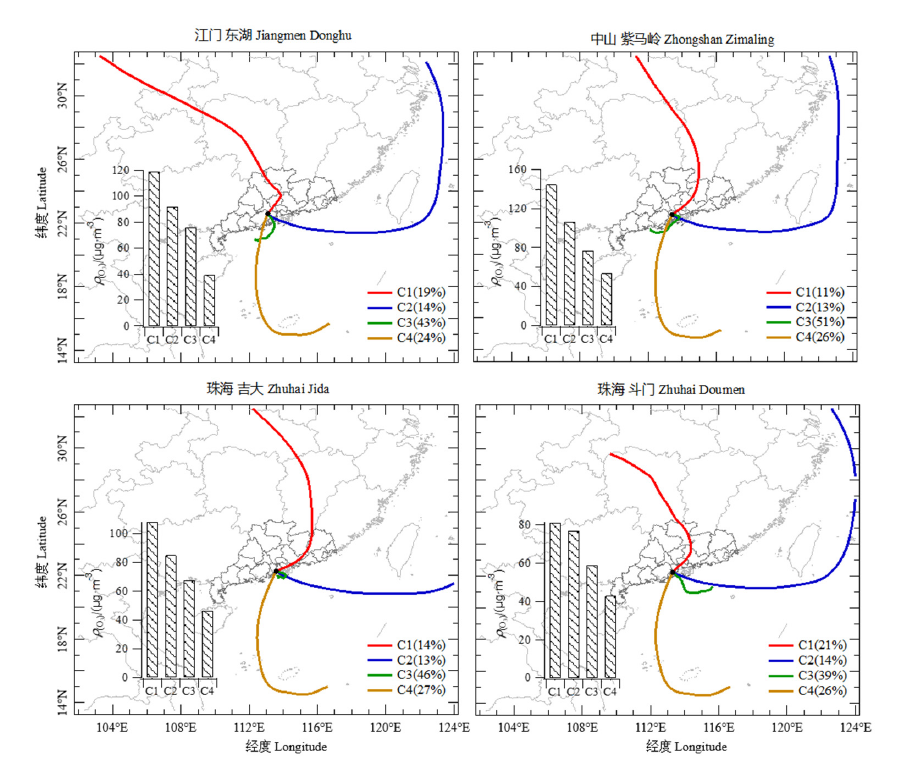
图8 代表性点位4月白天段(08:00—20:00)72 h后向轨迹逐时聚类分析结果图中柱状图表示每条轨迹臭氧的平均质量浓度
Fig. 8 Hourly cluster analysis results of the 72-h backward trajectory during the daytime (08:00-20:00) at the representative stations in AprilThe bar graphs in the figures represent the average O3 mass concentrations for each trajectory

图9 代表性点位实测臭氧质量浓度与模拟值对比
Fig. 9 Comparison of the observed and simulated O3 concentrations at the representative stations
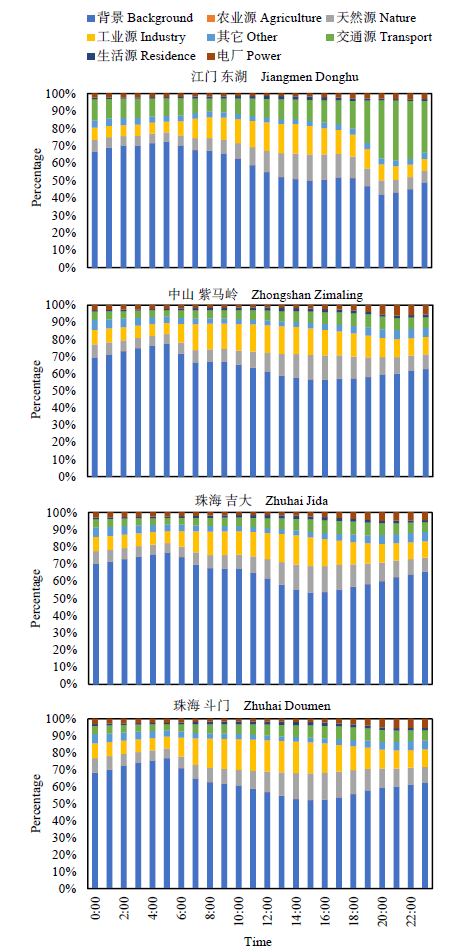
图10 代表性点位臭氧的行业来源
Fig. 10 Industrial sources of O3 at the representative stations
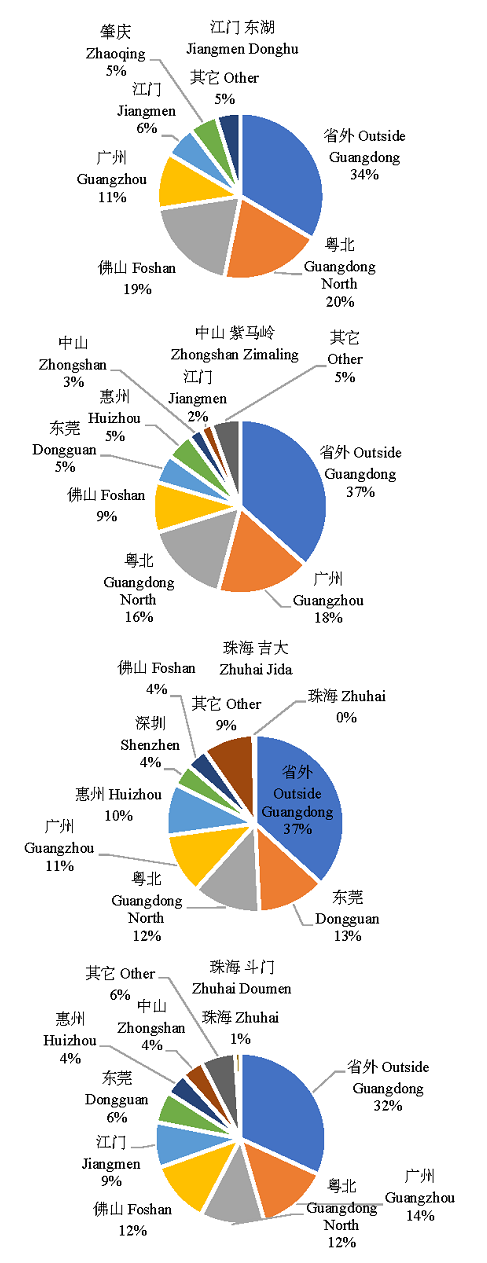
图11 代表性点位臭氧白天的区域来源
Fig. 11 Regional sources of O3 at the representative stations during the daytime
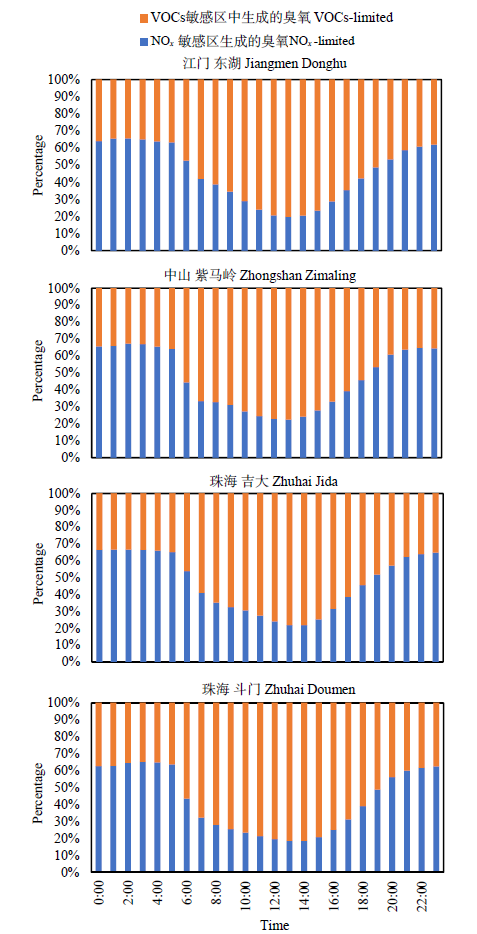
图12 代表性点位臭氧生成敏感性
Fig. 12 Sensitivity of O3 formation at the representative stations
| [1] |
BAO J Z, YANG X P, ZHAO Z Y, et al., 2015. The spatial-temporal characteristics of air pollution in China from 2001-2014 [J]. International Journal of Environmental Research and Public Health, 12(12): 15875-15887.
DOI URL |
| [2] |
BU Q L, HONG Y Y, TAN H B, et al., 2021. The Modulation of Meteorological Parameters on Surface PM2.5 and O3 Concentrations in Guangzhou, China[J]. Aerosol and Air Quality Research, DOI:10.4209/aaqr.2020.03.0084.
DOI |
| [3] |
CHEN L, RABITZ H, CONSIDINE D B, et al., 1997. Chemical reaction rate sensitivity and uncertainty in a two-dimensional middle atmospheric ozone model[J]. Journal of Geophysical Research: Atmospheres, 102(D13): 16201-16214.
DOI URL |
| [4] |
CIARELLI G, AKSOYOGLU S, EL HADDAD I, et al., 2017. Modelling winter organic aerosol at the European scale with CAMx: evaluation and source apportionment with a VBS parameterization based on novel wood burning smog chamber experiments[J]. Atmospheric Chemistry and Physics, 17(12): 1-34.
DOI URL |
| [5] |
COLLET S, MINOURA H, KIDOKORO T, et al., 2014. Future year ozone source attribution modeling studies for the eastern and western United States[J]. Journal of the Air and Waste Management Association, 64(10): 1174-1185.
DOI URL |
| [6] |
GAO D, XIE M, CHEN X, et al., 2019. Modeling the effects of climate change on surface ozone during summer in the Yangtze River Delta region, China[J]. International Journal of Environmental Research and Public Health, DOI:10.3390/ijerph16091528.
DOI |
| [7] |
HE J J, GONG S L, YU Y, et al., 2017. Air pollution characteristics and their relation to meteorological conditions during 2014-2015 in major Chinese cities [J]. Environmental pollution, 223: 484-496.
DOI URL |
| [8] | HONG S Y, KIM J H, LIM J O, et al., 2006. The WRF single moment microphysics scheme (WSM)[J]. Journal of the Korean Meteorological Society, 42: 129-151. |
| [9] |
HOSSEIN S, SAJJAD K, VAHID H, et al., 2018. A novel regression imputation framework for Tehran air pollution monitoring network using outputs from WRF and CAMx models[J]. Atmospheric Environment, 187: 24-33.
DOI URL |
| [10] |
HU J, LI Y C, ZHAO T L, et al., 2018. An important mechanism of regional O3 transport for summer smog over the Yangtze River Delta in eastern China[J]. Atmospheric Chemistry and Physics, 18(22): 16239-16251.
DOI URL |
| [11] |
JIANG Y C, ZHAO T L, LIU J, et al., 2015. Why does surface ozone peak before a typhoon landing in southeast China?[J]. Atmospheric Chemistry and Physics, 15(23): 13331-13338.
DOI URL |
| [12] |
KE L, JACOB D, LIAO H, et al., 2019. Anthropogenic drivers of 2013-2017 trends in summer surface ozone in China [J]. Proceedings of the National Academy of Sciences, 116(2): 422-427.
DOI URL |
| [13] |
KUROKAWA J, OHARA T, MORIKAWA T, et al.2013. Emissions of air pollutants and greenhouse gases over Asian regions during 2000-2008: Regional Emission inventory in ASia (REAS) version 2 [J]. Atmospheric Chemistry and Physics, 13(21): 11019-11058.
DOI URL |
| [14] |
LIU N W, LIN W L, MA J Z, et al., 2018. Seasonal variation in surface ozone and its regional characteristics at global atmosphere watch stations in China[J]. Journal of Environmental Sciences, 77: 291-302.
DOI URL |
| [15] |
LIU Y H, WANG H L, JING S G, et al., 2019. Characteristics and sources of volatile organic compounds (VOCs) in Shanghai during summer: Implications of regional transport[J]. Atmospheric Environment, 215: 116902.
DOI URL |
| [16] |
LU K D, FUCHS H, HOFZUMAHAUS A, et al., 2019. Fast photochemistry in wintertime haze: Consequences for pollution mitigation strategies[J]. Environmental Science and Technology, 53(18): 10676-10684.
DOI URL |
| [17] |
LU K D, ROHRER F, HOLLAND F, et al., 2012. Observation and modelling of OH and HO2 concentrations in the Pearl River Delta 2006: A missing OH source in a VOC rich atmosphere[J]. Atmospheric Chemistry and Physics, 12(3): 1541-1569.
DOI URL |
| [18] |
MCGOWAN H, CLARK A, 2008. Identification of dust transport pathways from Lake Eyre, Australia using Hysplit[J]. Atmospheric Environment, 42(29): 6915-6925.
DOI URL |
| [19] | OU J M, ZHENG J Y, LI R R, et al.2015. Speciated OVOC and VOC emission inventories and their implications for reactivity-based ozone control strategy in the Pearl River Delta region, China[J]. Science of the Total Environment, 530-531: 393-402. |
| [20] |
SHU L, XIE M, WANG T J, et al., 2016. Integrated studies of a regional ozone pollution synthetically affected by subtropical high and typhoon system in the Yangtze River Delta region, China[J]. Atmospheric Chemistry and Physics, 16(24): 15801-15819.
DOI URL |
| [21] |
SINGH A A, AGRAWAL S B, 2017. Tropospheric ozone pollution in India: effects on crop yield and product quality[J]. Environmental Science and Pollution Research, 24(5): 4367-4382.
DOI URL |
| [22] |
SONG C B, WU L, XIE Y C, et al., 2017. Air pollution in China: Status and spatiotemporal variations[J]. Environmental Pollution, 227: 334-347.
DOI URL |
| [23] |
SONG M D, LIU X G, ZHANG Y H, et al., 2019. Sources and abatement mechanisms of VOCs in southern China[J]. Atmospheric Environment, 201: 28-40.
DOI URL |
| [24] |
TANAKA S, 2015. Environmental regulations on air pollution in China and their impact on infant mortality[J]. Journal of Health Economics, 42: 90-103.
DOI URL |
| [25] |
TELESNICKI M C, MARTÍNEZ-GHERSA M A, GHERSA C M, 2018. Plant oxidative status under ozone pollution as predictor for aphid population growth: The case of Metopolophium dirhodum (Hemiptera: Aphididae) in Triticum aestivum (Poales: Poaceae)[J]. Biochemical Systematics and Ecology, 77: 51-56.
DOI URL |
| [26] |
WANG M, QIN W, CHEN W T, et al., 2020. Seasonal variability of VOCs in Nanjing, Yangtze River Delta: Implications for emission sources and photochemistry[J]. Atmospheric Environment, DOI:10.1016/j. atmosenv. 2019.117254.
DOI |
| [27] |
WANG N, LYU X P, DENG X J, et al., 2019. Aggravating O3 pollution due to NOx emission control in eastern China[J]. Science of the Total Environment, 677: 732-744.
DOI URL |
| [28] |
WANG T, XUE L K, BRIMBLECOMBE P, et al., 2017. Ozone pollution in China: A review of concentrations, meteorological influences, chemical precursors, and effects[J]. Science of the Total Environment, 575: 1582-1596.
DOI URL |
| [29] |
WU J, XU Y, ZHANG B, 2015. Projection of PM2.5 and Ozone Concentration Changes over the Jing-Jin-Ji Region in China[J]. Atmospheric and Oceanic Science Letters, 8(3): 143-146.
DOI URL |
| [30] |
XIE Y, DAI H C, ZHANG Y X, et al., 2019. Comparison of health and economic impacts of PM2.5 and ozone pollution in China[J]. Environment International, 130: 104881.
DOI URL |
| [31] |
ZHANG Q, ZHENG Y X, TONG D, et al., 2019. Drivers of improved PM2.5 air quality in China from 2013 to 2017 [J]. Proceedings of the National Academy of Sciences, 116(49): 24463-24469.
DOI URL |
| [32] |
ZHANG Y H, SU H, ZHONG L J, et al., 2008. Regional ozone pollution and observation-based approach for analyzing ozone-precursor relationship during the PRIDE-PRD2004 campaign[J]. Atmospheric Environment, 42(25): 6203-6218.
DOI URL |
| [33] |
ZHANG Y N, XIANG Y R, CHAN L Y, et al., 2011. Procuring the regional urbanization and industrialization effect on ozone pollution in Pearl River Delta of Guangdong, China[J]. Atmospheric Environment, 45(28): 4898-4906.
DOI URL |
| [34] |
ZHAO W, FAN S J, GUO H, et al., 2016. Assessing the impact of local meteorological variables on surface ozone in Hong Kong during 2000-2015 using quantile and multiple line regression models [J]. Atmospheric Environment, 144: 182-193.
DOI URL |
| [35] |
ZHONG Z M, ZHENG J Y, ZHU M N, et al., 2018. Recent developments of anthropogenic air pollutant emission inventories in Guangdong province, China[J]. Science of the Total Environment, 627: 1080-1092.
DOI URL |
| [36] | 洪莹莹, 翁佳烽, 谭浩波, 等, 2021. 珠江三角洲秋季典型O3污染的气象条件及贡献量化[J]. 中国环境科学, 41(1): 1-10. |
| HONG Y Y, WENG J F, TAN H B, et al., 2021. Meteorological conditions and contribution quantification of typical ozone pollution during autumn in Pearl River Delta[J]. China Environmental Science, 41(1): 1-10. | |
| [37] | 沈劲, 陈多宏, 汪宇, 等, 2018. 基于情景分析的珠三角臭氧与前体物排放关系研究[J]. 生态环境学报, 27(10): 1925-1932. |
| SHEN J, CHEN D H, WANG Y, et al., 2018. Study on the relationship between ozone and precursors emission in the Pearl River Delta based on scenario analysis[J]. Ecology and Environmental Sciences, 27(10): 1925-1932. | |
| [38] | 沈劲, 何灵, 程鹏, 等, 2019. 珠三角北部背景站臭氧浓度变化特征[J]. 生态环境学报, 28(10): 2006-2011. |
| SHEN J, HE L, CHENG P, et al., 2019. Characteristics of ozone concentration variation in the northern background site of the Pearl River Delta[J]. Ecology and Environmental Sciences, 28(10): 2006-2011. | |
| [39] | 岳海燕, 顾桃峰, 王春林, 等, 2018. 台风“妮妲”过程对广州臭氧浓度的影响分析[J]. 环境科学学报, 38(12): 4565-4572. |
| YUE H Y, GU T F, WANG C L, et al., 2018. Influence of typhoon Nida process on ozone concentration in Guangzhou[J]. Acta Scientiae Circumstantiae, 38(12): 4565-4572. | |
| [40] | 张远航, 郑君瑜, 陈长虹, 等, 2020. 中国大气臭氧污染防治蓝皮书(2020年)[R]. 北京:中国环境科学学会臭氧污染控制专业委员会. |
| ZHANG Y H, ZHENG J Y, CHEN C H, et al., 2020. China blue book of atmospheric ozone pollution prevention and control (2020)[R]. Beijing:Professional Committee of Ozone Pollution Control, Chinese Society of Environmental Sciences. | |
| [41] | 郑君瑜, 张礼俊, 钟流举, 等, 2009. 珠江三角洲大气面源排放清单及空间分布特征[J]. 中国环境科学, 29(5): 455-460. |
| ZHENG J Y, ZHANG L J, ZHONG L J, et al., 2020. Area source emission inventory of air pollutant and its spatial distribution characteristics in Pearl River Delta[J]. China Environmental Science, 29(5): 455-460. |
| [1] | 闫学军, 郝赛梅, 张荣荣, 秦华, 高素莲, 王锋, 靳宪忠, 孙友敏, 张桂芹. 家居市场挥发性有机物排放成分谱及排放估算[J]. 生态环境学报, 2023, 32(6): 1070-1077. |
| [2] | 李传福, 朱桃川, 明玉飞, 杨宇轩, 高舒, 董智, 李永强, 焦树英. 有机肥与脱硫石膏对黄河三角洲盐碱地土壤团聚体及其有机碳组分的影响[J]. 生态环境学报, 2023, 32(5): 878-888. |
| [3] | 许肖云, 饶芝菡, 蒋红斌, 张巍, 陈超, 杨永安, 胡艳丽, 魏海川. 遂宁工业园区夏季VOCs污染特征及其对O3、SOA生成潜势研究[J]. 生态环境学报, 2023, 32(5): 956-968. |
| [4] | 张平江, 党国锋. 基于MCR模型与蚁群算法的洮河流域生态安全格局构建[J]. 生态环境学报, 2023, 32(3): 481-491. |
| [5] | 温丽容, 江明, 黄渤, 袁鸾, 周炎, 陆炜梅, 张莹, 刘明, 张力昀. 珠三角典型区域臭氧成因分析与VOCs来源解析——以中山为例[J]. 生态环境学报, 2023, 32(3): 500-513. |
| [6] | 符传博, 丹利, 佟金鹤, 陈红. 海口市区臭氧污染变化特征及潜在源区分析[J]. 生态环境学报, 2023, 32(2): 331-340. |
| [7] | 李海燕, 杨小琴, 简美鹏, 张晓然. 城市水体中微塑料的来源、赋存及其生态风险研究进展[J]. 生态环境学报, 2023, 32(2): 407-420. |
| [8] | 江明, 张子洋, 李婷婷, 林勃机, 张正恩, 廖彤, 袁鸾, 潘苏红, 李军, 张干. 基于氮同位素的珠三角典型地区大气PM2.5中NH4+来源解析[J]. 生态环境学报, 2022, 31(9): 1840-1848. |
| [9] | 樊珂宇, 高原, 赖子尼, 曾艳艺, 刘乾甫, 李海燕, 麦永湛, 杨婉玲, 魏敬欣, 孙金辉, 王超. 珠三角河网鱼类微塑料污染特征研究[J]. 生态环境学报, 2022, 31(8): 1590-1598. |
| [10] | 梁俊芬, 蔡勋, 冯珊珊, 陶亮. 珠三角地区农业农村现代化发展程度评价及制约因子研究[J]. 生态环境学报, 2022, 31(8): 1680-1689. |
| [11] | 李程程, 张子蕤, 宋晓萱, 孔娟娟, 韩阳, 阮亚男. 臭氧胁迫对大豆抗氧化代谢与生殖生长的影响[J]. 生态环境学报, 2022, 31(7): 1383-1392. |
| [12] | 王超, 杨倩楠, 张池, 李祥东, 陈静, 张晓龙, 陈金洁, 刘科学. 东南湿润区典型丹霞地貌土壤有机碳组分及其敏感性研究[J]. 生态环境学报, 2022, 31(6): 1132-1140. |
| [13] | 陈丽娟, 周文君, 易艳芸, 宋清海, 张一平, 梁乃申, 鲁志云, 温韩东, MOHD Zeeshan, 沙丽清. 云南哀牢山亚热带常绿阔叶林土壤CH4通量特征[J]. 生态环境学报, 2022, 31(5): 949-960. |
| [14] | 陈雪泉, 孔彬, 兰青, 余志铨, 谢银斯, 黄俊毅. 胶黏剂生产行业VOCs组分特征及臭氧生成潜势分析[J]. 生态环境学报, 2022, 31(4): 750-758. |
| [15] | 李颖慧, 郭前进, 闫雨龙, 胡冬梅, 邓萌杰, 彭林. 晋城市环境空气中BTEX变化特征及来源[J]. 生态环境学报, 2022, 31(3): 504-511. |
| 阅读次数 | ||||||
|
全文 |
|
|||||
|
摘要 |
|
|||||