生态环境学报 ›› 2023, Vol. 32 ›› Issue (6): 1070-1077.DOI: 10.16258/j.cnki.1674-5906.2023.06.008
闫学军1( ), 郝赛梅2, 张荣荣1, 秦华1, 高素莲1, 王锋1, 靳宪忠3, 孙友敏2, 张桂芹2,*()
收稿日期:2022-05-12
出版日期:2023-06-18
发布日期:2023-09-01
通讯作者:
*张桂芹(1969年生),女,教授,博士,主要从事大气污染控制理论与技术研究。E-mail: zhangguiqin320@163.com作者简介:闫学军(1981年生),男,高级工程师,主要从事大气污染防治研究。E-mail: 15806663698@163.com
基金资助:
YAN Xuejun1(), HAO Saimei2, ZHANG Rongrong1, QIN Hua1, GAO Sulian1, WANG Feng1, JIN Xianzhong3, SUN Youmin2, ZHANG Guiqin2,*()
Received:2022-05-12
Online:2023-06-18
Published:2023-09-01
摘要:
城市中家居市场集聚区域由于家具陈列与仓储,是城市挥发性有机物(Volatile organic compounds,VOCs)无组织排放主要贡献源之一。对济南市区内家居市场及周边环境空气VOCs进行现场监测,分析了不同类型家居市场VOCs排放特征和成分谱,计算不同类型家居市场VOCs排放因子及排放量,并与周围环境空气中VOCs组分特征进行对比。结果表明,济南市低档家居市场D中VOCs质量浓度最高为653.00 μg·m-3,其次为中档家居市场C和B,高档家居市场A内VOCs质量浓度最低,为149.00 μg·m-3;市场内VOCs主要种类为OVOCs、芳香烃和卤代烃,低档家居市场D中芳香烃占比最高(39.05%),其他家居市场OVOCs占比最高;各家居市场臭氧生成潜势OFP从大到小依次为D>B>C>A,芳香烃OFP在家居市场占比最大;不同档次家居市场中VOCs组分种类有差异,低档家居市场VOCs组分种类最多,各家居市场均检出丙酮、甲苯和邻二甲苯,主要是受市场内胶合板类家具释放的影响,低档家居市场D中二氯甲烷质量浓度最高,为183.00 μg·m-3,中高档家居市场丙酮质量浓度均最高,为188.00 μg·m-3,与市场内实木家具和水溶性涂料的家具释放有关;对比家居市场与环境空气VOCs组分发现,家居市场和环境空气中甲苯和邻二甲苯质量浓度均较高,A和B市场邻二甲苯OFP分别是环境空气的9.08、36.33倍,家居市场中活性较大的芳香烃排放对室外环境空气影响较大;通过计算获得A、B、C和D家居市场VOCs排放因子分别为86.15、257.54、239.15、308.90 g·m-2,年排放量分别为3.45、2.74、3.59、2.47 t。研究成果可为进一步提出家居市场VOCs科学深入管控对策提供技术支撑。
中图分类号:
闫学军, 郝赛梅, 张荣荣, 秦华, 高素莲, 王锋, 靳宪忠, 孙友敏, 张桂芹. 家居市场挥发性有机物排放成分谱及排放估算[J]. 生态环境学报, 2023, 32(6): 1070-1077.
YAN Xuejun, HAO Saimei, ZHANG Rongrong, QIN Hua, GAO Sulian, WANG Feng, JIN Xianzhong, SUN Youmin, ZHANG Guiqin. Composition Spectrum and Emission Estimation of VOCs from Furniture Malls[J]. Ecology and Environment, 2023, 32(6): 1070-1077.
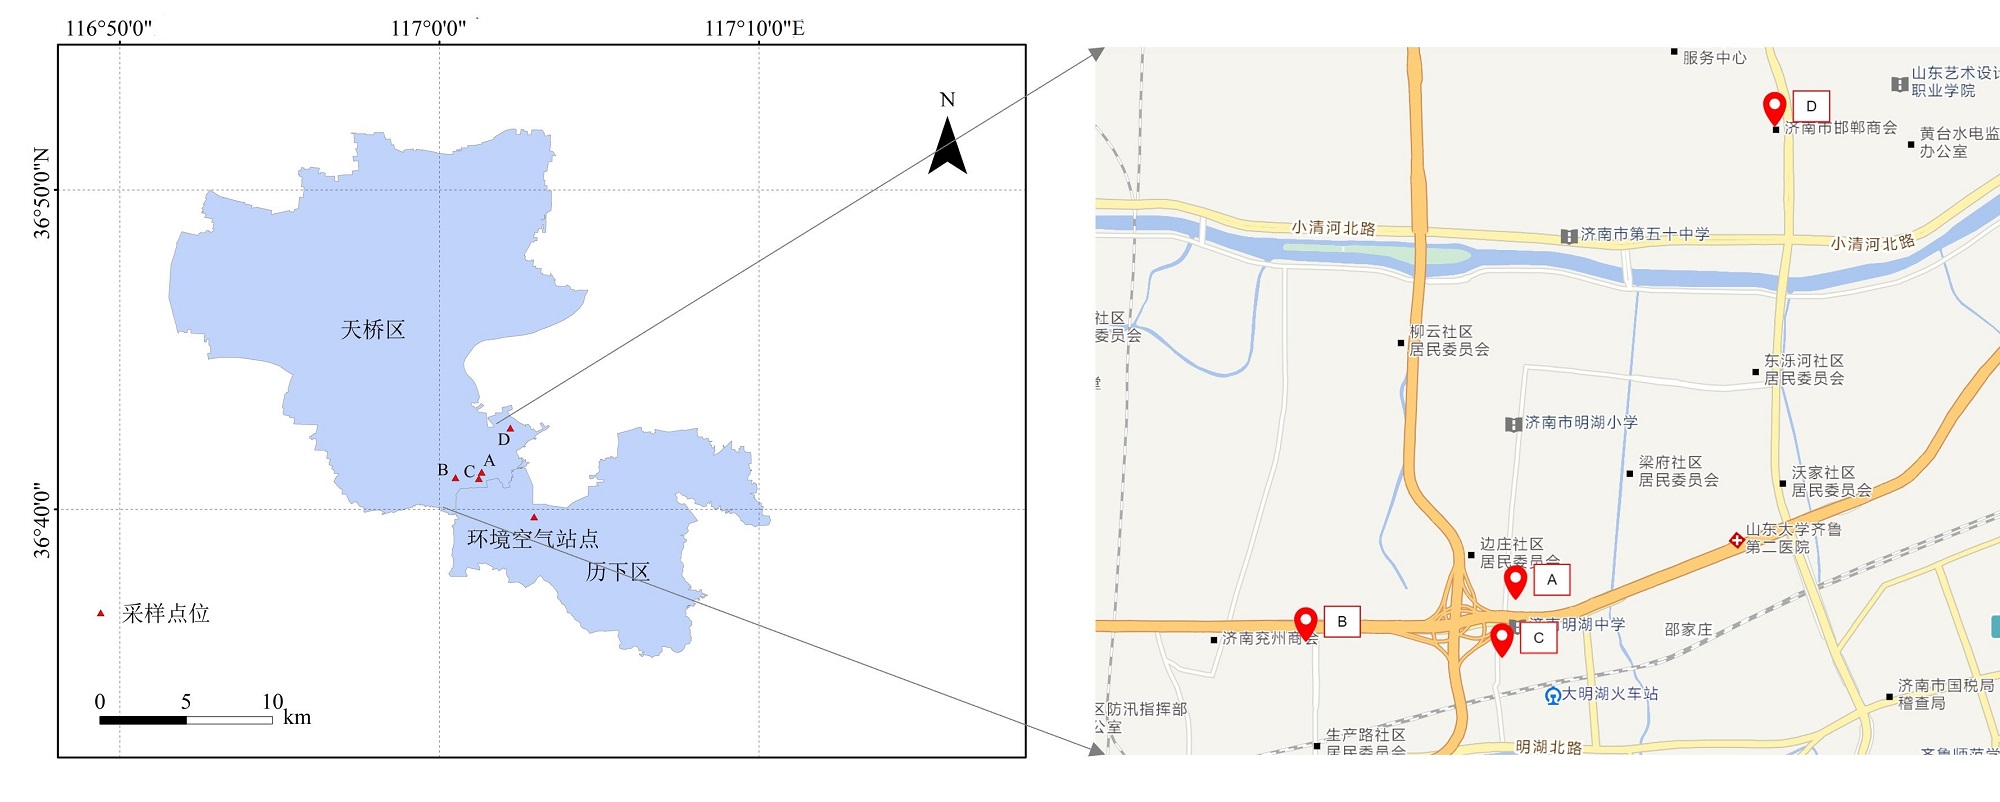
图1 采样点位分布图
Figure 1 Sampling point distribution
| 化合物名称 | 保留时间/ min | 化合物名称 | 保留时间/ min |
|---|---|---|---|
| 二氯二氟甲烷 | 0.777 | 1, 2-二氯丙烷 | 2.313 |
| 1, 2-二氯四氟乙烷 | 0.819 | 1, 4-二氧己环 | 2.400 |
| 氯乙烯 | 0.842 | 三氯乙烯 | 2.401 |
| 1, 3-丁二烯 | 0.858 | 甲基丙烯酸甲酯 | 2.453 |
| 溴甲烷 | 0.906 | 庚烷 | 2.475 |
| 乙醇 | 0.914 | 顺式-1, 3-二氯丙烯 | 2.764 |
| 异丙醇 | 0.921 | 甲基异丁酮 | 2.773 |
| 氯乙烷 | 0.93 | 反式-1, 3-二氯丙烯 | 3.023 |
| 丙烯醛 | 0.957 | 1, 1, 2-三氯乙烷 | 3.101 |
| 丙酮 | 0.981 | 甲苯 | 3.239 |
| 三氯氟甲烷 | 1.041 | 2-己酮 | 3.351 |
| 丙烯腈 | 1.088 | 1, 2-二溴乙烷 | 3.510 |
| 二氯甲烷 | 1.145 | 四氯乙烯 | 3.698 |
| 3-氯丙烯 | 1.181 | 氯苯 | 3.942 |
| 二硫化碳 | 1.196 | 乙基苯 | 4.081 |
| 1, 1, 2-三氟三氯乙烷 | 1.202 | 间/对-二甲基苯 | 4.142 |
| (E)-1, 2-二氯乙烯 | 1.286 | 1, 2-二甲基苯 | 4.258 |
| 1, 1-二氯乙烷 | 1.369 | 苯乙烯 | 4.265 |
| 2-丁酮 | 1.419 | 4-乙基甲苯 | 4.721 |
| (Z)-1, 2-二氯乙烯 | 1.551 | 1, 3, 5-三甲基苯 | 4.749 |
| 三氯甲烷 | 1.614 | 1, 2, 4-三甲基苯 | 4.886 |
| 四氢呋喃 | 1.723 | 1, 3-二氯苯 | 4.931 |
| 1, 2-二氯乙烷 | 1.814 | 1, 4-二氯苯 | 4.951 |
| 1, 1, 1-三氯乙烷 | 1.895 | 1, 2-二氯苯 | 5.074 |
| 苯 | 2.034 | 萘 | 5.688 |
| 四氯化碳 | 2.079 | 1, 2, 4-三氯苯 | 5.692 |
| 环己烷 | 2.086 | 六氯-1, 3-丁二烯 | 5.865 |
表1 物种保留时间表
Table 1 Species retention times
| 化合物名称 | 保留时间/ min | 化合物名称 | 保留时间/ min |
|---|---|---|---|
| 二氯二氟甲烷 | 0.777 | 1, 2-二氯丙烷 | 2.313 |
| 1, 2-二氯四氟乙烷 | 0.819 | 1, 4-二氧己环 | 2.400 |
| 氯乙烯 | 0.842 | 三氯乙烯 | 2.401 |
| 1, 3-丁二烯 | 0.858 | 甲基丙烯酸甲酯 | 2.453 |
| 溴甲烷 | 0.906 | 庚烷 | 2.475 |
| 乙醇 | 0.914 | 顺式-1, 3-二氯丙烯 | 2.764 |
| 异丙醇 | 0.921 | 甲基异丁酮 | 2.773 |
| 氯乙烷 | 0.93 | 反式-1, 3-二氯丙烯 | 3.023 |
| 丙烯醛 | 0.957 | 1, 1, 2-三氯乙烷 | 3.101 |
| 丙酮 | 0.981 | 甲苯 | 3.239 |
| 三氯氟甲烷 | 1.041 | 2-己酮 | 3.351 |
| 丙烯腈 | 1.088 | 1, 2-二溴乙烷 | 3.510 |
| 二氯甲烷 | 1.145 | 四氯乙烯 | 3.698 |
| 3-氯丙烯 | 1.181 | 氯苯 | 3.942 |
| 二硫化碳 | 1.196 | 乙基苯 | 4.081 |
| 1, 1, 2-三氟三氯乙烷 | 1.202 | 间/对-二甲基苯 | 4.142 |
| (E)-1, 2-二氯乙烯 | 1.286 | 1, 2-二甲基苯 | 4.258 |
| 1, 1-二氯乙烷 | 1.369 | 苯乙烯 | 4.265 |
| 2-丁酮 | 1.419 | 4-乙基甲苯 | 4.721 |
| (Z)-1, 2-二氯乙烯 | 1.551 | 1, 3, 5-三甲基苯 | 4.749 |
| 三氯甲烷 | 1.614 | 1, 2, 4-三甲基苯 | 4.886 |
| 四氢呋喃 | 1.723 | 1, 3-二氯苯 | 4.931 |
| 1, 2-二氯乙烷 | 1.814 | 1, 4-二氯苯 | 4.951 |
| 1, 1, 1-三氯乙烷 | 1.895 | 1, 2-二氯苯 | 5.074 |
| 苯 | 2.034 | 萘 | 5.688 |
| 四氯化碳 | 2.079 | 1, 2, 4-三氯苯 | 5.692 |
| 环己烷 | 2.086 | 六氯-1, 3-丁二烯 | 5.865 |
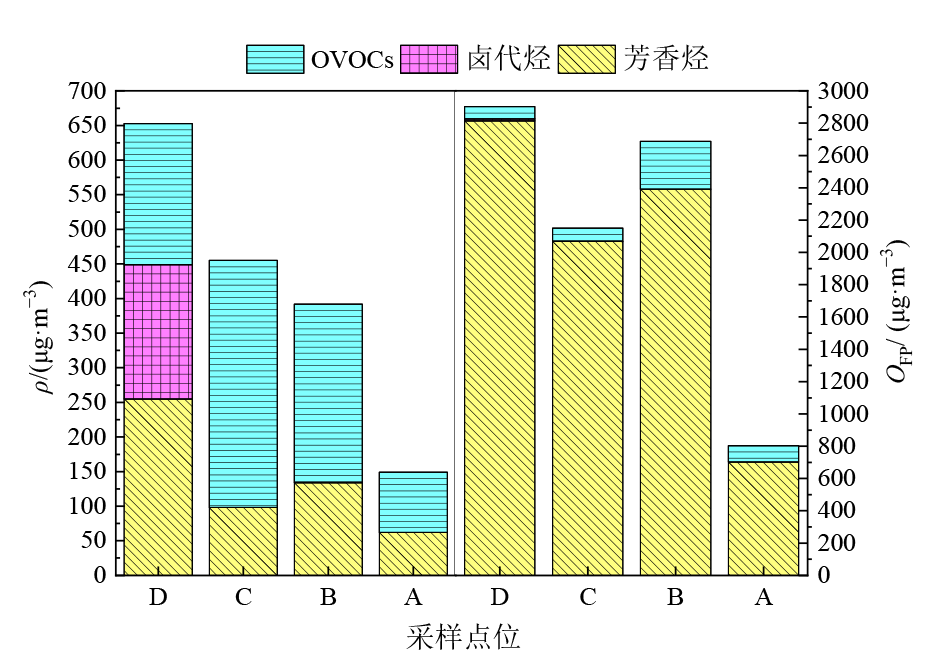
图2 不同家居市场不同种类VOCs质量浓度及臭氧生成潜势
Figure 2 VOCs concentration and ozone potential in different furnishing malls
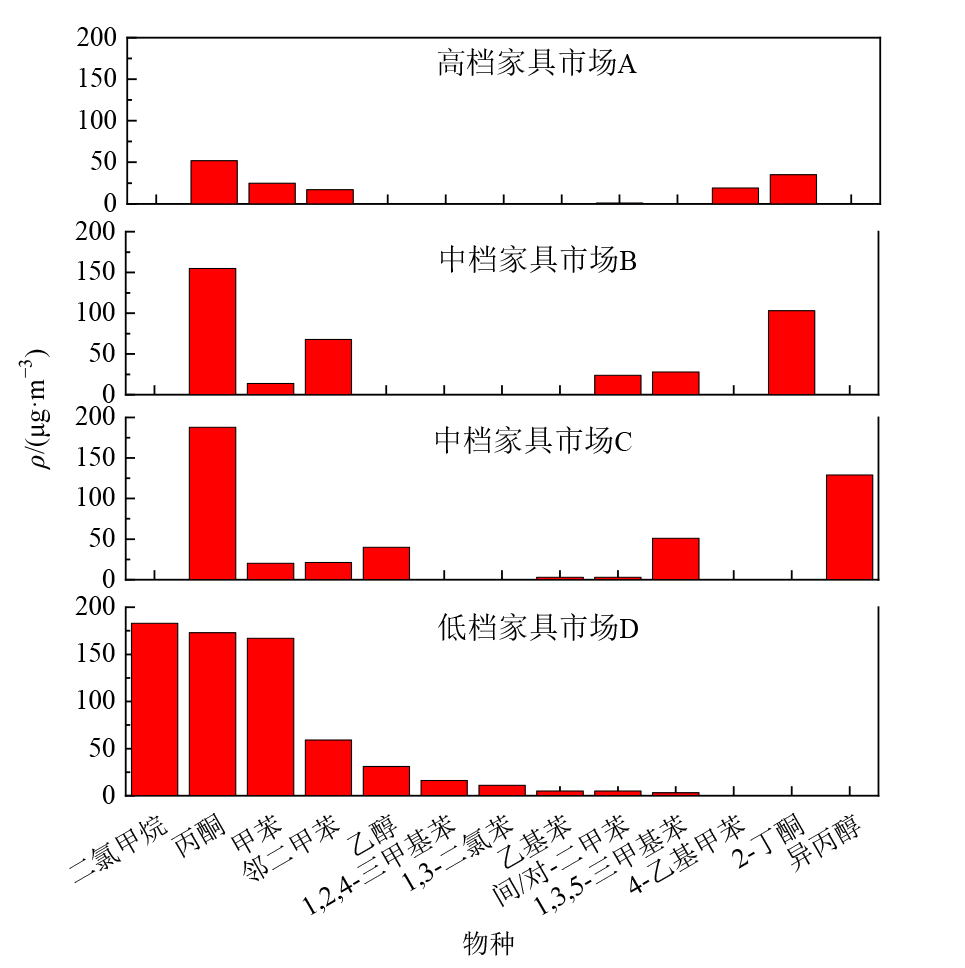
图3 不同家居市场VOCs质量浓度及其成分谱 以上为家居市场监测出的全部物种,其他物种均未检出
Figure 3 VOCs concentration and composition spectrum in different furnishing malls
| 化合物名称 | A | B | C | 环境空气站点 | |||||||
|---|---|---|---|---|---|---|---|---|---|---|---|
| 质量浓度 | OFP | 质量浓度 | OFP | 质量浓度 | OFP | 质量浓度 | OFP | ||||
| 甲苯 | 25.00 | 191.96 | 14.00 | 107.5 | 20.00 | 153.57 | 3.64 | 27.95 | |||
| 邻二甲苯 | 17.00 | 287.25 | 68.00 | 1149.01 | 21.00 | 354.84 | 1.87 | 31.63 | |||
| 间/对-二甲苯 | ND | ND | 24.00 | 310.02 | 3.00 | 38.75 | 1.82 | 23.57 | |||
| 乙基苯 | ND | ND | ND | ND | 3.00 | 20.17 | 1.30 | 8.76 | |||
| 1, 3, 5-三甲基苯 | ND | ND | 28.00 | 824.5 | 51.00 | 1501.77 | 0.99 | 29.23 | |||
| 4-乙基甲苯 | 19.00 | 211.23 | ND | ND | ND | ND | 0.83 | 9.25 | |||
| 丙酮 | 52.00 | 22.65 | 155.00 | 67.52 | 188.00 | 81.89 | ND | ND | |||
| 异丙醇 | ND | ND | ND | ND | 129.00 | ND | ND | ND | |||
| 乙醇 | ND | ND | ND | ND | 40.00 | ND | ND | ND | |||
| 2-丁酮 | 35.00 | 77.82 | 103.00 | 229.01 | ND | ND | ND | ND | |||
| 合计 | 148.00 | 790.91 | 392.00 | 2687.55 | 455.00 | 2151.00 | 10.46 | 130.39 | |||
表2 家居市场与环境空气站点VOCs质量浓度和OFP对比
Table 2 Comparison of VOCs concentration and OFP at furniture mall and ambient air sites μg·m-3
| 化合物名称 | A | B | C | 环境空气站点 | |||||||
|---|---|---|---|---|---|---|---|---|---|---|---|
| 质量浓度 | OFP | 质量浓度 | OFP | 质量浓度 | OFP | 质量浓度 | OFP | ||||
| 甲苯 | 25.00 | 191.96 | 14.00 | 107.5 | 20.00 | 153.57 | 3.64 | 27.95 | |||
| 邻二甲苯 | 17.00 | 287.25 | 68.00 | 1149.01 | 21.00 | 354.84 | 1.87 | 31.63 | |||
| 间/对-二甲苯 | ND | ND | 24.00 | 310.02 | 3.00 | 38.75 | 1.82 | 23.57 | |||
| 乙基苯 | ND | ND | ND | ND | 3.00 | 20.17 | 1.30 | 8.76 | |||
| 1, 3, 5-三甲基苯 | ND | ND | 28.00 | 824.5 | 51.00 | 1501.77 | 0.99 | 29.23 | |||
| 4-乙基甲苯 | 19.00 | 211.23 | ND | ND | ND | ND | 0.83 | 9.25 | |||
| 丙酮 | 52.00 | 22.65 | 155.00 | 67.52 | 188.00 | 81.89 | ND | ND | |||
| 异丙醇 | ND | ND | ND | ND | 129.00 | ND | ND | ND | |||
| 乙醇 | ND | ND | ND | ND | 40.00 | ND | ND | ND | |||
| 2-丁酮 | 35.00 | 77.82 | 103.00 | 229.01 | ND | ND | ND | ND | |||
| 合计 | 148.00 | 790.91 | 392.00 | 2687.55 | 455.00 | 2151.00 | 10.46 | 130.39 | |||
| 化合物种类 | D | C | B | A | |||||||
|---|---|---|---|---|---|---|---|---|---|---|---|
| 排放因子/(g·m-2) | 排放量/(t·a-1) | 排放因子/(g·m-2) | 排放量/(t·a-1) | 排放因子/(g·m-2) | 排放量/(t·a-1) | 排放因子/(g·m-2) | 排放量/(t·a-1) | ||||
| 芳香烃 | 120.63 | 0.97 | 51.51 | 0.77 | 88.04 | 0.93 | 35.85 | 1.43 | |||
| 卤代烃 | 91.77 | 0.73 | ND | ND | ND | ND | ND | ND | |||
| OVOCs | 96.50 | 0.77 | 187.64 | 2.81 | 169.51 | 1.80 | 50.30 | 2.01 | |||
| 合计 | 308.90 | 2.47 | 239.15 | 3.59 | 257.54 | 2.74 | 86.15 | 3.45 | |||
表3 不同家居市场VOCs年排放因子和年排放量
Table 3 VOCs annual emission factors and annual emissions in different furniture mall
| 化合物种类 | D | C | B | A | |||||||
|---|---|---|---|---|---|---|---|---|---|---|---|
| 排放因子/(g·m-2) | 排放量/(t·a-1) | 排放因子/(g·m-2) | 排放量/(t·a-1) | 排放因子/(g·m-2) | 排放量/(t·a-1) | 排放因子/(g·m-2) | 排放量/(t·a-1) | ||||
| 芳香烃 | 120.63 | 0.97 | 51.51 | 0.77 | 88.04 | 0.93 | 35.85 | 1.43 | |||
| 卤代烃 | 91.77 | 0.73 | ND | ND | ND | ND | ND | ND | |||
| OVOCs | 96.50 | 0.77 | 187.64 | 2.81 | 169.51 | 1.80 | 50.30 | 2.01 | |||
| 合计 | 308.90 | 2.47 | 239.15 | 3.59 | 257.54 | 2.74 | 86.15 | 3.45 | |||
| [1] | CAPÍKOVÁ A, TESAŘOVÁ D, HLAVATY J, et al., 2019. Estimation of Volatile organic compounds (VOCs) and human health risk assessment of simulated indoor environment consisting of upholstered furniture made of commercially available foams[J]. Advances in Polymer Technology, 2019: 5727536. |
| [2] |
CATER W P L, 1995. Computer modeling of environmental chamber measurements of maximum incremental reactivities of volatile organic compounds[J]. Atmospheric Environment, 29(18): 2513-2527.
DOI URL |
| [3] |
CHENG K, HAO W W, YI P, et al., 2018. Volatile organic compounds emission from Chinese Wood furniture coating industry: activity-based emission factor, speciation profiles, and provincial emission inventory[J]. Aerosol and Air Quality Research, 18(11): 2813-2825.
DOI URL |
| [4] |
CHENG N N, JING D J, ZHANG C, et al., 2020. Process-based VOCs source profiles and contributions to ozone formation and carcinogenic risk in a typical chemical synthesis pharmaceutical industry in China[J]. Science of the Total Environment, 752(12-14): 141899.
DOI URL |
| [5] |
HU K, LIU Z Q, WANG M, et al., 2021. VOCs fugitive emission characteristics and health risk assessment from typical plywood industry in the Yangtze River Delta Region, China[J]. Atmosphere, 12(11): 1530
DOI URL |
| [6] |
HU Y J, YAN M H, SHI P T, 2021. Emissions characterization of volatile organic compounds and health risk assessment in two fresh furniture[J]. Journal of Biobased Materials and Bioenergy, 15(3): 413-420.
DOI URL |
| [7] |
HUANG Y, SU T, WANG L Q, et al., 2019. Evaluation and characterization of volatile air toxics indoors in a heavy polluted city of northwestern China in wintertime[J]. Science of the Total Environment, 662: 470-480.
DOI URL |
| [8] | LI K, JACOB D J, LIAO H, et al., 2021. Ozone pollution in the North China Plain spreading into the late-winter haze season[J]. Proceedings of the National Academy of Sciences, 118(10): e2015797118. |
| [9] |
LI Y P, ZHANG Z C, XING Y S, 2022. Long-Term change analysis of PM2.5 and ozone pollution in China’ s most polluted region during 2015-2020[J]. Atmosphere, 13(1): 104.
DOI URL |
| [10] |
SHEN L J, PING X, LIANG S W, et al., 2018. Sources Profiles of Volatile organic compounds (VOCs) measured in a typical industrial process in Wuhan, central China[J]. Atmosphere, 9(8): 297.
DOI URL |
| [11] |
SHI X R, ZHENG Y X, LEI Y, et al., 2021. Air quality benefits of achieving carbon neutrality in China[J]. Science of the Total Environment, 795: 148784.
DOI URL |
| [12] |
SUN S J, ZHAO Z Y, SHEN J, 2019. Effects of the manufacturing conditions on the VOCs emissions of particleboard[J]. Bioresources, 15(1): 1074-1084.
DOI URL |
| [13] |
TONG R P, ZHANG L, YANG X Y, et al., 2019. Emission characteristics and probabilistic health risk of volatile organic compounds from solvents in wooden furniture manufacturing[J]. Journal of Cleaner Production, 208: 1096-1108.
DOI URL |
| [14] |
WANG H L, JING S A, LOU S R, et al., 2017. Volatile organic compounds (VOCs) source profiles of on-road vehicle emissions in China[J]. Science of the Total Environment, 607-608: 253-261.
DOI URL |
| [15] |
WANG Y Z, WANG H M, TAN Y D, et al., 2021. Measurement of the key parameters of VOC emissions from wooden furniture, and the impact of temperature[J]. Atmospheric Environment, 259: 118510.
DOI URL |
| [16] |
WANG Y Z, YANG T, HE Z C, et al., 2020. A general regression method for accurately determining the key parameters of VOC emissions from building materials/furniture in a ventilated chamber[J]. Atmospheric Environment, 231: 117527.
DOI URL |
| [17] |
WU W L, XUE W B, ZHENG Y X, et al., 2021. Diurnal regulation of VOCs may not be effective in controlling ozone pollution in China[J]. Atmospheric Environment, 256: 118442.
DOI URL |
| [18] |
XIAO L P, HAI G A, YU W A, et al., 2020. Hazardous volatile organic compounds in ambient air of China[J]. Chemosphere, 246: 125731.
DOI URL |
| [19] |
XIONG C, WANG N, ZHUO L, et al., 2021. Component characteristics and source apportionment of volatile organic compounds during summer and winter in downtown Chengdu, southwest China[J]. Atmospheric Environment, 258: 118485.
DOI URL |
| [20] | YAN M H, ZHAI Y B, SHI P T, et al., 2018. Emission of volatile organic compounds from new furniture products and its impact on human health[J]. Human & Ecological Risk Assessment an International Journal, 25(7): 1886-1906. |
| [21] |
ZHANG Z F, ZHANG X, ZHANG X M, et al., 2020. Indoor occurrence and health risk of Formaldehyde, Toluene, Xylene and total Volatile Organic Compounds derived from an extensive monitoring campaign in Harbin, a megacity of China[J]. Chemosphere, 250: 126324.
DOI URL |
| [22] |
ZHONG Z M, SHA Q E, ZHENG J Y, et al., 2017. Sector-based VOCs emission factors and source profiles for the surface coating industry in the Pearl River Delta region of China[J]. Science of the Total Environment, 583: 19-28.
DOI URL |
| [23] | ZHOU Z E, FANG W K, LUO Q, et al., 2017. Emission characteristics of VOCs from automobile coating industry in Chongqing City[J]. Meteorological and Environmental Research, 8(3): 36-41. |
| [24] |
ZHOU Z H, TAN Q W, DENG Y, et al., 2019. Emission inventory of anthropogenic air pollutant sources and characteristics of VOCs species in Sichuan Province, China[J]. Journal of Atmospheric Chemistry, 76(1): 21-58.
DOI |
| [25] | 陈纯, 李鹏钊, 董瑞泽, 等, 2022. 河南省某典型垃圾焚烧发电厂的VOCs排放特征[J]. 环境科学研究, 35(5): 1193-1202. |
| CHEN C, LI P Z, DONG R Z, et al., 2022. VOCs emission characteristics of a typical domestic waste incineration power plant in Henan Province, China[J]. Research of Environmental Sciences, 35(5): 1193-1202. | |
| [26] | 陈宇炼, 沙春霞, 张静, 等, 2002. 室内空气中主要挥发性有机物污染状况调查[J]. 中国卫生监督杂志, 2(9): 84-86. |
| CHEN Y L, SHA C X, ZHANG J, et al., 2002. Investigation of the pollution status of major volatile organic compounds in indoor air[J]. Chinese Journal of Health Inspection, 2(9): 84-86. | |
| [27] | 代伶文, 孟晶, 李倩倩, 等, 2021. 长江经济带湖北省人为源VOCs排放清单及变化特征[J]. 环境科学, 42(3): 1039-1052. |
| DAI L W, MENG J, LI Q Q, et al., 2021. VOCs emission inventory and variation characteristics of artificial sources in Hubei Province in the Yangtze River Economic Belt[J]. Environmental Science, 42(3): 1039-1052. | |
| [28] | 方莉, 刘文文, 陈丹, 等, 2019. 北京市典型溶剂使用行业VOCs成分谱[J]. 环境科学, 40(10): 4395-4403. |
| FANG L, LIU W W, CHEN D, et al., 2019. Source profiles of Volatile Organic Compounds (VOCs) from typical solvent based industries in Beijing[J]. Environmental Science, 40(10): 4395-4403. | |
| [29] |
高翠玲, 赵继峰, 刘萌萌, 等, 2020. 板材家具VOCs溯源分析及健康风险评价[J]. 生态环境学报, 29(2): 319-327.
DOI |
| GAO C L, ZHAO J F, LIU M M, et al., 2020. Source analysis and health risk assessment of VOCs in panel-type furniture[J]. Ecology and Environmental Sciences, 29(2): 319-327. | |
| [30] | 高美平, 邵霞, 聂磊, 等, 2019. 中国建筑涂料使用VOCs排放因子及排放清单的建立[J]. 环境科学, 40(3): 1152-1162. |
| GAO M P, SHAO X, NIE L, et al., 2019. Establishment of VOCs emissions factor and emissions inventory from using of architectural coatings in China[J]. Environmental Science, 40(3): 1152-1162. | |
| [31] |
高素莲, 闫学军, 刘光辉, 等, 2020. 济南市夏季臭氧重污染时段VOCs污染特征及来源解析[J]. 生态环境学报, 29(9): 1839-1846.
DOI |
| GAO S L, YAN X J, LIU G H, et al., 2020. Characteristics and source apportionment of ambient VOCs in serious ozone pollution period of summer in Ji’nan[J]. Ecology and Environmental Sciences, 29(9): 1839-1846. | |
| [32] | 高素莲, 闫学军, 张荣荣, 等, 2021. 济南市人为源挥发性有机物排放清单及特征[J]. 环境科学与技术, 44(S1): 191-198. |
|
GAO S L, YAN X J, ZHANG R R, et al., 2021. Emission inventory and characteristics of anthropogenic volatile organic compounds in Jinan[J]. Environmental Science & Technology, 44(S1): 191-198.
DOI URL |
|
| [33] | 康家宁, 2020. 公共建筑室内空气主要污染物浓度水平及风险评价[D]. 北京: 北京建筑大学: 1-76. |
| KANG J N, 2020. Concentration level and risk assessment of major pollutants in indoor air in public buildings[D]. Beijing: Beijing University of Civil Engineering: 1-76. | |
| [34] | 李娜, 许海亚, 彭业顺, 等, 2020. 家具面板中VOC的释放特性规律研究[J]. 节能, 39(5): 48-50. |
| LI N, XU H Y, PENG Y S, et al., 2020. Study on the release characteristics of VOCs in furniture panels[J]. Energy Conservation, 39(5): 48-50. | |
| [35] | 刘锐源, 钟美芳, 赵晓雅, 等, 2021. 2011-2019年中国工业源挥发性有机物排放特征[J]. 环境科学, 42(11): 5169-5179. |
| LIU R Y, ZHONG M F, ZHAO X Y, et al., 2021. Characteristics of industrial Volatile organic compounds (VOCs) emission in China from 2011 to 2019[J]. Environmental Science, 42(11): 5169-5179. | |
| [36] | 齐一谨, 倪经纬, 赵东旭, 等, 2020. 郑州市典型工业企业VOCs排放特征及风险评估[J]. 环境科学, 41(7): 3056-3065. |
| QI Y J, NI J W, ZHAO D X, et al., 2020. Emission characteristics and risk assessment of Volatile Organic Compounds from typical factories in Zhengzhou[J]. Environmental Science, 41(7): 3056-3065. | |
| [37] | 齐一谨, 倪经纬, 赵东旭, 等, 2021. 邢台市典型行业VOCs排放特征研究[J]. 环境科学研究, 34(10): 2339-2349. |
| QI Y J, NI J W, ZHAO D X, et al., 2021. Emission Characteristics of volatile organic compounds (VOCs) from typical industrial sectors in Xingtai City[J]. Research of Environmental Sciences, 34(10): 2339-2349. | |
| [38] | 邵弈欣, 陆燕, 楼振纲, 等, 2020. 制药行业VOCs排放组分特征及其排放因子研究[J]. 环境科学学报, 40(11): 4145-4155. |
| SHAO Y X, LU Y, LOU Z G, et al., 2020. Study on emission characteristics and emission factors of VOC components in the pharmaceutical industry[J]. Acta Scientiae Circumstantiae, 40(11): 4145-4155. | |
| [39] | 宋晗睿, 徐勃, 王健, 等, 2022. 我国典型工业城市夏冬季卤代烃来源解析与致癌风险[J]. 环境科学研究, 35(11): 2527-2537. |
| SONG H R, XU B, WANG J, et al., 2022. Halogenated hydrocarbon source apportionment and carcinogenic risks in summer and winter in a typical industrial city of China[J]. Research of Environmental Sciences, 35(11): 2527-2537. | |
| [40] | 孙佳宁, 谢绍东, 2020. 基于环境空气中VOCs在线监测数据精准识别化工园区VOCs排放源[J]. 环境科学, 41(11): 4874-4884. |
| SUN J N, XIE S D, 2020. Accurate identification of ambient VOCs emission sources in an industrial park using on-line monitoring data[J]. Environmental Science, 41(11): 4874-4884. | |
| [41] | 田茂吉, 叶辉, 2022. 贵阳市家具城室内空气污染水平调查及健康风险评价[J]. 职业与健康, 38(19): 2683-2686. |
| TIAN M J, YE H, 2022. Investigation of indoor air pollution in furniture centers in Guiyang City and health risk assessment Occupation and Health[J]. Occupation and Health, 38(19): 2683-2686. | |
| [42] | 佟瑞鹏, 张磊, 杨校毅, 等, 2018. 家具制造过程中VOCs的来源分析及环境健康风险评价[J]. 环境科学, 39(2): 672-683. |
| TONG R P, ZHANG L, YANG X Y, et al., 2018. Source Analysis and Environmental Health Risk Assessment of VOCs in Furniture Manufacturing[J]. Environmental Science, 39(2): 672-683. | |
| [43] | 王兆军, 赵继峰, 孙友敏, 等, 2020. 基于Orbitrap GC-MS法的家具用涂料VOCs化学物种谱研究[J]. 环境影响评价, 42(4): 76-84. |
| WANG Z J, ZHAO J F, SUN Y M, et al., 2020. Study on the chemical species profile of VOCs in furniture coatings using the orbitrap GC-MS[J]. Environmental Impact Assessment, 42(4): 76-84. | |
| [44] | 吴文璐, 单春艳, 赵菁林, 等, 2023. 济南市典型行业VOCs排放特征及减排潜力分析[J/OL]. 环境科学: 1-11[2023-04-30]. https://doi.org/10.13227/j.hjkx.202212035. |
| WU W L, SHAN C Y, ZHAO J L, et al., 2023. Analysis of VOCs emission characteristics and emission reduction potential of typical industries in Ji’nan, China[J/OL]. Environmental Science, 1-11 [2023-04-30]. https://doi.org/10.13227/j.hjkx.202212035. | |
| [45] | 谢丹平, 黄忠辉, 刘旺, 等, 2022. 电子垃圾拆解回收VOCs排放特征与排放因子[J]. 环境科学, 43(1): 150-159. |
| XIE D P, HUANG Z H, LIU W, et al., 2022. Emission characteristics and emission factors of volatile organic compounds from e-waste dismantling and recycling processes[J]. Environmental Science, 43(1): 150-159. | |
| [46] | 闫怀忠, 赵继峰, 潘光, 等, 2021. 走航溯源耦合在线监测分析喷涂企业排放VOCs对大气臭氧污染的影响[J]. 中国环境监测, 37(6): 62-73. |
| YAN H Z, ZHAO J F, PAN G, et al., 2021. Analysis of the impact of VOCs emission from coating industry on atmospheric ozone pollution by on-line monitoring coupled with aviation traceability[J]. Environmental Monitoring in China, 37(6): 62-73. | |
| [47] | 于文璐, 张舸, 2022. 家具厂水性漆涂装过程VOC散发特征研究[J]. 暖通空调, 52(11): 134-137, 41. |
| YU W L, ZHANG K, 2022. VOC emission characteristics of water-based paint during painting process in furniture factories[J]. Heating Ventilating & Air Conditioning, 52(11): 134-137, 41. | |
| [48] | 曾春玲, 邵霞, 刘锐源, 等, 2021. 广东省家居行业基于涂料类型的VOCs排放特征及其环境影响[J]. 环境科学, 42(10): 4641-4649. |
| ZENG C L, SAO X, LIU R Y, et al., 2021. Coating-derived VOCs Emission characteristics and environmental impacts from the furniture industry in Guangdong province[J]. Environmental Science, 42(10): 4641-4649. | |
| [49] | 张嘉妮, 曾春玲, 刘锐源, 等, 2019. 家具企业挥发性有机物排放特征及其环境影响[J]. 环境科学, 40(12): 5240-5249. |
| ZHANG J N, ZENG C L, LIU R Y, et al., 2019. Volatile organic compound emission characteristics of furniture manufacturing enterprises and the influence on the atmospheric environment[J]. Environmental Science, 40(12): 5240-5249. | |
| [50] | 中华人民共和国住房和城乡建设部, 2004. 采暖通风与空气调节设计规范[M]. 北京: 中国计划出版社:1-133. |
| Ministry of Housing and Urban-Rural Development of the People’s Republic of China, 2004. Code for design of heating ventilation and air conditioning[M]. Beijing: Beijing China Planning Publishing House:1-133. | |
| [51] | 钟美芳, 田俊泰, 叶代启, 2021. “十四五” 我国VOCs排放总量控制方案研究与建议[J]. 环境影响评价, 43(2): 1-6. |
|
ZHONG M F, TIAN J T, YIE D Q, 2021. China’s total VOCs control program research and suggestions during the 14th five-year period[J]. Environmental Impact Assessment, 43(2): 1-6.
DOI URL |
| [1] | 许肖云, 饶芝菡, 蒋红斌, 张巍, 陈超, 杨永安, 胡艳丽, 魏海川. 遂宁工业园区夏季VOCs污染特征及其对O3、SOA生成潜势研究[J]. 生态环境学报, 2023, 32(5): 956-968. |
| [2] | 温丽容, 江明, 黄渤, 袁鸾, 周炎, 陆炜梅, 张莹, 刘明, 张力昀. 珠三角典型区域臭氧成因分析与VOCs来源解析——以中山为例[J]. 生态环境学报, 2023, 32(3): 500-513. |
| [3] | 陈雪泉, 孔彬, 兰青, 余志铨, 谢银斯, 黄俊毅. 胶黏剂生产行业VOCs组分特征及臭氧生成潜势分析[J]. 生态环境学报, 2022, 31(4): 750-758. |
| [4] | 李颖慧, 郭前进, 闫雨龙, 胡冬梅, 邓萌杰, 彭林. 晋城市环境空气中BTEX变化特征及来源[J]. 生态环境学报, 2022, 31(3): 504-511. |
| 阅读次数 | ||||||
|
全文 |
|
|||||
|
摘要 |
|
|||||