生态环境学报 ›› 2024, Vol. 33 ›› Issue (10): 1612-1623.DOI: 10.16258/j.cnki.1674-5906.2024.10.013
许静*( ), 王德仁
收稿日期:2024-06-03
出版日期:2024-10-18
发布日期:2024-11-15
作者简介:*许静(1983年生),女,教授,博士,研究方向为生态经济学。E-mail: xujing@lzufe.edu.cn.
基金资助:
XU Jing*(), WANG Deren
Received:2024-06-03
Online:2024-10-18
Published:2024-11-15
摘要:
黄河流域水资源短缺、水土流失严重、生态本底脆弱,科学评估黄河流域生态系统健康对于防范和化解流域生态风险,保障黄河安澜,促进流域生态保护和高质量发展具有重要意义。以黄河流域为研究区,构建活力-组织力-弹力-服务(VORS)评估框架,探讨2000-2020年生态系统健康时空分异,并耦合GMOP与PLUS模型预测2030年多情景下生态系统健康动态演变。结果表明:2000、2010和2020年,黄河流域生态系统活力均值分别为0.435、0.437和0.436,整体较为稳定,呈西高东低的空间分布特征;生态系统组织力指数均值分别为0.593、0.603和0.629,呈中部向四周递减的特征;生态系统弹力指数均值分别为0.507、0.511和0.505,东部低,其余地区较高;生态系统服务指数均值分别为0.402、0.398和0.390,呈由北向南递增的趋势;生态系统健康指数分别为0.419、0.423和0.425,呈中部高、东部低的空间分布特征。2030年,各情景下活力、弹力和生态系统服务无显著差异,而生态保护(EP)和综合发展(CD)情景下组织力显著提高。2030年,各情景下生态系统健康空间分布均呈中部较高,东、西南部较低的特征,但EP和CD情景下生态系统健康水平略高于自然发展(ND)和经济发展(ED)情景,且CD情景下生态系统健康I级城市数量最多,因此CD情景可以在满足经济发展需求的前提下确保生态系统健康水平最高,为相对优选情景。该研究以VORS为基础,耦合GMOP-PLUS模型测度黄河流域生态系统健康水平,研究结果可以为流域生态系统科学管理、协同流域经济发展与生态保护提供决策依据。
中图分类号:
许静, 王德仁. 基于VORS模型的黄河流域生态系统健康评估与预测[J]. 生态环境学报, 2024, 33(10): 1612-1623.
XU Jing, WANG Deren. Assessment and Prediction of Ecosystem Health in the Yellow River Basin Based on the VORS Model[J]. Ecology and Environment, 2024, 33(10): 1612-1623.

图1 研究区区位 底图采用自然资源部标准地图制作,审图号为GS(2022)4318号,对底图边界无修改,下同
Figure 1 Location of the study area
| 土地利用类型 | 耕地 | 林地 | 草地 | 水体 | 建设用地 | 未利用地 |
|---|---|---|---|---|---|---|
| 恢复力系数 | 0.5 | 1 | 0.7 | 0.8 | 0.3 | 0.2 |
| 抵抗力系数 | 0.3 | 0.6 | 0.8 | 0.7 | 0.2 | 0.1 |
表1 各土地利用类型的恢复力和抵抗力系数
Table 1 Resilience and resistance coefficients for each land-use type
| 土地利用类型 | 耕地 | 林地 | 草地 | 水体 | 建设用地 | 未利用地 |
|---|---|---|---|---|---|---|
| 恢复力系数 | 0.5 | 1 | 0.7 | 0.8 | 0.3 | 0.2 |
| 抵抗力系数 | 0.3 | 0.6 | 0.8 | 0.7 | 0.2 | 0.1 |
| 生态系统服务类型 | 生态系统服务 | 计算方法 |
|---|---|---|
| 供给服务 | 食物供给 | 式中:Gi为栅格i的食物产量;INDV, i为栅格i的NDVI值;INDV, sum为草地、耕地的NDVI总值;Gsum为食物总产量,包括粮食、肉类和和奶类 |
| 调节服务 | 产水量 | 式中:AET,i为栅格i的实际蒸散量,Pi为栅格i的年均降水量 |
| 水质净化 | Xexporti=lsurf, i×Nsurf, i +lsubs, i×Nsubs, i 式中:Xexporti为营养物质输送量;lsurf, i与lsubs, i分别为栅格i的地表与地下营养物质负荷量;Nsurf, i和Nsubs, i分别为栅格i的地表与地下营养物质输送速率 | |
| 碳储存 | Ctotal=Cabove+Cbelow+Csoil+Cdead 式中:Ctotal为总碳储量;Cabove为地表碳储量;Cbelow为地下碳储量;Csoil为土壤碳储量;Cdead为死亡有机物碳储量 | |
| 支持服务 | 土壤保持 | Ui =Ri∙Ki∙Fls, i∙(1−CiPi) 式中:Ui为栅格i的土壤保持量;Ri为降雨侵蚀因子;Ki为土壤可蚀性因子;Fls, i为坡长和坡度因子;Ci和Pi分别为植被覆盖管理因子与土壤保持管理因子 |
表2 生态系统服务评估方法
Table 2 Methods for assessing ecosystem services
| 生态系统服务类型 | 生态系统服务 | 计算方法 |
|---|---|---|
| 供给服务 | 食物供给 | 式中:Gi为栅格i的食物产量;INDV, i为栅格i的NDVI值;INDV, sum为草地、耕地的NDVI总值;Gsum为食物总产量,包括粮食、肉类和和奶类 |
| 调节服务 | 产水量 | 式中:AET,i为栅格i的实际蒸散量,Pi为栅格i的年均降水量 |
| 水质净化 | Xexporti=lsurf, i×Nsurf, i +lsubs, i×Nsubs, i 式中:Xexporti为营养物质输送量;lsurf, i与lsubs, i分别为栅格i的地表与地下营养物质负荷量;Nsurf, i和Nsubs, i分别为栅格i的地表与地下营养物质输送速率 | |
| 碳储存 | Ctotal=Cabove+Cbelow+Csoil+Cdead 式中:Ctotal为总碳储量;Cabove为地表碳储量;Cbelow为地下碳储量;Csoil为土壤碳储量;Cdead为死亡有机物碳储量 | |
| 支持服务 | 土壤保持 | Ui =Ri∙Ki∙Fls, i∙(1−CiPi) 式中:Ui为栅格i的土壤保持量;Ri为降雨侵蚀因子;Ki为土壤可蚀性因子;Fls, i为坡长和坡度因子;Ci和Pi分别为植被覆盖管理因子与土壤保持管理因子 |
| 土地利用类型 | 耕地 | 林地 | 草地 | 水体 | 建设用地 | 未利用地 |
|---|---|---|---|---|---|---|
| 生态价值系数 | 0.72 | 4.14 | 3.55 | 22.6 | 0 | 0.19 |
| 经济价值系数 | 0.86 | 0.04 | 0.34 | 0.09 | 15.1 | 0 |
表3 2030年黄河流域各土地利用类型价值系数
Table 3 Value coefficients of different land use types in the Yellow River Basin in 2030 106 yuan?km?2
| 土地利用类型 | 耕地 | 林地 | 草地 | 水体 | 建设用地 | 未利用地 |
|---|---|---|---|---|---|---|
| 生态价值系数 | 0.72 | 4.14 | 3.55 | 22.6 | 0 | 0.19 |
| 经济价值系数 | 0.86 | 0.04 | 0.34 | 0.09 | 15.1 | 0 |
| 约束条件 | 约束表达式 | 约束条件表示 |
|---|---|---|
| 生态价值 | 各优化情景下流域生态价值高于ND情景 | |
| 经济价值 | 各优化情景下流域经济价值高于ND情景 | |
| 研究区总面积 | 各情景下土地利用总面积等于研究区面积 | |
| 耕地面积 | x1>w1 | 耕地面积保持动态平衡, 且不低于现状面积 |
| 建设用地 | x5<70|107 | 建设用地面积不超过《城镇开发边界划定指南(试行)》的规划值 |
| 植被覆盖 | 0.46x1+x2+0.49x3≥0.46w1+w2+0.49w3 | 各优化情景下的植被覆盖度不低于ND情景 |
| 景观多样性 | x2+x3+x4≥w2+w3+w4 | 各优化情景下林地、草地、水域的总面积不低于自然发展情景 |
| 模型精度 | 0.8wk£xk£1.2wk | 优化情景下各类用地面积以ND情景为基准, 浮动范围20% |
表4 情景预测的约束条件
Table 4 Constraints on Scenario Prediction
| 约束条件 | 约束表达式 | 约束条件表示 |
|---|---|---|
| 生态价值 | 各优化情景下流域生态价值高于ND情景 | |
| 经济价值 | 各优化情景下流域经济价值高于ND情景 | |
| 研究区总面积 | 各情景下土地利用总面积等于研究区面积 | |
| 耕地面积 | x1>w1 | 耕地面积保持动态平衡, 且不低于现状面积 |
| 建设用地 | x5<70|107 | 建设用地面积不超过《城镇开发边界划定指南(试行)》的规划值 |
| 植被覆盖 | 0.46x1+x2+0.49x3≥0.46w1+w2+0.49w3 | 各优化情景下的植被覆盖度不低于ND情景 |
| 景观多样性 | x2+x3+x4≥w2+w3+w4 | 各优化情景下林地、草地、水域的总面积不低于自然发展情景 |
| 模型精度 | 0.8wk£xk£1.2wk | 优化情景下各类用地面积以ND情景为基准, 浮动范围20% |

图2 2000-2020年黄河流域土地利用类型分布
Figure 2 Distribution of land use types in the Yellow River Basin from 2000 to 2020
| 土地利用 类型 | 2000年 面积 | 2000‒2010年 变化面积 | 2010‒2020年 变化面积 |
|---|---|---|---|
| 耕地 | 26.6 | −0.593 | −0.707 |
| 林地 | 11.1 | 0.888 | 0.192 |
| 草地 | 32.4 | −0.309 | −0.987 |
| 水体 | 1.29 | 0.163 | 0.127 |
| 建设用地 | 1.87 | 0.345 | 1.455 |
| 未利用地 | 6.22 | −0.493 | −0.079 |
表5 2000-2020年各土地利用类型面积变化
Table 5 Changes in area of various land use types from 2000 to 2020 104 km2
| 土地利用 类型 | 2000年 面积 | 2000‒2010年 变化面积 | 2010‒2020年 变化面积 |
|---|---|---|---|
| 耕地 | 26.6 | −0.593 | −0.707 |
| 林地 | 11.1 | 0.888 | 0.192 |
| 草地 | 32.4 | −0.309 | −0.987 |
| 水体 | 1.29 | 0.163 | 0.127 |
| 建设用地 | 1.87 | 0.345 | 1.455 |
| 未利用地 | 6.22 | −0.493 | −0.079 |

图3 2000-2020年黄河流域土地利用类型转移
Figure 3 Transfer of land use types in the Yellow River Basin from 2000 to 2020

图4 2030年不同发展情景下黄河流域土地利用预测
Figure 4 Projections of land use in the Yellow River Basin under different scenarios in 2030

图5 2000-2020年黄河流域VORS水平分布
Figure 5 Distribution of VORS levels in the Yellow River Basin from 2000 to 2020
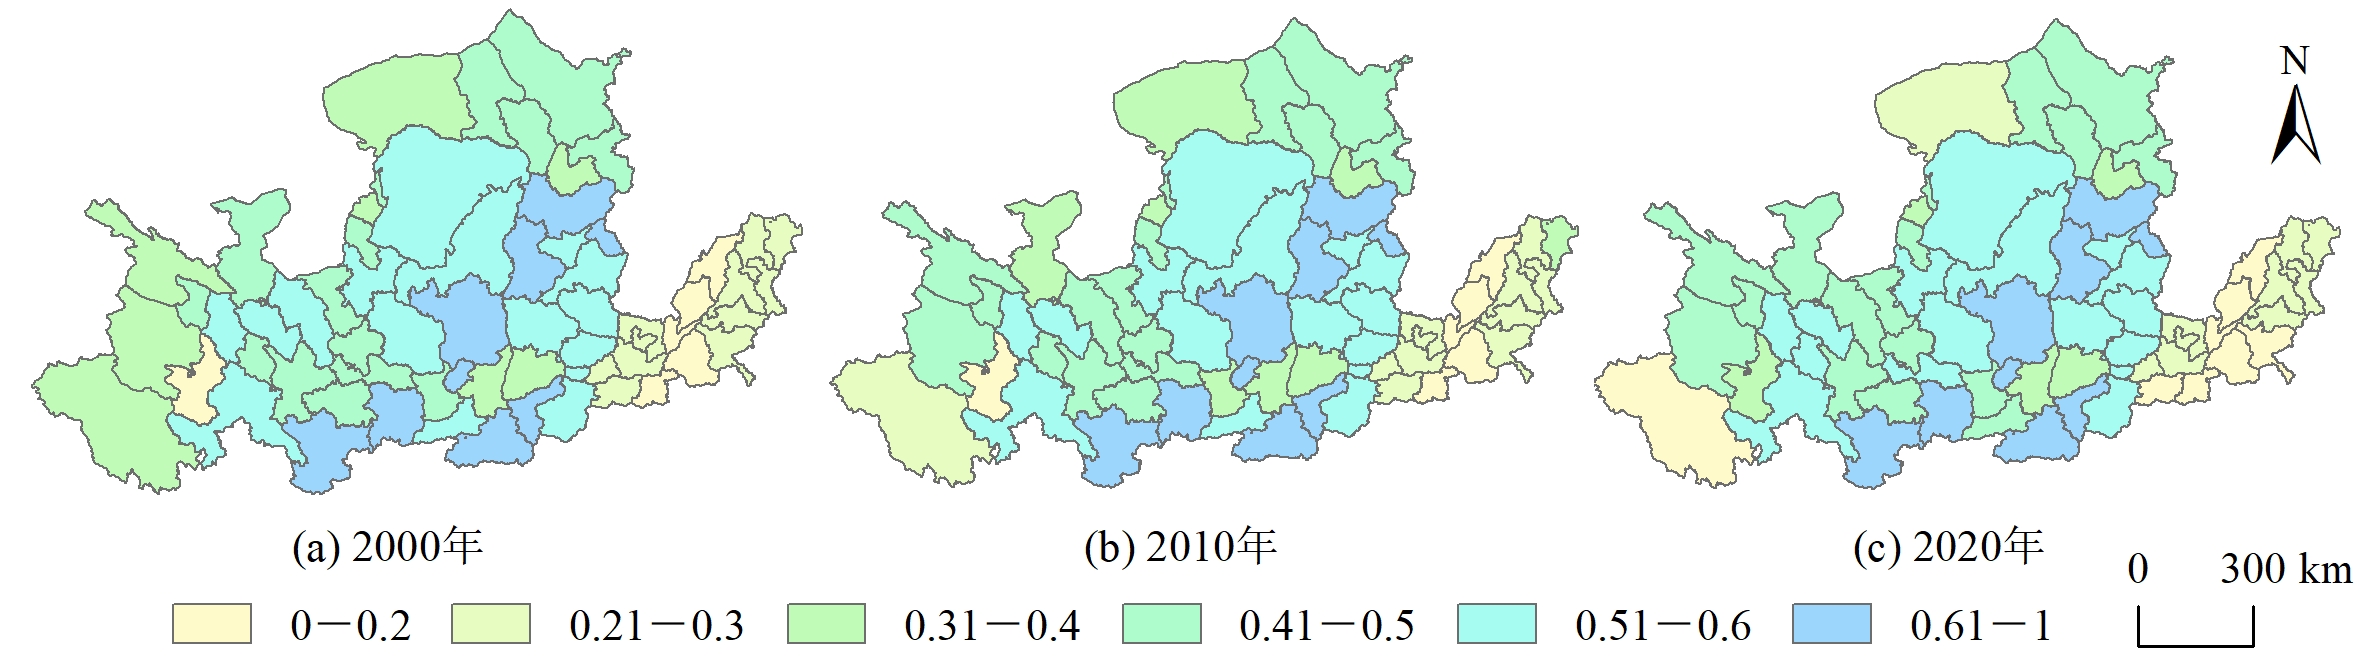
图6 2000-2020年黄河流域生态系统健康等级分布
Figure 6 Distribution of ecosystem health level in the Yellow River Basin from 2000 to 2020
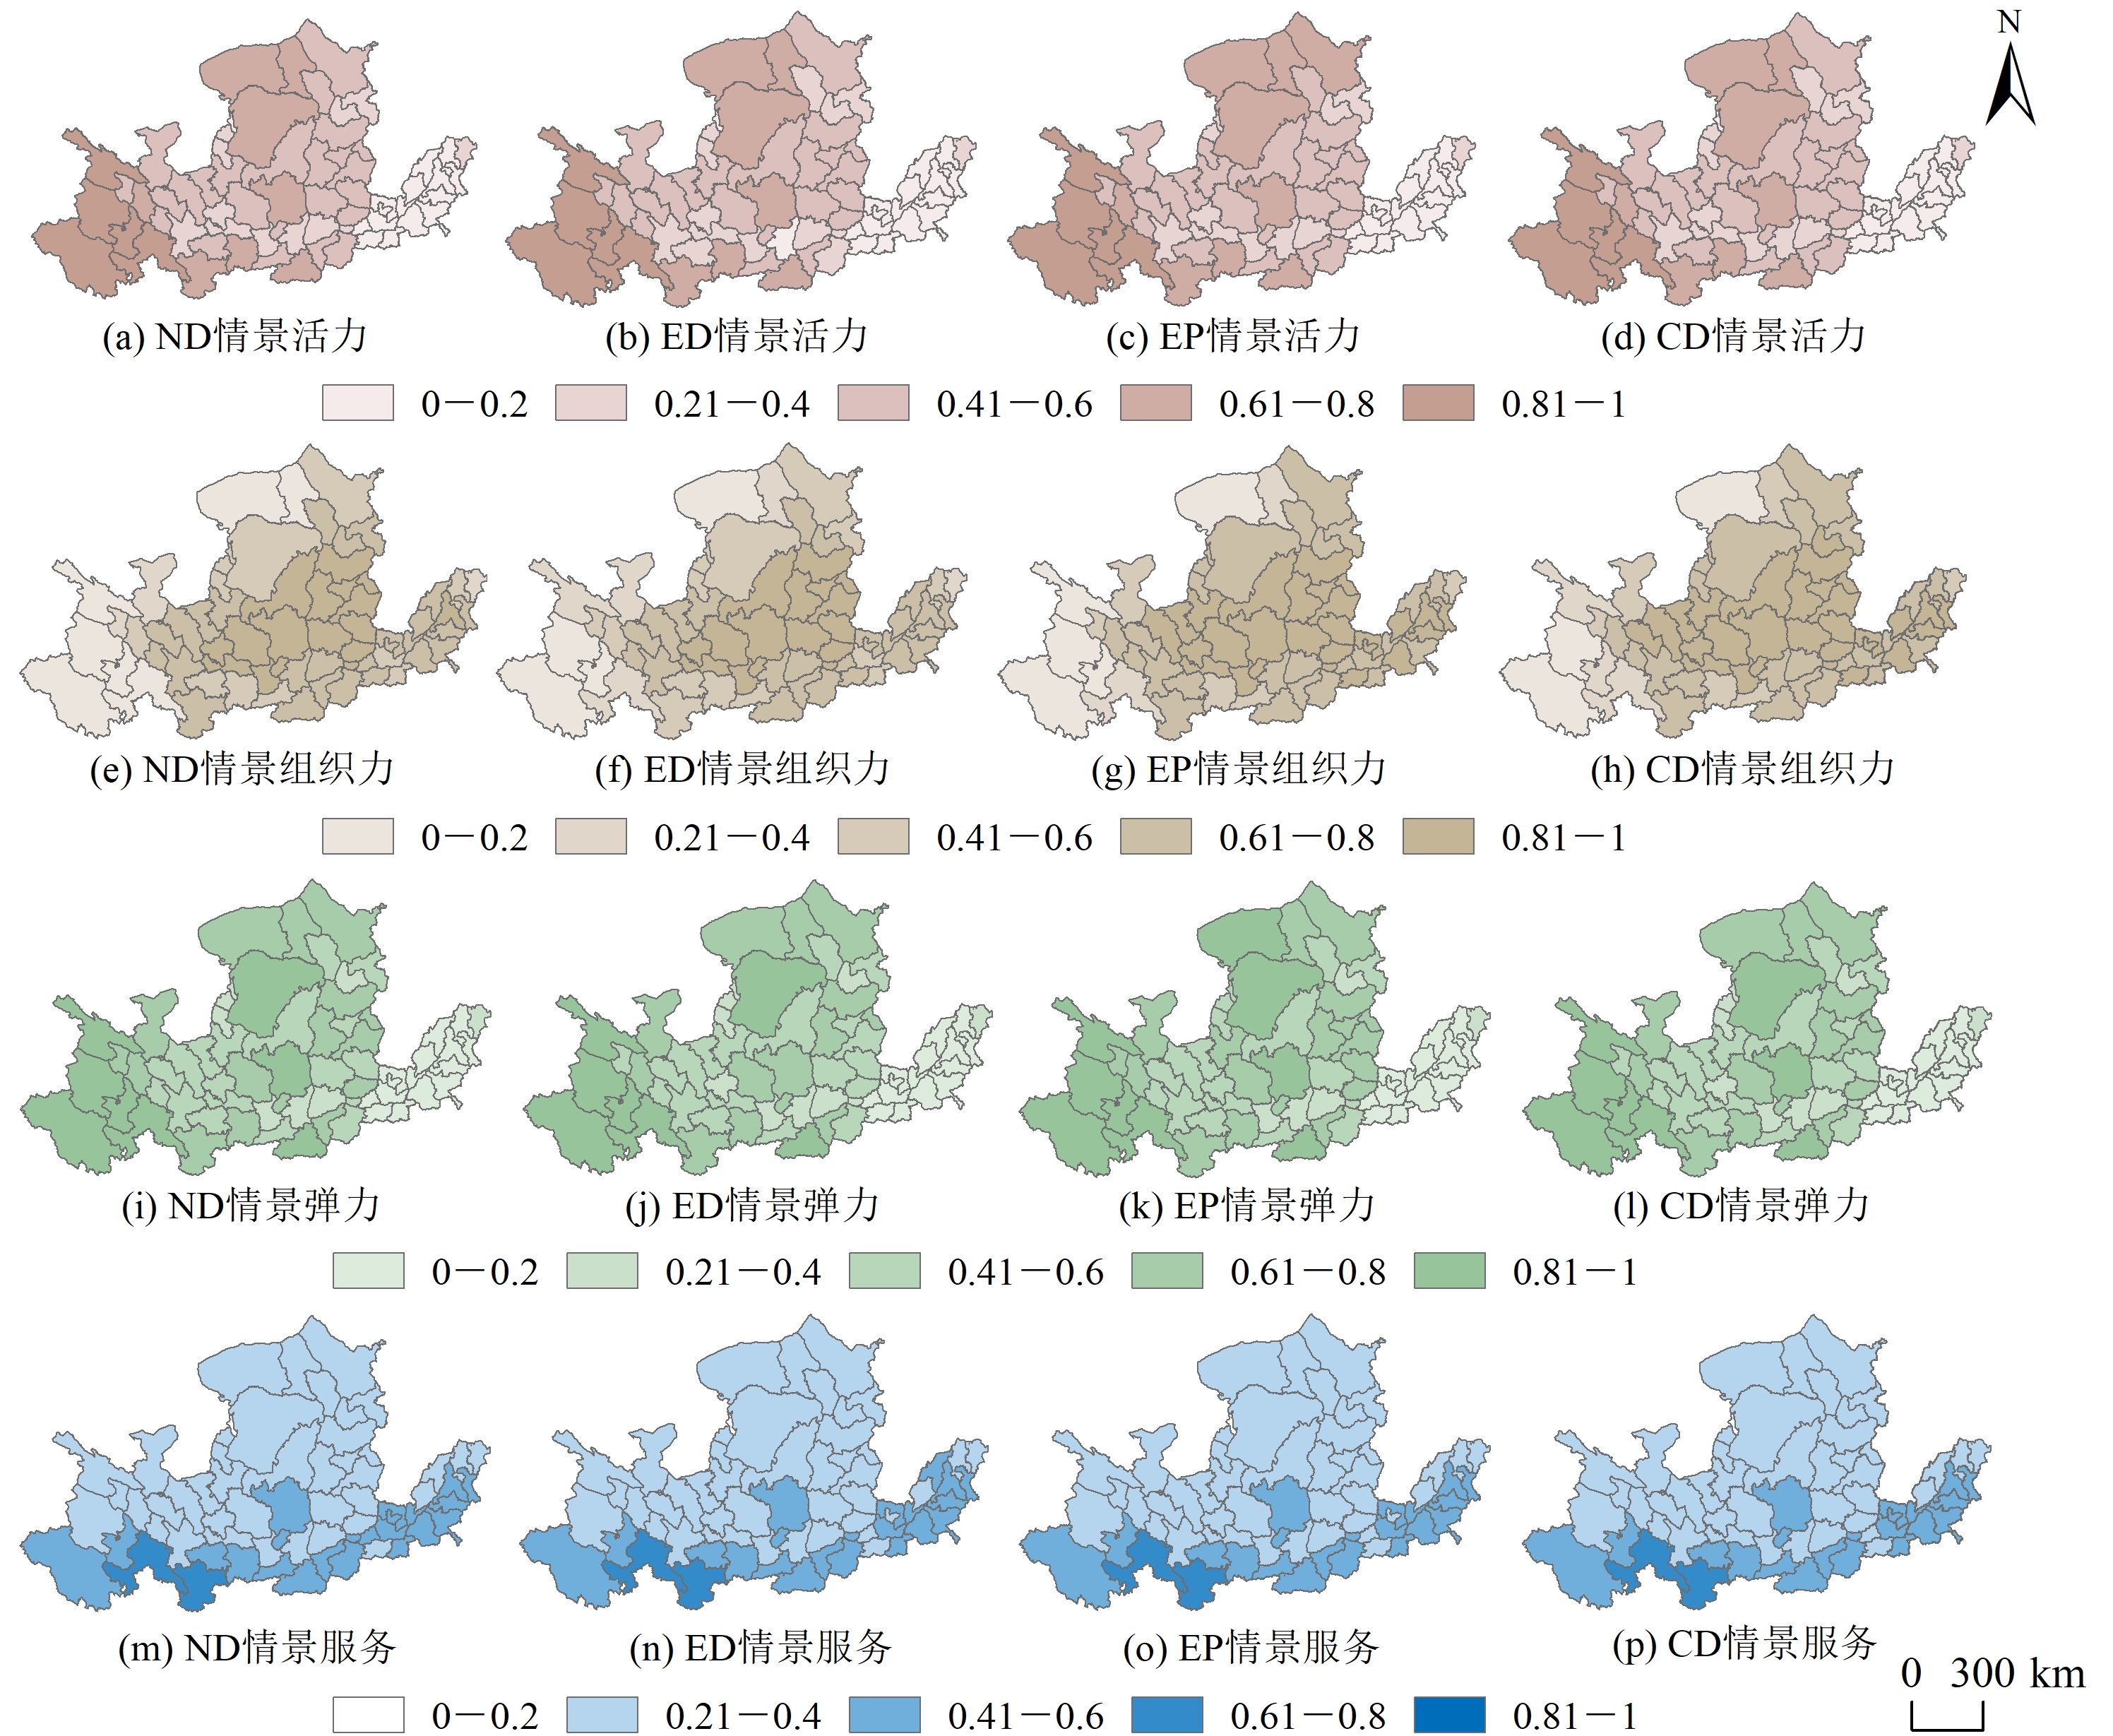
图7 不同发展情景下黄河流域生态系统健康VORS水平分布
Figure 7 Distribution of VORS levels in the Yellow River Basin under different development scenarios

图8 2030年各发展情景下黄河流域生态系统健康预测
Figure 8 Projections of ecosystem health in the Yellow River Basin under different scenarios in 2030
| [1] | CHEN L P, LI Y, TIAN S, et al., 2023a. Evaluating and optimizing the ecosystem health of China’s Yellow River Basin based on emergy analysis and multi-objective decision method[J]. Environment Development and Sustainability, 2023: 1-25. |
| [2] | CHEN W X, YE X Y, LI J F, et al., 2019. Analyzing requisition-compensation balance of farmland policy in China through telecoupling: A case study in the middle reaches of Yangtze River Urban Agglomerations[J]. Land Use Policy, 83: 134-146. |
| [3] | CHEN W X, WANG G Z, ZENG J, 2023b. Impact of urbanization on ecosystem health in Chinese urban agglomerations[J]. Environmental Impact Assessment Review, 98: 106964. |
| [4] | CHI Y, LIU D H, XING W X, et al., 2021. Island ecosystem health in the context of human activities with different types and intensities[J]. Journal of Cleaner Production, 281: 125334. |
| [5] | COSTANZA R, NORTON B G, HASKELL B D, 1992. Ecosystem health: New goals for environmental management[M]. Washington D.C: Island Press: 239-256. |
| [6] | DAS M, DAS A, PEREIRA P, et al., 2021. Exploring the spatio-temporal dynamics of ecosystem health: A study on a rapidly urbanizing metropolitan area of Lower Gangetic Plain, India[J]. Ecological Indicators, 125: 107584. |
| [7] |
DE MARCO A, PROIETTI C, ANAV A, et al., 2019. Impacts of air pollution on human and ecosystem health, and implications for the national emission ceilings directive: Insights from Italy[J]. Environment International, 125: 320-333.
DOI PMID |
| [8] | FU F, DENG S M, WU D, et al., 2022. Research on the spatiotemporal evolution of land use landscape pattern in a county area based on CA-Markov model[J]. Sustainable Cities and Society, 80: 103760. |
| [9] | GAN L, HALIK Ü, SHI L, et al., 2023. Multi-scenario dynamic prediction of ecological risk assessment in an arid area of northwest China[J]. Ecological Indicators, 154: 110727. |
| [10] | HALL L S, KRAUSMAN P R, MORRISON M L, 1997. The habitat concept and a plea for standard terminology[J]. Wildlife Society Bulletin, 25(1): 173-182. |
| [11] | HUANG D Q, HUANG J, LIU T, 2019. Delimiting urban growth boundaries using the CLUE-S model with village administrative boundaries[J]. Land Use Policy, 82: 422-435. |
| [12] | LI C, WU Y M, GAO B P, et al., 2021. Multi-scenario simulation of ecosystem service value for optimization of land use in the Sichuan-Yunnan ecological barrier, China[J]. Ecological Indicators, 132: 108328. |
| [13] | LI W J, WANG Y, XIE S Y, et al., 2022. Spatiotemporal evolution scenarios and the coupling analysis of ecosystem health with land use change in Southwest China[J]. Ecological Engineering, 179: 106607. |
| [14] | LI Y F, ZHAN J Y, LIU Y, et al., 2018. Response of ecosystem services to land use and cover change: A case study in Chengdu City[J]. Resources, Conservation and Recycling, 132: 291-300. |
| [15] | LIANG X, GUAN Q F, CLARKE K C, et al., 2021. Understanding the drivers of sustainable land expansion using a patch-generating land use simulation (PLUS) model: A case study in Wuhan, China[J]. Computers Environment and Urban Systems, 85: 101569. |
| [16] | LIU D L, HAO S L, 2017. Ecosystem health assessment at county-scale using the pressure-state-response framework on the Loess Plateau, China[J]. International Journal of Environmental Research and Public Health, 14(1): 2. |
| [17] | LIU P J, HU Y C, JIA W T, 2021. Land use optimization research based on FLUS model and ecosystem services-setting Ji’nan City as an example[J]. Urban Climate, 40: 100984. |
| [18] | MENG L R, HUANG J, DONG J H, 2018. Assessment of rural ecosystem health and type classification in Jiangsu province, China[J]. Science of the Total Environment, 615: 1218-1228. |
| [19] | PAN Z Z, HE J H, LIU D F, et al., 2020. Predicting the joint effects of future climate and land use change on ecosystem health in the middle reaches of the Yangtze River Economic Belt, China[J]. Applied Geography, 124: 102293. |
| [20] | PENG J, LIU Y X, LI T Y, et al., 2017. Regional ecosystem health response to rural land use change: A case study in Lijiang City, China[J]. Ecological Indicators, 72: 399-410. |
| [21] | PENG J, LIU Y X, WU J S, et al., 2015. Linking ecosystem services and landscape patterns to assess urban ecosystem health: A case study in Shenzhen City, China[J]. Landscape and Urban Planning, 143: 56-68. |
| [22] | RAPPORT D J, 1989. What constitutes ecosystem health[J]. Perspectives in Biology and Medicine, 33(1): 120-132. |
| [23] | RAPPORT D J, COSTANZA R, MCMICHAEL A J, et al., 1998. Assessing ecosystem health[J]. Trends in Ecology & Evolution, 13(10): 397-402. |
| [24] | SHI M J, WU H Q, JIANG P A, et al., 2023. Food-water-land-ecosystem nexus in typical Chinese dryland under different future scenarios[J]. Science of the Total Environment, 880: 163183. |
| [25] | WANG Y, LI X M, ZHANG Q, et al., 2018. Projections of future land use changes: Multiple scenarios-based impacts analysis on ecosystem services for Wuhan city, China[J]. Ecological Indicators, 94(Part 1): 430-445. |
| [26] | WEAR S L, ACUNA V, MCDONALD R, et al., 2021. Sewage pollution, declining ecosystem health, and cross-sector collaboration[J]. Biological Conservation, 255: 109010. |
| [27] | WU J S, CHENG D J, XU Y Y, et al., 2021a. Spatial-temporal change of ecosystem health across China: Urbanization impact perspective[J]. Journal of Cleaner Production, 326(129): 129393. |
| [28] | WU Z, CHEN R S, MEADOWS M E, et al., 2021b. Application of the ocean health index to assess ecosystem health for the coastal areas of Shanghai, China[J]. Ecological Indicators, 126: 107650. |
| [29] | XIAO R, LIU Y, FEI X F, et al., 2019a. Ecosystem health assessment: A comprehensive and detailed analysis of the case study in coastal metropolitan region, eastern China[J]. Ecological Indicators, 98: 363-376. |
| [30] | XIAO R, YU X Y, SHI R X, et al., 2019b. Ecosystem health monitoring in the Shanghai-Hangzhou Bay Metropolitan Area: A hidden Markov modeling approach[J]. Environment International, 133(Part A): 105170. |
| [31] | XIAO Z L, LIU R, GAO Y H, et al., 2022. Spatiotemporal variation characteristics of ecosystem health and its driving mechanism in the mountains of southwest China[J]. Journal of Cleaner Production, 345: 131138. |
| [32] | XIE X, FANG B, XU H Z Y, et al., 2021. Study on the coordinated relationship between urban land use efficiency and ecosystem health in China[J]. Land Use Policy, 102: 105235. |
| [33] | YANG Y J, SONG G, LU S, 2020. Assessment of land ecosystem health with monte carlo simulation: A case study in Qiqihaer, China[J]. Journal of Cleaner Production, 250(12): 119522. |
| [34] | YANG Y L, WANG H, LI X B, et al., 2023. How will ecosystem carbon sequestration contribute to the reduction of regional carbon emissions in the future? analysis based on the MOP-PLUS model framework[J]. Ecological Indicators, 156: 111156. |
| [35] | ZHOU Y Y, YUE D X, LI S Y, et al., 2022. Ecosystem health assessment in debris flow-prone areas: A case study of Bailong River Basin in China[J]. Journal of Cleaner Production, 357: 131887. |
| [36] |
曹帅, 金晓斌, 杨绪红, 等, 2019. 耦合MOP与GeoSOS-FLUS模型的县级土地利用结构与布局复合优化[J]. 自然资源学报, 34(6): 1171-1185.
DOI |
|
CAO S, JIN X B, YANG X H, et al., 2019. Coupled MOP and GeoSOS-FLUS models research on optimization of land use structure and layout in Jintan district[J]. Journal of Natural Resources, 34(6): 1171-1185.
DOI |
|
| [37] | 陈宁, 辛存林, 唐道斌, 等, 2023. 中国西北地区多情景土地利用优化与碳储量评估[J]. 环境科学, 44(8): 4655-4665. |
| CHEN N, XIN C L, TANG D B, et al., 2023. Multi-scenario land use optimization and carbon storage assessment in Northwest China[J]. Environmental Science, 44(8): 4655-4665. | |
| [38] | 陈万旭, 赵雪莲, 钟明星, 等, 2022. 长江中游城市群生态系统健康时空演变特征分析[J]. 生态学报, 42(1): 138-149. |
| CHEN W X, ZHAO X L, ZHONG M X, et al., 2022. Spatiotemporal evolution patterns of ecosystem health in the Middle Reaches of the Yangtze River Agglomerations[J]. Ecologica Sinica, 42(1): 138-149. | |
| [39] | 陈瑶瑶, 徐亢, 刘源, 等, 2023. 草地畜牧业的生态效益与经济效益协同——以青海省玛多县为例[J]. 中国生态农业学报(中英文), 31(7): 1001-1011. |
| CHEN Y Y, XU K, LIU Y, et al., 2023. Synergy between ecological and economic benefits of grassland animal husbandry: Maduo County, Qinghai Province as an example[J]. Chinese Journal of Eco-Agriculture, 31(7): 1001-1011. | |
| [40] | 胡波洋, 张蓬涛, 白宁, 等, 2020. 基于CLUE-S和GMOP模型的青龙满族自治县土地利用情景模拟[J]. 中国农业资源与区划, 41(7): 173-182. |
| HU B Y, ZHANG P T, BAI N, et al., 2020. Land use scenario simulation in Qinglong Manchu Autonomous county based on CLUE-S and GMOP model[J]. Chinese Journal of Agricultural Resources and Regional Planning, 41(7): 173-182. | |
| [41] | 李魁明, 王晓燕, 姚罗兰, 2024. 京津冀地区生态系统健康时空演变及其影响因素[J]. 环境科学, 45(1): 218-227. |
| LI K M, WANG X Y, YAO L L, 2024. Spatial-temporal evolution of ecosystem health and its influencing factors in Beijing Tianjin-Hebei Region[J]. Environmental Science, 45(1): 218-227. | |
| [42] | 刘芳锐, 张正栋, 王欣怡, 等, 2023. 粤港澳大湾区生态系统健康时空变化及其对城镇化的响应[J]. 生态学报, 43(7): 2594-2604. |
| LIU F R, ZHANG Z D, WANG X Y, et al., 2023. Spatio-temporal variation of ecosystem health and its response to urbanization in the Guangdong-Hong Kong-Macao Greater Bay Area[J]. Acta Ecologica Sinica, 43(7): 2594-2604. | |
| [43] | 欧维新, 张伦嘉, 陶宇, 等, 2018. 基于土地利用变化的长三角生态系统健康时空动态研究[J]. 中国人口∙资源与环境, 28(5): 84-92. |
| OU W X, ZHANG L J, TAO Y, et al., 2018. A land-cover-based approach to assessing the spatio-temporal dynamics of ecosystem health in the Yangtze River Delta region[J]. China Population, Resources and Environment, 28(5): 84-92. | |
| [44] | 王保盛, 廖江福, 祝薇, 等, 2019. 基于历史情景的FLUS模型邻域权重设置——以闽三角城市群2030年土地利用模拟为例[J]. 生态学报, 39(12): 4284-4298. |
| WANG B S, LIAO J F, ZHU W, et al., 2019. The weight of neighborhood setting of the FLUS model based on a historical scenario: A case study of land use simulation of urban agglomeration of the Golden Triangle of Southern Fujian in 2030[J]. Ecologica Sinica, 39(12): 4284-4298. | |
| [45] | 谢高地, 甄霖, 鲁春霞, 等, 2008. 一个基于专家知识的生态系统服务价值化方法[J]. 自然资源学报, 23(5): 911-919. |
| XIE G D, ZHEN L, LU C X, et al., 2008. Expert knowledeg based valuation method of ecosystem services in China[J]. Journal of Natural Resources, 23(5): 911-919. | |
| [46] | 许静, 刘慧, 2024. 甘肃省生态系统服务权衡协同关系评估与预测[J]. 中国环境科学, 44(4): 1863-1874. |
| XU J, LIU H, 2024. Assessment and prediction of ecosystem services trade-offs and synergies relationships in Gansu Province[J]. China Environmental Science, 44(4): 1863-1874. | |
| [47] | 袁贞贞, 王秋红, 王勇, 等, 2023. 多情景模拟下重庆市土地利用变化对生态系统健康的影响[J]. 生态学报, 43(20): 8279-8291. |
| YUAN Z Z, WANG Q H, WANG Y, et al., 2023. Impacts of land use change on ecosystem health in Chongqing under multi-scenario simulation[J]. Ecologica Sinica, 43(20): 8279-8291. | |
| [48] | 张迪涛, 张鹏, 王司阳, 等, 2023. 基于微生物完整性指数的水生态系统健康评价——以武汉市东西湖区湖泊群为例[J]. 中国环境科学, 43(6): 3055-3067. |
| ZHANG D T, ZHANG P, WANG S Y, et al., 2023. Health assessment of aquatic ecosystem based on microbial integrity index: A case study on lakes in Dongxihu District of Wuhan[J]. China Environmental Science, 43(6): 3055-3067. | |
| [49] | 张波, 潘佩佩, 王新云, 等, 2023. 基于GMOP-PLUS耦合模型的京津冀土地利用变化多情景模拟及功能关系分析[J]. 地理与地理信息科学, 39(5): 8-16. |
| ZHANG B, PAN P P, WANG X Y, et al., 2023. Multi-scenario simulation and functional relationship analysis of land use change in Beijing-Tianjin-Hebei Region based on GMOP-PLUS coupling model[J]. Geography ang Geo-Information Science, 39(5): 8-16. | |
| [50] | 中华人民共和国自然资源部, 2019. 城镇开发边界划定指南(试行)[EB/OL]. [2019-6-5]. https://www.gov.cn/gongbao/content/2019.htm. |
| Ministry of Natural Resources of the People's Republic of China. 2019. Guidelines for the delineation of urban development boundaries (Trial)[EB/OL]. [2019-6-5]. https://www.gov.cn/gongbao/content/2019.htm. | |
| [51] | 周泉, 叶茂, 赵凡凡, 2021. 基于VOR模型的阿尔泰山林区森林生态系统健康评价[J]. 甘肃农业大学学报, 56(3): 137-148. |
| ZHOU Q, YE M, ZHAO F F, 2021. Ecosystem health assessment based on the VOR model analysis in forest area of Altai Mountains[J]. Journal of Gansu Agricultural University, 56(3): 137-148. |
| [1] | 高文明, 宋芊, 张皓翔, 王士如. 基于生态系统服务功能和保护动物栖息地适宜性评价的优先保护区选取——以三江源地区为例[J]. 生态环境学报, 2024, 33(8): 1318-1328. |
| [2] | 王雯, 侯青青, 裴婷婷. 甘肃河东地区坡度对生态系统服务的影响及其阈值效应[J]. 生态环境学报, 2024, 33(7): 1117-1129. |
| [3] | 张维琛, 王惺琪, 王博杰. 塔布河流域生态系统服务时空格局及影响因素分析[J]. 生态环境学报, 2024, 33(7): 1142-1152. |
| [4] | 向男, 王明旭, 张宏锋, 廖宝淦. 生态保护重要性分区及其长时间序列生境状况时空分异研究——以广东省为例[J]. 生态环境学报, 2024, 33(6): 958-968. |
| [5] | 王鹭莹, 李小马, 甘德欣, 刘鹏翱, 郭胜, 李毅. 长株潭城市群生态系统服务权衡与协同关系的空间异质性及其驱动因素[J]. 生态环境学报, 2024, 33(6): 969-979. |
| [6] | 杨非凡, 何浩. 基于“EVI-ESV”伊犁河谷生态环境评估及生态分区构建[J]. 生态环境学报, 2024, 33(4): 655-664. |
| [7] | 李荣杰, 李惠梅, 武非非, 赵明德, 王诗涵, 孙雪颖. 青海湖流域生态系统服务空间分异规律及驱动力研究[J]. 生态环境学报, 2024, 33(2): 301-309. |
| [8] | 李惠梅, 李荣杰, 晏旭昇, 武非非, 高泽兵, 谭永忠. 青海湖流域生态风险评价及生态功能分区研究[J]. 生态环境学报, 2023, 32(7): 1185-1195. |
| [9] | 徐梓津, 张雪松, 陈明曼. 山地岩溶区生态系统服务时空演变特征分析——以贵州省为例[J]. 生态环境学报, 2023, 32(7): 1196-1206. |
| [10] | 王琳, 卫伟. 黄土高原典型县域生态系统服务变化特征及驱动因素[J]. 生态环境学报, 2023, 32(6): 1140-1148. |
| [11] | 许静, 廖星凯, 甘崎旭, 周茅先. 基于MSPA与电路理论的黄河流域甘肃段生态安全格局构建[J]. 生态环境学报, 2023, 32(4): 805-813. |
| [12] | 张平江, 党国锋. 基于MCR模型与蚁群算法的洮河流域生态安全格局构建[J]. 生态环境学报, 2023, 32(3): 481-491. |
| [13] | 朱锦维, 柯新利, 何利杰, 周婷, 王青, 任妍钰. 基于价值链理论的生态产品价值实现机制理论解析[J]. 生态环境学报, 2023, 32(2): 421-428. |
| [14] | 丁诗雨, 贾夏, 赵永华, 钱会, 王欢元, 康宏亮, 孙婴婴. 秦巴山生态功能区生态系统服务供需关系时空演变研究[J]. 生态环境学报, 2023, 32(12): 2236-2248. |
| [15] | 郑晓豪, 陈颖彪, 郑子豪, 郭城, 黄卓男, 周泳诗. 湖北省生态系统服务价值动态变化及其影响因素演变[J]. 生态环境学报, 2023, 32(1): 195-206. |
| 阅读次数 | ||||||
|
全文 |
|
|||||
|
摘要 |
|
|||||