生态环境学报 ›› 2023, Vol. 32 ›› Issue (7): 1196-1206.DOI: 10.16258/j.cnki.1674-5906.2023.07.003
徐梓津1,2( ), 张雪松1, 陈明曼3
收稿日期:2023-03-28
出版日期:2023-07-18
发布日期:2023-09-27
作者简介:徐梓津(1987年生),女,博士,研究方向为土地资源与空间规划。E-mail: xuzijin1856@163.com
基金资助:
XU Zijin1,2(), ZHANG Xuesong1, CHEN Mingman3
Received:2023-03-28
Online:2023-07-18
Published:2023-09-27
摘要:
从水平空间与纵向空间对山地岩溶区开展长时序的生态系统服务演变研究可以增进对山地岩溶区生态系统发展演变规律的理解,为山地岩溶区生态保护政策和石漠化防止措施的制定提供科学参考,对区域可持续发展具有重要意义。基于InVEST模型,实现了2000-2020年研究区陆地生态系统服务产水量、土壤保持与生境质量功能的定量评估,并揭示研究区在水平空间和纵向空间的生态系统服务功能变化特征,更为立体的了解山地岩溶区生态系统服务功能变化特点。研究结果表明,(1)2000-2020年,研究区土地利用类型变化最大的为建设用地,变化最小的为耕地。(2)从水平空间看,不同土地利用类型的产水量、土壤保持及生境质量功能存在显著差异。2000-2020年间,研究区裸地的单位面积产水量最高,林地单位面积产水量最低。土壤保持功能则与之相反,表现出林地单位面积土壤保持量最高而裸地单位面积土壤保持量最低。建设用地与裸地的生境质量均较低。(3)从纵向空间看,产水量、土壤保持和生境质量功能在不同海拔等级具有显著的空间异质性。2000-2020年,研究区产水量与土壤保持功能均表现出随海拔升高而波动式降低的变化特点;生境质量随海拔上升呈现出先下降后上升(浅U型)的分布特征。(4)根据研究结果,研究区生态保护及石漠化防治政策和措施应重点关注裸地、建设用地和林地,同时也应关注不同海拔等级各类生态系统服务功能变化特点,必要时可以对高海拔和低海拔区域实施有差别的生态保护措施。这些发现可为山地岩溶区的生态可持续性提供更切实可行的措施,并为其他类似地区提供参考。
中图分类号:
徐梓津, 张雪松, 陈明曼. 山地岩溶区生态系统服务时空演变特征分析——以贵州省为例[J]. 生态环境学报, 2023, 32(7): 1196-1206.
XU Zijin, ZHANG Xuesong, CHEN Mingman. Analysis of Spatiotemporal Evolution Characteristics of Ecosystem Services in Mountainous Karst Areas: A Case Study of Guizhou Province, China[J]. Ecology and Environment, 2023, 32(7): 1196-1206.
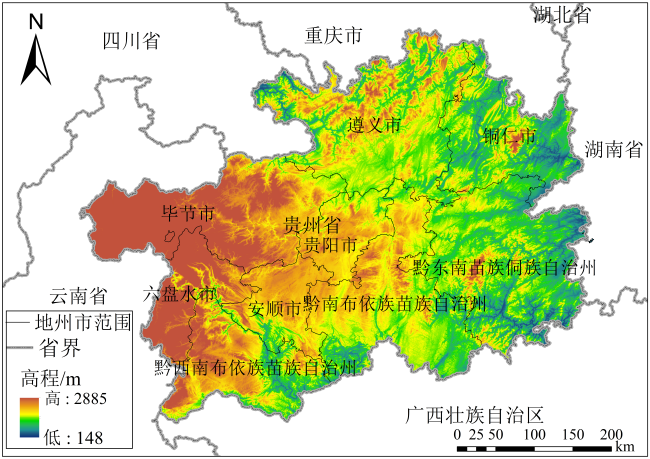
图1 研究区位置示意图
Figure 1 Location diagram of study area
| 海拔梯度 | 海拔/m | 面积占比/% | 海拔梯度 | 海拔/m | 面积占比/% | 海拔梯度 | 海拔/m | 面积占比/% |
|---|---|---|---|---|---|---|---|---|
| 1 | 148-300 | 0.13 | 10 | 1100-1200 | 7.98 | 19 | 2000-2100 | 1.27 |
| 2 | 300-400 | 1.42 | 11 | 1200-1300 | 8.66 | 20 | 2100-2200 | 1.20 |
| 3 | 400-500 | 3.26 | 12 | 1300-1400 | 7.00 | 21 | 2200-2300 | 1.06 |
| 4 | 500-600 | 5.04 | 13 | 1400-1500 | 4.67 | 22 | 2300-2400 | 0.71 |
| 5 | 600-700 | 6.92 | 14 | 1500-1600 | 3.33 | 23 | 2400-2500 | 0.35 |
| 6 | 700-800 | 8.41 | 15 | 1600-1700 | 2.59 | 24 | 2500-2600 | 0.15 |
| 7 | 800-900 | 10.4 | 16 | 1700-1800 | 2.25 | 25 | 2600-2700 | 0.06 |
| 8 | 900-1000 | 10.4 | 17 | 1800-1900 | 2.04 | 26 | 2700-2800 | 0.02 |
| 9 | 1000-1100 | 9.07 | 18 | 1900-2000 | 1.59 | 27 | 2800-2855 | 0.00 |
表1 研究区海拔分级及各海拔等级面积占比
Table 1 Altitude classification and area proportion of each altitude level in the study area
| 海拔梯度 | 海拔/m | 面积占比/% | 海拔梯度 | 海拔/m | 面积占比/% | 海拔梯度 | 海拔/m | 面积占比/% |
|---|---|---|---|---|---|---|---|---|
| 1 | 148-300 | 0.13 | 10 | 1100-1200 | 7.98 | 19 | 2000-2100 | 1.27 |
| 2 | 300-400 | 1.42 | 11 | 1200-1300 | 8.66 | 20 | 2100-2200 | 1.20 |
| 3 | 400-500 | 3.26 | 12 | 1300-1400 | 7.00 | 21 | 2200-2300 | 1.06 |
| 4 | 500-600 | 5.04 | 13 | 1400-1500 | 4.67 | 22 | 2300-2400 | 0.71 |
| 5 | 600-700 | 6.92 | 14 | 1500-1600 | 3.33 | 23 | 2400-2500 | 0.35 |
| 6 | 700-800 | 8.41 | 15 | 1600-1700 | 2.59 | 24 | 2500-2600 | 0.15 |
| 7 | 800-900 | 10.4 | 16 | 1700-1800 | 2.25 | 25 | 2600-2700 | 0.06 |
| 8 | 900-1000 | 10.4 | 17 | 1800-1900 | 2.04 | 26 | 2700-2800 | 0.02 |
| 9 | 1000-1100 | 9.07 | 18 | 1900-2000 | 1.59 | 27 | 2800-2855 | 0.00 |
| 土地利用类型 | 2000年 | 2005年 | 2010年 | 2015年 | 2020年 | 2000-2020年变化面积 | 变化率 |
|---|---|---|---|---|---|---|---|
| 耕地 | 4.96×10⁶ | 4.98×10⁶ | 4.94×10⁶ | 4.91×10⁶ | 4.95×10⁶ | -0.01×10⁶ | -0.201% |
| 林地 | 9.35×10⁶ | 9.48×10⁶ | 9.55×10⁶ | 9.54×10⁶ | 9.41×10⁶ | 0.06×10⁶ | 6.41% |
| 草地 | 3.19×10⁶ | 3.04×10⁶ | 2.96×10⁶ | 2.95×10⁶ | 2.88×10⁶ | -0.31×10⁶ | -9.72% |
| 湿地 | 804 | 810 | 484 | 680 | 2.38×10³ | 158×103 | 196% |
| 水域 | 4.03×10⁴ | 4.08×10⁴ | 6.87×10⁴ | 6.97×10⁴ | 7.06×10⁴ | 3.03×10⁴ | 75.2% |
| 建设用地 | 6.01×10⁴ | 6.24×10⁴ | 8.74×10⁴ | 13.2×10⁴ | 28.3×10⁴ | 22.3×10⁴ | 371% |
| 裸地 | 4×10³ | 3.21×10³ | 2.99×10³ | 3.15×10³ | 3.7×10³ | -300 | -7.5% |
表2 研究区2000-2020年土地利用类型面积变化
Table 2 Land use type area change in the study area from 2000 to 2020 hm2
| 土地利用类型 | 2000年 | 2005年 | 2010年 | 2015年 | 2020年 | 2000-2020年变化面积 | 变化率 |
|---|---|---|---|---|---|---|---|
| 耕地 | 4.96×10⁶ | 4.98×10⁶ | 4.94×10⁶ | 4.91×10⁶ | 4.95×10⁶ | -0.01×10⁶ | -0.201% |
| 林地 | 9.35×10⁶ | 9.48×10⁶ | 9.55×10⁶ | 9.54×10⁶ | 9.41×10⁶ | 0.06×10⁶ | 6.41% |
| 草地 | 3.19×10⁶ | 3.04×10⁶ | 2.96×10⁶ | 2.95×10⁶ | 2.88×10⁶ | -0.31×10⁶ | -9.72% |
| 湿地 | 804 | 810 | 484 | 680 | 2.38×10³ | 158×103 | 196% |
| 水域 | 4.03×10⁴ | 4.08×10⁴ | 6.87×10⁴ | 6.97×10⁴ | 7.06×10⁴ | 3.03×10⁴ | 75.2% |
| 建设用地 | 6.01×10⁴ | 6.24×10⁴ | 8.74×10⁴ | 13.2×10⁴ | 28.3×10⁴ | 22.3×10⁴ | 371% |
| 裸地 | 4×10³ | 3.21×10³ | 2.99×10³ | 3.15×10³ | 3.7×10³ | -300 | -7.5% |
| LUCC | 2000年 | 2005年 | 2010年 | 2015年 | 2020年 | |||||||||
|---|---|---|---|---|---|---|---|---|---|---|---|---|---|---|
| 产水量/ 109 m3 | 单位面积产水量/ (104m3·hm-2) | 产水量/ 109 m3 | 单位面积产水量/ (104m3·hm-2) | 产水量/ 109 m3 | 单位面积产水量/ (104m3·hm-2) | 产水量/ 109 m3 | 单位面积产水量/ (104m3·hm-2) | 产水量/ 109 m3 | 单位面积产水量/ (104m3·hm-2) | |||||
| 耕地 | 46.9 | 0.948 | 32.2 | 0.646 | 39.2 | 0.794 | 58.5 | 1.19 | 32.9 | 0.664 | ||||
| 林地 | 53.2 | 0.569 | 28.7 | 0.303 | 39.7 | 0.416 | 74.9 | 0.785 | 28.1 | 0.299 | ||||
| 草地 | 23.3 | 0.729 | 13.9 | 0.456 | 17.4 | 0.587 | 29.5 | 1 | 17.5 | 0.609 | ||||
| 湿地 | 0.008 | 0.941 | 0.004 | 0.512 | 0.003 | 0.685 | 0.007 | 0.998 | 0.014 | 0.583 | ||||
| 水域 | 0 | 0 | 0 | 0 | 0 | 0 | 0 | 0 | 0 | 0 | ||||
| 建设用地 | 0.76 | 1.26 | 0.571 | 0.915 | 0.752 | 0.860 | 2.46 | 1.86 | 2.77 | 0.979 | ||||
| 裸地 | 0.056 | 1.4 | 0.037 | 1.15 | 0.041 | 1.37 | 0.035 | 1.68 | 0.038 | 1.03 | ||||
表3 2000-2020年贵州省各土地利用类型产水量及单位面积产水量
Table 3 Water production and unit area water production of various land use types in Guizhou province from 2000 to 2020
| LUCC | 2000年 | 2005年 | 2010年 | 2015年 | 2020年 | |||||||||
|---|---|---|---|---|---|---|---|---|---|---|---|---|---|---|
| 产水量/ 109 m3 | 单位面积产水量/ (104m3·hm-2) | 产水量/ 109 m3 | 单位面积产水量/ (104m3·hm-2) | 产水量/ 109 m3 | 单位面积产水量/ (104m3·hm-2) | 产水量/ 109 m3 | 单位面积产水量/ (104m3·hm-2) | 产水量/ 109 m3 | 单位面积产水量/ (104m3·hm-2) | |||||
| 耕地 | 46.9 | 0.948 | 32.2 | 0.646 | 39.2 | 0.794 | 58.5 | 1.19 | 32.9 | 0.664 | ||||
| 林地 | 53.2 | 0.569 | 28.7 | 0.303 | 39.7 | 0.416 | 74.9 | 0.785 | 28.1 | 0.299 | ||||
| 草地 | 23.3 | 0.729 | 13.9 | 0.456 | 17.4 | 0.587 | 29.5 | 1 | 17.5 | 0.609 | ||||
| 湿地 | 0.008 | 0.941 | 0.004 | 0.512 | 0.003 | 0.685 | 0.007 | 0.998 | 0.014 | 0.583 | ||||
| 水域 | 0 | 0 | 0 | 0 | 0 | 0 | 0 | 0 | 0 | 0 | ||||
| 建设用地 | 0.76 | 1.26 | 0.571 | 0.915 | 0.752 | 0.860 | 2.46 | 1.86 | 2.77 | 0.979 | ||||
| 裸地 | 0.056 | 1.4 | 0.037 | 1.15 | 0.041 | 1.37 | 0.035 | 1.68 | 0.038 | 1.03 | ||||
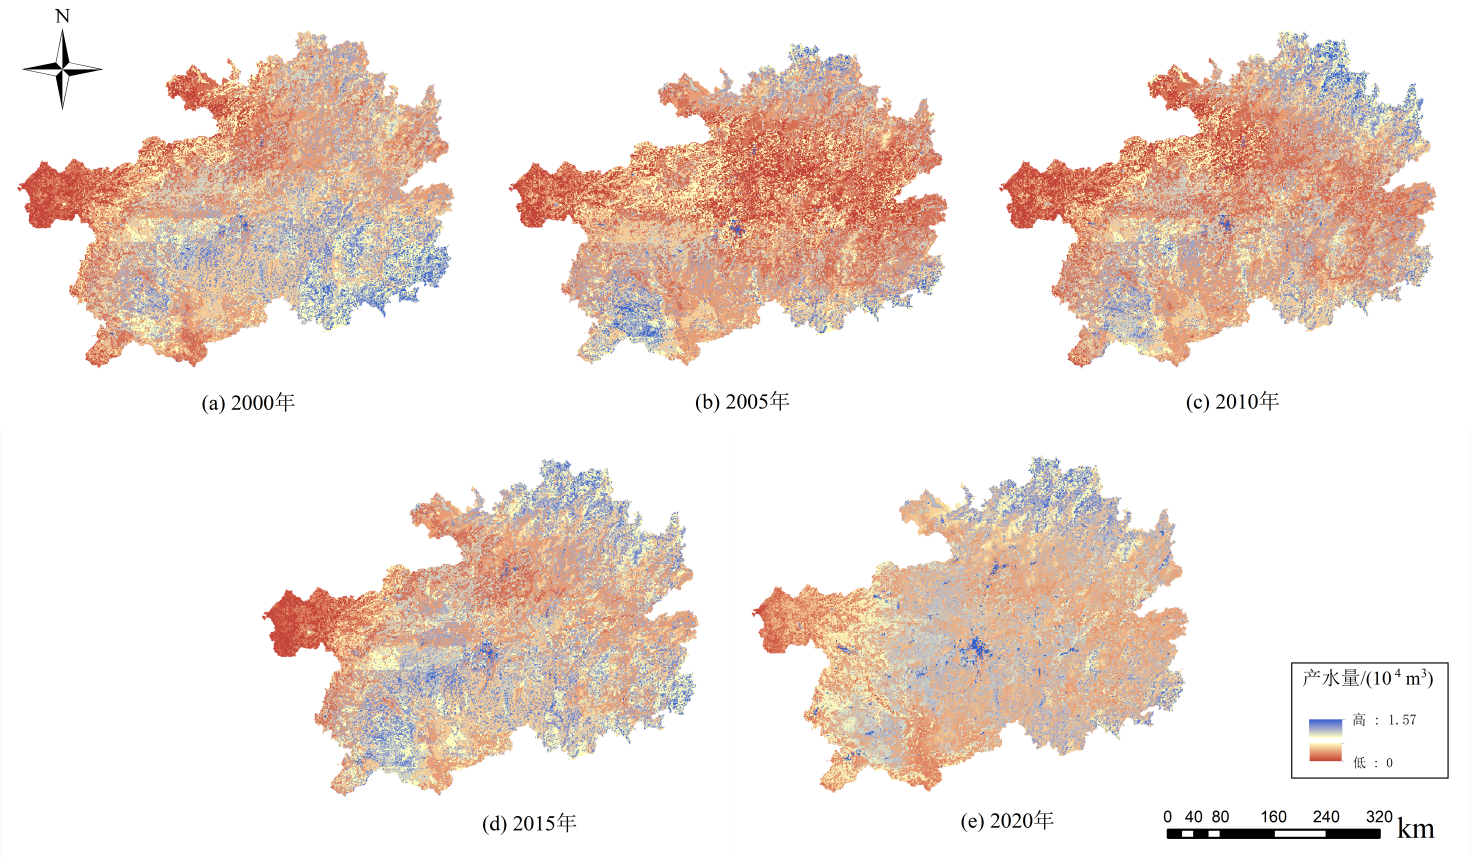
图2 2000-2020年研究区产水功能时空分布
Figure 2 Temporal and spatial distribution of water production function in the study area from 2000 to 2020
| LUCC | 2000年 | 2005年 | 2010年 | 2015年 | 2020年 | |||||||||
|---|---|---|---|---|---|---|---|---|---|---|---|---|---|---|
| 土壤保持量/ 109 t | 单位面积 土壤保持量/ (105 t·hm-2) | 土壤保持量/ 109 t | 单位面积 土壤保持量/ (105 t·hm-2) | 土壤保持量/ 109 t | 单位面积 土壤保持量/ (105 t·hm-2) | 土壤保持量/ 1010 t | 单位面积 土壤保持量/ (105 t·hm-2) | 土壤保持量/ 109t | 单位面积 土壤保持量/ (105 t·hm-2) | |||||
| 耕地 | 433 | 0.873 | 316 | 0.635 | 379 | 0.767 | 56.4 | 0.115 | 391 | 0.789 | ||||
| 林地 | 862 | 0.922 | 627 | 0.661 | 761 | 0.797 | 113 | 0.118 | 799 | 0.849 | ||||
| 草地 | 281 | 0.882 | 186 | 0.611 | 206 | 0.697 | 30.4 | 0.103 | 220 | 0.764 | ||||
| 湿地 | 0.046 | 0.569 | 0.044 | 0.542 | 0.028 | 0.519 | 0.068 | 0.999 | 0.164 | 0.687 | ||||
| 水域 | 0 | 0 | 0 | 0 | 0 | 0 | 0 | 0 | 0 | 0 | ||||
| 建设用地 | 2.61 | 0.434 | 1.78 | 0.285 | 2.73 | 0.312 | 0.984 | 0.075 | 8.78 | 0.311 | ||||
| 裸地 | 0.292 | 0.73 | 0.198 | 0.617 | 0.23 | 0.769 | 0.034 | 0.108 | 0.282 | 0.762 | ||||
表4 研究期内贵州省不同土地利用类型土壤保持量及单位面积土壤保持量
Table 4 Soil conservation of different land use types and soil conservation per unit area in Guizhou Province during the study period
| LUCC | 2000年 | 2005年 | 2010年 | 2015年 | 2020年 | |||||||||
|---|---|---|---|---|---|---|---|---|---|---|---|---|---|---|
| 土壤保持量/ 109 t | 单位面积 土壤保持量/ (105 t·hm-2) | 土壤保持量/ 109 t | 单位面积 土壤保持量/ (105 t·hm-2) | 土壤保持量/ 109 t | 单位面积 土壤保持量/ (105 t·hm-2) | 土壤保持量/ 1010 t | 单位面积 土壤保持量/ (105 t·hm-2) | 土壤保持量/ 109t | 单位面积 土壤保持量/ (105 t·hm-2) | |||||
| 耕地 | 433 | 0.873 | 316 | 0.635 | 379 | 0.767 | 56.4 | 0.115 | 391 | 0.789 | ||||
| 林地 | 862 | 0.922 | 627 | 0.661 | 761 | 0.797 | 113 | 0.118 | 799 | 0.849 | ||||
| 草地 | 281 | 0.882 | 186 | 0.611 | 206 | 0.697 | 30.4 | 0.103 | 220 | 0.764 | ||||
| 湿地 | 0.046 | 0.569 | 0.044 | 0.542 | 0.028 | 0.519 | 0.068 | 0.999 | 0.164 | 0.687 | ||||
| 水域 | 0 | 0 | 0 | 0 | 0 | 0 | 0 | 0 | 0 | 0 | ||||
| 建设用地 | 2.61 | 0.434 | 1.78 | 0.285 | 2.73 | 0.312 | 0.984 | 0.075 | 8.78 | 0.311 | ||||
| 裸地 | 0.292 | 0.73 | 0.198 | 0.617 | 0.23 | 0.769 | 0.034 | 0.108 | 0.282 | 0.762 | ||||
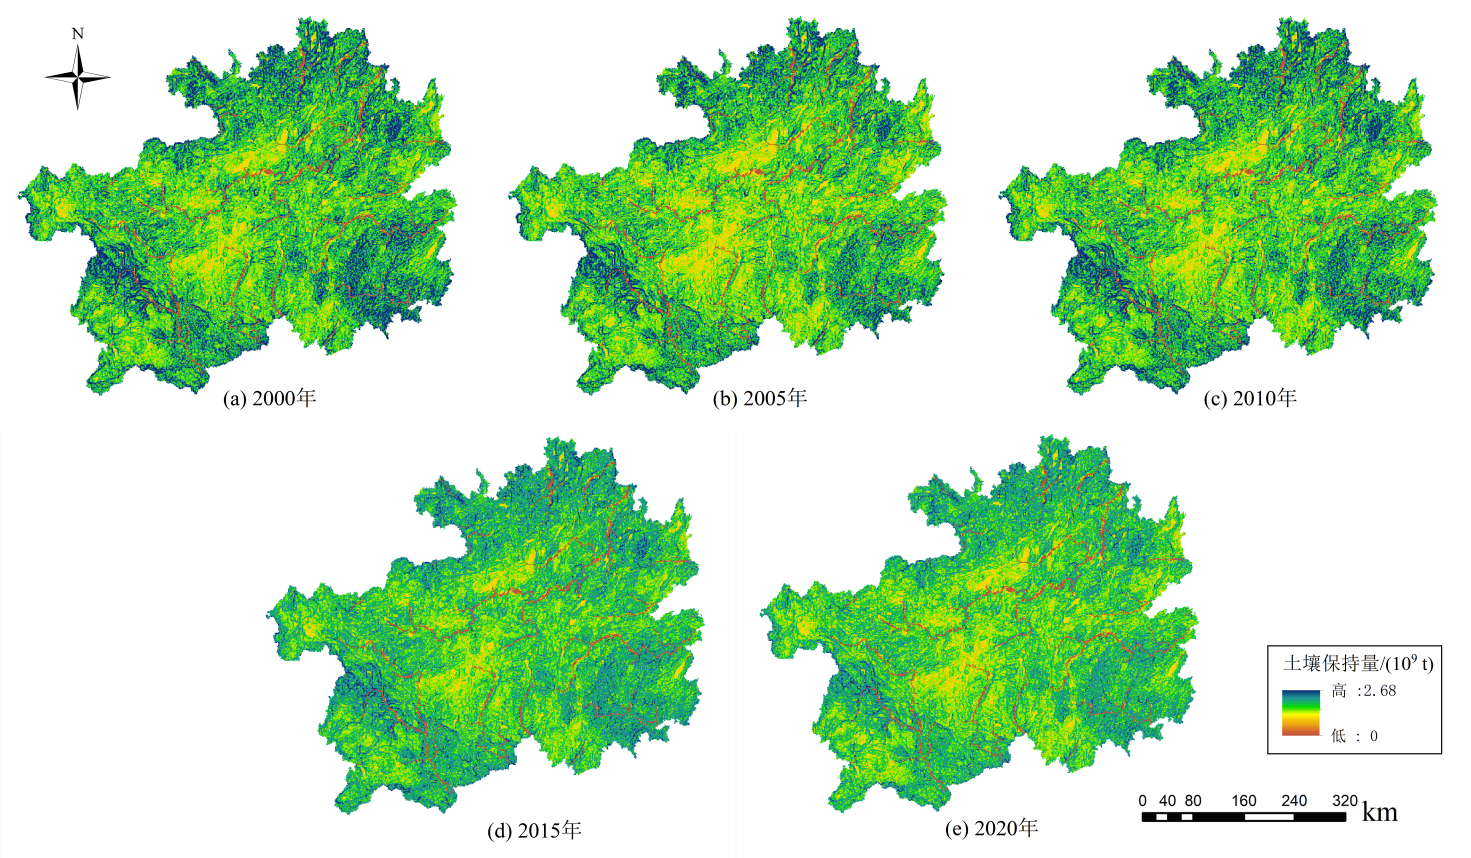
图3 2000-2020年研究区土壤保持功能时空分布
Figure 3 Temporal and spatial distribution of soil conservation function in the study area from 2000 to 2020
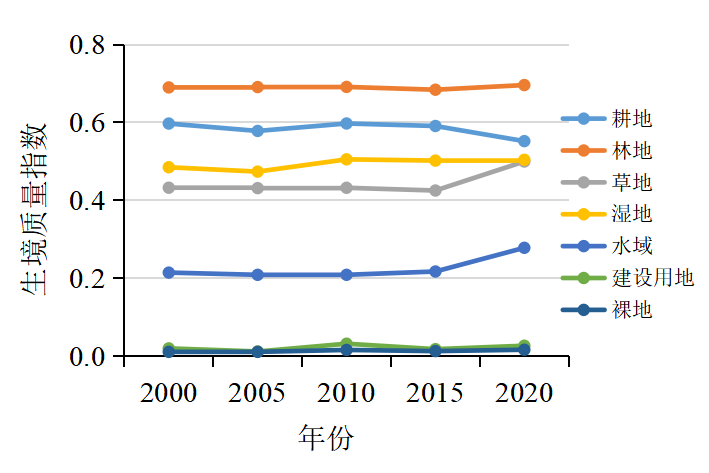
图4 不同土地利用类型的生境质量指数
Figure 4 Habitat quality index for different land use types
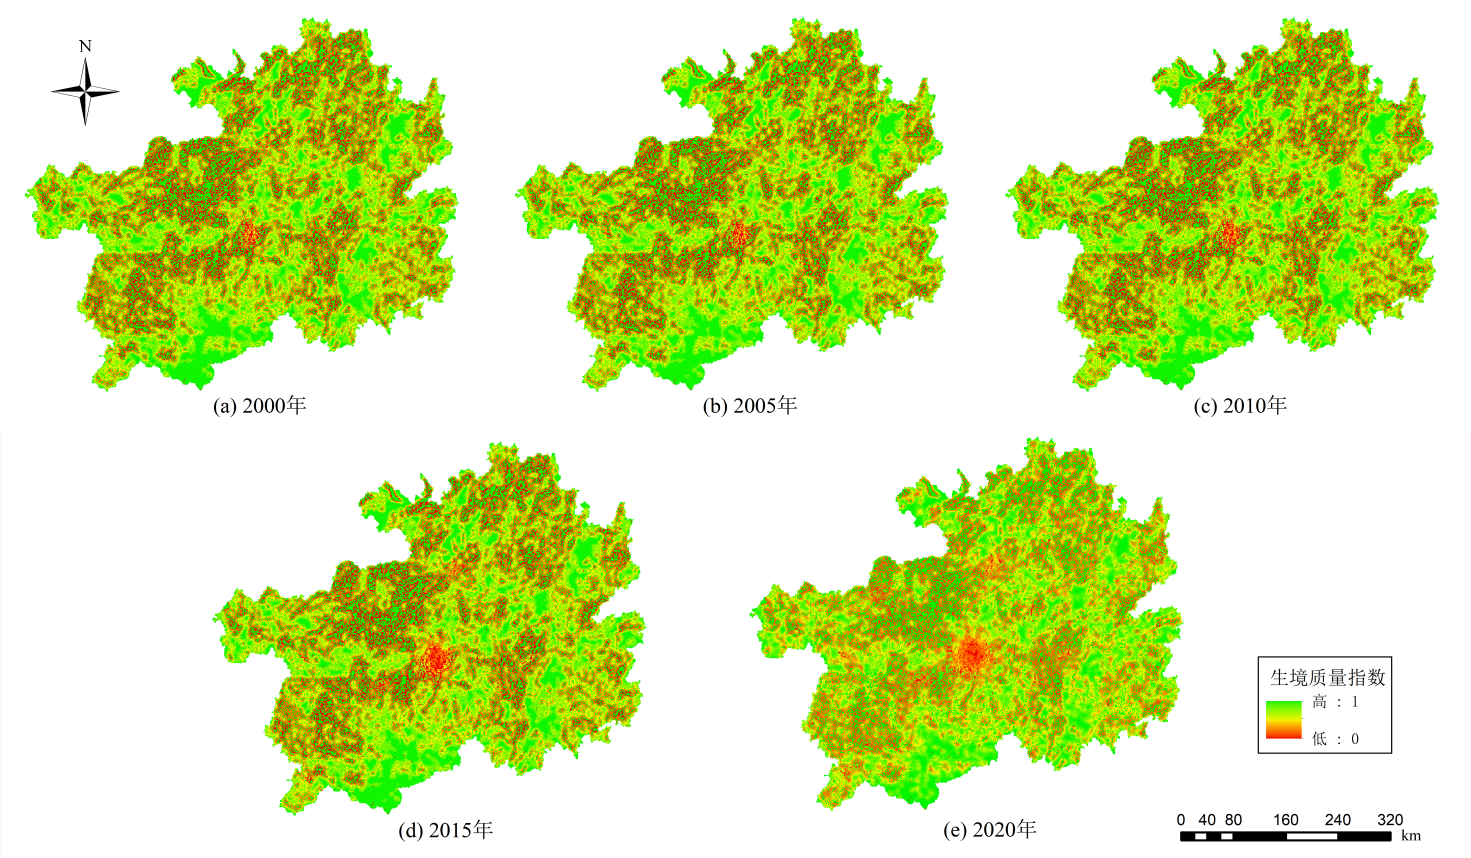
图5 2000-2020年研究区生境质量时空分布
Figure 5 Temporal and spatial distribution of habitat quality in the study area from 2000 to 2020
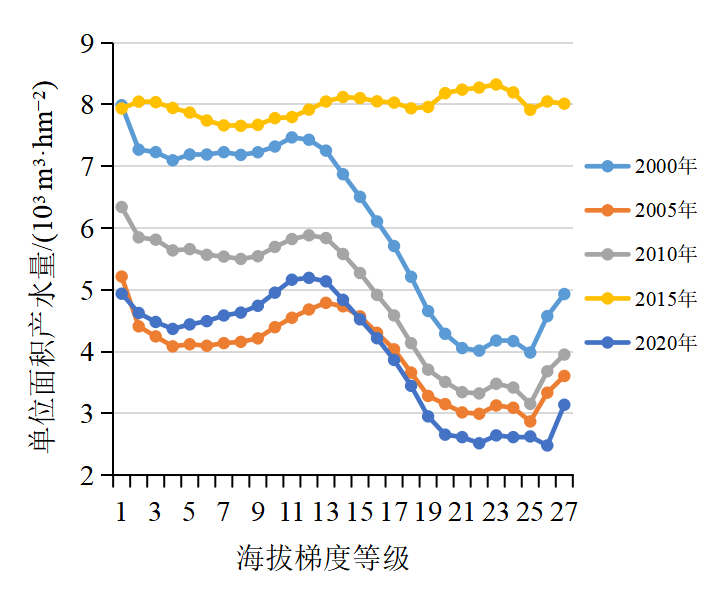
图6 2000-2020年研究区不同海拔等级单位面积产水量
Figure 6 Water yield per unit area at different altitudes in the study area from 2000 to 2020
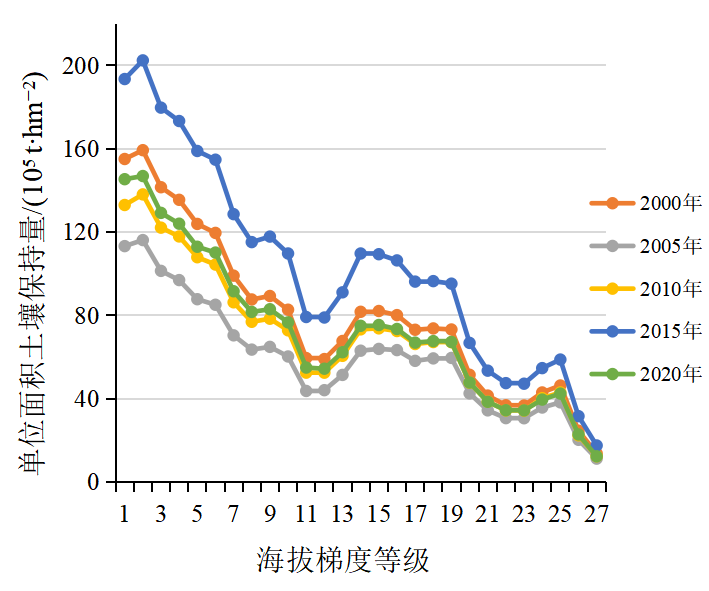
图7 研究期贵州省不同海拔等级单位面积土壤保持量
Figure 7 Soil conservation per unit area at different altitudes in Guizhou Province during the study period
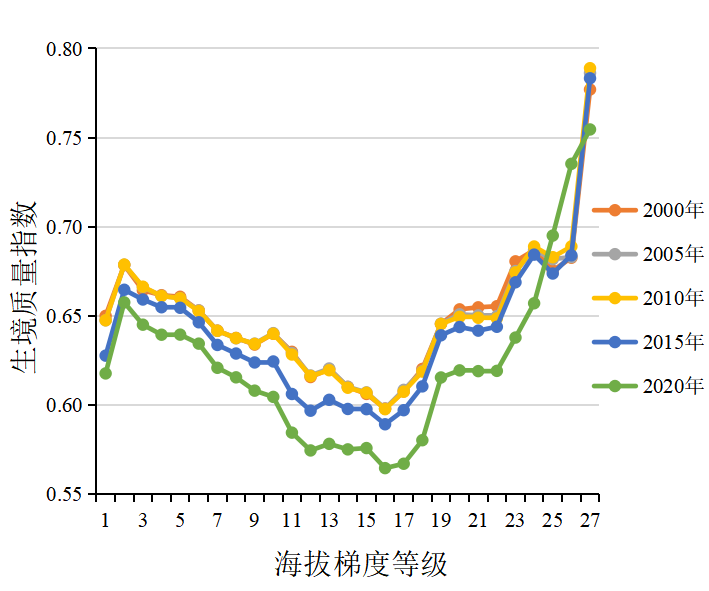
图8 2000-2020年研究区不同海拔等级生境质量
Figure 8 Habitat quality at different altitudes in the study area from 2000 to 2020
| [1] |
ANSELIN L, 1995. Local indicators of spatial association-LISA[J]. Geographical Analysis, 27(2): 93-115.
DOI URL |
| [2] | BENNETT E M, PETERSON G D, GORDON L J, 2009. Understanding relationships among multiple ecosystem services[J]. Ecology Letters, 2(12): 1394-1404. |
| [3] |
CLERICIA N, NAVARRO F C, ESCOBEDO F J, et al., 2019. Spatio-temporal and cumulative effects of land use-land cover and climate change on two ecosystem services in the Colombian Andes[J]. Science of the Total Environment, 685: 1181-1192.
DOI URL |
| [4] | DAILY G C, POLASKY S, GOLDSTEIN J, et al., 2009. Ecosystem services in decision making:time to deliver[J]. Frontiers in Ecology&the Environment, 7(1): 21-28. |
| [5] |
DING Y X, PENG S Z, 2020. Spatiotemporal Trends and Attribution of Drought across China from 1901-2100[J]. Sustainability, 12(2): 477-448.
DOI URL |
| [6] |
DING Y X, PENG S Z, 2021. Spatiotemporal change and attribution of potential evapotranspiration over China from 1901 to 2100[J]. Theoretical and Applied Climatology, 145(1): 1-16.
DOI |
| [7] |
GAO Y, MA L, LIU J X, et al., 2017. Constructing ecological networks based on habitat quality assessment: A case study of Changzhou, China[J]. Scientific Reports, 7(1): 46073.
DOI URL |
| [8] |
KOU Z X, YAO Y H, HU Y F, et al., 2020. Discussion on position of China's north-south transitional zone by comparative analysis of mountain altitudinal belts[J]. Journal of Mountain Science, 17(8): 1901-1915.
DOI |
| [9] | LI X, YU X, WU K N, et al., 2021. Land- use zoning management to protecting the regional key ecosystem services: A case study in the city belt along the Chaobai River, China[J]. Science of the Total Environment, 762: 143-167. |
| [10] | Millenniu Ecosyste Assessment, 2005. Ecosystems and human well-being: Synthesis[M]. Washington (DC): Island Press:52. |
| [11] |
PENG S Z, DING Y X, LIU W Z, et al., 2019. 1 km monthly temperature and precipitation dataset for China from 1901 to 2017[J]. Earth System Science Data, 11(4): 1931-1946.
DOI URL |
| [12] |
TIAN Y C, WANG S J, BAI X Y, et al., 2016. Trade-offs among ecosystem services in a typical Karst watershed, SW China[J]. Science of the Total Environment, 566-567: 1297-1308.
DOI URL |
| [13] | WISCHMEIER W H, SMITH D D, 1965. Predicting Rainfall Erosion Losses from Cropland Eastof the Rocky Mountains Agricultural Handbook[M]. Washington D. C: USDA: 282. |
| [14] |
WILLIAMS J R, ARNOLD J G, 1997. A system of erosion-sediment yield models[J]. Soil Technology, 11(1): 43-55.
DOI URL |
| [15] |
YANG J, HUANG X, 2021. The 30 m annual land cover dataset and its dynamics in China from 1990 to 2019[J]. Earth System Science Data, 13(8): 3907-3925.
DOI URL |
| [16] |
ZHANG X R, ZHOU J, LI G N, et al., 2020a. Spatial pattern reconstruction of regional habitat quality based on the simulation of land use changes from 1975 to 2010[J]. Journal of Geographical Sciences, 30(12): 601-620.
DOI |
| [17] |
ZHANG X R, SONG W, LANG Y Q, et al., 2020b. Land use changes in the coastal zone of China’s Hebei Province and the corresponding impacts on habitat quality[J]. Land Use Policy, 99: 104957.
DOI URL |
| [18] | World Resources Institute(WRI), United Nations Development Programme (UNDP), United Nations Environment Programme (UNEP), et al., 2003. World Resources 2002-2004: Decisions for the Earth-Balance, Voice and Power[M]. Washington D.C: WRI: 26. |
| [19] |
ZHANG X S, XU Z J, 2021. Functional coupling degree and human activity intensity of production-living-ecological space in underdeveloped regions in China: Case study of Guizhou province[J]. Land, 10(1): 56.
DOI URL |
| [20] | 包玉斌, 刘康, 李婷, 等, 2015. 基于InVEST模型的土地利用变化对生境的影响——以陕西省黄河湿地自然保护区为例[J]. 干旱区研究, 32(3): 622-629. |
| BAO Y B, LIU K, LI T, et al., 2015. The impact of land use change on habitat based on the InVEST Model: A case study of the Yellow River Wetland Nature Reserve in Shaanxi Province[J]. Arid Area Research, 32(3): 622-629. | |
| [21] | 贵州省统计局, 2021. 贵州统计年鉴[M]. 北京: 中国统计出版社:197. |
| Guizhou Provincial Bureau of Statistics, 2021. Guizhou Statistical Yearbook[M]. Beijing: China Statistics Press:197. | |
| [22] | 贵州省统计局, 2021. 贵州省第七次全国人口普查公报 (第一号)[R]. 贵阳: 贵州省统计局:3. |
| Guizhou Provincial Bureau of Statistics, 2021. Bulletin of the seventh national population Census of Guizhou province (No.1)[R]. Guiyang: Guizhou Provincial Bureau of Statistics: 3. | |
| [23] | 贵州省人民政府, 2021. 自然地理[EB/OL]. (2021-09-14). http://www.guizhou.gov.cn/dcgz/gzgk/dl/202109/t20210914_70397096.html. |
| Guizhou Provincial People's Government, 2021. Physical Geography [EB/OL]. (2021-09-14). http://www.guizhou.gov.cn/dcgz/gzgk/dl/202109/t20210914_70397096.html. | |
| [24] |
高江波, 张怡博, 左丽媛, 2022. 喀斯特山地土壤侵蚀和产水量的最优解释力[J]. 地理学报, 77(11): 2920-2934.
DOI |
| GAO J B, ZHANG Y B, ZUO L Y, 2022. Optimal explanatory power of soil erosion and water yield in Karst mountainous areas[J]. Journal of Geography, 77(11): 2920-2934. | |
| [25] | 高江波, 左丽媛, 王欢, 2019. 喀斯特峰丛洼地生态系统服务空间权衡度及其分异特征[J]. 生态学报, 39(21): 7829-7839. |
| GAO J B, ZUO L Y, WANG H, 2019. The spatial trade-offs and differentiation characteristics of ecosystem services in Karst peak-cluster Depression[J]. Acta Ecologica Sinica, 39(21): 7829-7839. | |
| [26] | 李阳兵, 王世杰, 周德全, 2005. 茂兰岩溶森林的生态服务研究[J]. 地球与环境, 33(2): 39-44. |
| LI Y B, WANG S J, ZHOU D Q, 2005. Study on ecological services of Maolan Karst forest[J]. Earth and Environment, 33 (2): 39-44. | |
| [27] | 林清山, 洪伟, 吴承祯, 等, 2010. 永春县柑橘林生态系统的碳储量及其动态变化[J]. 生态学报, 30(2): 309-316. |
| LIN Q S, HONG W, WU C Z, et al., 2010. Carbon storage and dynamic change of citrus forest ecosystem in Yongchun County[J]. Journal of Ecology, 30(2): 309-316. | |
| [28] | 刘世梁, 董玉红, 孙永秀, 等, 2019. 基于生态系统服务提升的山水林田湖草优先区分析——以贵州省为例[J]. 生态学报, 39(23): 8957-8965. |
| LIU S L, DONG Y H, SUN Y X, et al., 2019. Analysis of priority areas of mountains, rivers, forests, fields, lakes, and grasses based on ecosystem service upgrading: Taking Guizhou Province as an example[J]. Journal of Ecology, 39(23): 8957-8965. | |
| [29] | 林子雁, 肖燚, 饶恩明, 等, 2020. 中国西南地区不同类型生态系统服务的关系[J]. 应用生态学报, 31(3): 978-986. |
| LIN Z Y, XIAO Y, RAO E M, et al., 2020. The relationship between different types of ecosystem services in southwest China[J]. Journal of Applied Ecology, 31(3): 978-986. | |
| [30] | 梁红柱, 刘丽丽, 付同刚, 等, 2022. 山地植被垂直分布变化格局研究进展与述评[J]. 中国生态农业学报 (中英文), 30(7): 1077-1090. |
| LIANG H Z, LIU L L, FU T G, et al., 2022. Vertical distribution of vegetation in mountain regions: A review based on bibliometrics[J]. Chinese Journal of Eco-Agriculture, 30(7): 1077-1090. | |
| [31] | 彭守璋, 2020. 中国1 km逐月潜在蒸散发数据集 (1990-2020)[C]. 北京: 国家青藏高原科学数据中心. |
| PENG S Z, 2020. China’s 1km Monthly Potential Evapotranspiration Data Set (1990-2020)[C]. Beijing: National Qinghai-Tibet Plateau Scientific Data Center. | |
| [32] | 史莎娜, 李晓青, 胡宝清, 2022. 喀斯特地域多功能理论及研究展望[J]. 经济地理, 42(2): 74-83. |
|
SHI S N, LI X Q, HU B Q, 2022. Multifunctional theory and research prospects of Karst regions[J]. Economic Geography, 42(2): 74-83.
DOI URL |
|
| [33] | 吴孔运, 蒋忠诚, 邓新辉, 等, 2008. 喀斯特石山区次生林恢复后生态服务价值评估——以广西壮族自治区马山县弄拉国家药物自然保护区为例[J]. 中国生态农业学报, 16(4): 1011-1014. |
| WU K Y, JIANG Z Z, DENG X H, et al., 2008. Evaluation of the value of ecological services after the restoration of secondary forests in Karst mountainous areas: A case study of the Nongla National Medicinal Nature Reserve in Mashan County, Guangxi Zhuang Autonomous Region[J]. Chinese Journal of Ecological Agriculture, 16 (4): 1011-1014. | |
| [34] | 王月容, 卢琦, 周金星, 2013. 贵州省岩溶石漠化地区生态服务价值损失评估[J]. 中国岩溶, 32(1): 88-94. |
| WANG Y R, LU Q, ZHOU J X, 2013. Assessment of ecological service value loss in Karst rocky desertification areas in Guizhou Province[J]. Karst China, 32(1): 88-94. | |
| [35] | 韦钧培, 杨云川, 谢鑫昌, 等, 2022. 基于服务簇的南宁市生态系统服务权衡与协同关系研究[J]. 生态与农村环境学报, 38(1): 21-31. |
| WEI J P, YANG Y C, XIE X C, et al., 2022. Study on the trade-off and synergy of ecosystem services in Nanning based on service clusters[J]. Journal of Ecology and Rural Environment, 38 (1): 21-31. | |
| [36] | 熊康宁, 李晋, 龙明忠, 2012. 典型喀斯特石漠化治理区水土流失特征与关键问题[J]. 地理学报, 67(7): 878-888. |
|
XIONG K L, LI J, LONG M Z, 2012. Features of soil and water loss and key issues in demonstration areas for combating Karst rocky desertification[J]. Acta Geographica Sinica, 67(7): 878-888.
DOI |
|
| [37] | 徐建宁, 2016. 基于InVEST模型的小江流域生态系统服务评估[D]. 兰州: 兰州交通大学:89. |
| XU J N, 2016. Assessment of ecosystem services in the Xiaojiang River Basin based on the InVEST model[D]. Lanzhou: Lanzhou Jiaotong University:89. | |
| [38] | 徐新良, 刘纪远, 张树文, 等, 2018. 中国多时期土地利用土地覆被遥感监测数据集[C]. 北京: 中国科学院资源环境科学数据中心数据. |
| XU X L, LIU J Y, ZHANG S W, et al., 2018. China Multi period Land Use and Land Cover Remote Sensing Monitoring Data Set[C]. Beijing: Data Registration and Publishing System of Resource and Environmental Science Data Center, Chinese Academy of Sciences. | |
| [39] | 徐烨, 2019. 云南小江流域生态系统服务功能评估和影响因子分析[D]. 北京: 中国地质科学院:103. |
| XU Y, 2019. Evaluation of Ecosystem Service Functions and Analysis of Impact Factors in the Xiaojiang River Basin in Yunnan Province[D]. Beijing: Chinese Academy of Geological Sciences:103. | |
| [40] | 张明阳, 王克林, 刘会玉, 等, 2011. 桂西北典型喀斯特区生态服务价值的环境响应及其空间尺度特征[J]. 生态学报, 31(14): 3947-3955. |
| ZHANG M Y, WANG L, LIU H Y, et al., 2011. Environmental response and spatial scale characteristics of ecological service value in typical Karst areas in northwest Guangxi[J]. Journal of Ecology, 31 (14): 3947-3955. | |
| [41] | 钟莉娜, 王军, 2017. 基于InVEST模型评估土地整治对生境质量的影响[J]. 农业工程学报, 33(1): 250-255. |
| ZHONG L N, WANG J, 2017. Evaluating the impact of land remediation on habitat quality based on the InVEST model[J]. Journal of Agricultural Engineering, 33(1): 250-255. | |
| [42] | 朱增云, 阿里木江·卡斯木, 2020. 基于地理探测器的伊犁谷地生境质量时空演变及其影响因素[J]. 生态学杂志, 39(10): 3408-3420. |
| ZHU Z Y, A M J, KASMU, 2020. Spatial and temporal evolution of habitat quality and its influencing factors in the Ili Valley based on geographical detectors[J]. Journal of Ecology, 39(10): 3408-3420. | |
| [43] | 赵晓松, 刘元波, 吴桂平, 2013. 基于遥感的鄱阳湖湖区蒸散特征及环境要素影响[J]. 湖泊科学, 25(3): 428-436. |
| ZHAO X S, LIU Y B, WU G P, 2013. Remote sensing based evapotranspiration characteristicsand environmental factors in the Poyang Lake region[J]. Lake Science, 25(3): 428-436. |
| [1] | 李惠梅, 李荣杰, 晏旭昇, 武非非, 高泽兵, 谭永忠. 青海湖流域生态风险评价及生态功能分区研究[J]. 生态环境学报, 2023, 32(7): 1185-1195. |
| [2] | 王琳, 卫伟. 黄土高原典型县域生态系统服务变化特征及驱动因素[J]. 生态环境学报, 2023, 32(6): 1140-1148. |
| [3] | 许静, 廖星凯, 甘崎旭, 周茅先. 基于MSPA与电路理论的黄河流域甘肃段生态安全格局构建[J]. 生态环境学报, 2023, 32(4): 805-813. |
| [4] | 张平江, 党国锋. 基于MCR模型与蚁群算法的洮河流域生态安全格局构建[J]. 生态环境学报, 2023, 32(3): 481-491. |
| [5] | 王成武, 罗俊杰, 唐鸿湖. 基于InVEST模型的太行山沿线地区生态系统碳储量时空分异驱动力分析[J]. 生态环境学报, 2023, 32(2): 215-225. |
| [6] | 朱锦维, 柯新利, 何利杰, 周婷, 王青, 任妍钰. 基于价值链理论的生态产品价值实现机制理论解析[J]. 生态环境学报, 2023, 32(2): 421-428. |
| [7] | 郑晓豪, 陈颖彪, 郑子豪, 郭城, 黄卓男, 周泳诗. 湖北省生态系统服务价值动态变化及其影响因素演变[J]. 生态环境学报, 2023, 32(1): 195-206. |
| [8] | 黄伟佳, 刘春, 刘岳, 黄斌, 李定强, 袁再健. 南岭山地不同海拔土壤生态化学计量特征及影响因素[J]. 生态环境学报, 2023, 32(1): 80-89. |
| [9] | 陈乐, 卫伟. 西北旱区典型流域土地利用与生境质量的时空演变特征[J]. 生态环境学报, 2022, 31(9): 1909-1918. |
| [10] | 王超越, 郭先华, 郭莉, 白丽芳, 夏利林, 王春博, 李廷真. 基于FLUS-InVEST的西北地区土地利用变化及其对碳储量的影响——以呼包鄂榆城市群为例[J]. 生态环境学报, 2022, 31(8): 1667-1679. |
| [11] | 刘香华, 王秀明, 刘谞承, 张音波, 刘飘. 基于外溢生态系统服务价值的广东省生态补偿机制研究[J]. 生态环境学报, 2022, 31(5): 1024-1031. |
| [12] | 李亮亮, 代良羽, 高维常, 张淑怡, 刘涛泽. 贵州省典型覆膜耕地残膜赋存特征及影响因素[J]. 生态环境学报, 2022, 31(11): 2189-2197. |
| [13] | 陈双双, 朱宁华, 周光益, 袁星明, 尚海, 王迤翾. 不同等级石漠化环境下人工乔木林的植被与土壤物理特征[J]. 生态环境学报, 2022, 31(1): 52-61. |
| [14] | 孙雪娇, 李吉玫, 张毓涛, 李翔, 芦建江, 佘飞. 天山北坡山地森林林地产流产沙特征及其影响因素分析[J]. 生态环境学报, 2021, 30(9): 1821-1830. |
| [15] | 相恒星, 张健, 王宗明, 毛德华. 松嫩平原生态系统服务供需研究[J]. 生态环境学报, 2021, 30(8): 1769-1776. |
| 阅读次数 | ||||||
|
全文 |
|
|||||
|
摘要 |
|
|||||