生态环境学报 ›› 2022, Vol. 31 ›› Issue (6): 1080-1090.DOI: 10.16258/j.cnki.1674-5906.2022.06.002
曹晓云1,2( ), 祝存兄1,2, 陈国茜1,2,*(), 孙树娇1,2, 赵慧芳1,2, 朱文彬3, 周秉荣1,2
收稿日期:2022-01-24
出版日期:2022-06-18
发布日期:2022-07-29
通讯作者:
*陈国茜(1986年生),女,高级工程师,硕士,主要从事生态遥感监测研究。E-mail: guoxi_chen@163.com作者简介:曹晓云(1993年生),女(藏族),工程师,硕士,主要从事青藏高原气候与环境研究。E-mail: xaioyun_cao@126.com
基金资助:
CAO Xiaoyun1,2(), ZHU Cunxiong1,2, CHEN Guoqian1,2,*(), SUN Shujiao1,2, ZHAO Huifang1,2, ZHU Wenbin3, ZHOU Bingrong1,2
Received:2022-01-24
Online:2022-06-18
Published:2022-07-29
摘要:
绿度可以反映地表生态环境质量,研究气候变化背景下柴达木盆地地表绿度时空变化特征和地形分异规律,有助于了解近年来柴达木盆地植被变化规律,为柴达木盆地应对气候变化和生态环境建设提供理论依据。基于MODIS NDVI(Normalized Difference Vegetation Index)遥感资料、DEM、气象数据和积雪面积数据,综合利用Sen+M-K趋势分析法、相关性分析法,分析了2000—2021年柴达木盆地地表被绿度的时空演变趋势、地形分异特征、气候因子的影响。结果表明,(1)2000—2021年柴达木盆地NDVI呈边缘高、腹地低的向心环状分布特征,随海拔变化规律性明显。高值区主要集中在盆地外围的山麓及内部绿洲地区,均值普遍大于0.3,而盆地腹地大部地区小于0.1,65.62%的区域NDVI呈波动增加趋势,显著增加区域占比53.04%,平均增加速率为1.8×10⁻³ a-1。(2)2000—2021年柴达木盆地NDVI及其变化趋势存在明显的海拔和坡向分异。整体随海拔上升呈抛物线型变化,其中,4.25—4.75 km的NDVI较高,超过0.30;3.5—4.5 km的NDVI年际增加速率较快,均超过2.75×10⁻³ a-1;NDVI北坡大于南坡、西坡大于东坡,西北坡最大,为0.19,且西北坡的NDVI增加速率最快,超过1.93×10⁻³ a-1。(3)2000—2021年生长季柴达木盆地明显的“暖湿化”气候变化特征是地表绿度改善的主要原因,降水量增多、积雪日数增多、冰川消融速率加快是重要的驱动因素,不同海拔的水热匹配和不同坡向的降水及冰雪融水、太阳辐射的气候差异造成了NDVI分布和变化的差异。
中图分类号:
曹晓云, 祝存兄, 陈国茜, 孙树娇, 赵慧芳, 朱文彬, 周秉荣. 2000—2021年柴达木盆地地表绿度变化及地形分异研究[J]. 生态环境学报, 2022, 31(6): 1080-1090.
CAO Xiaoyun, ZHU Cunxiong, CHEN Guoqian, SUN Shujiao, ZHAO Huifang, ZHU Wenbin, ZHOU Bingrong. Surface Greenness Change and Topographic Differentiation over Qaidam Basin from 2000 to 2021[J]. Ecology and Environment, 2022, 31(6): 1080-1090.
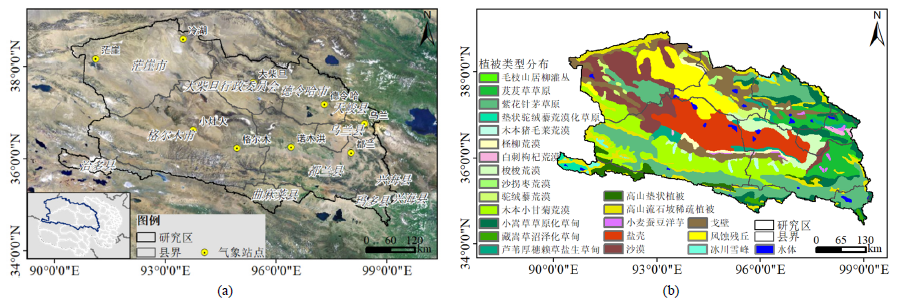
图1 柴达木盆地地理位置(a)和植被类型(b)空间分布
Figure 1 Spatial distribution of geographical location (a) and vegetation types (b) over Qaidam Basin

图2 柴达木盆地海拔(a)与坡向(b)空间分布
Figure 2 Spatial distributions of altitude (a) and slope (b) over Qaidam Basin
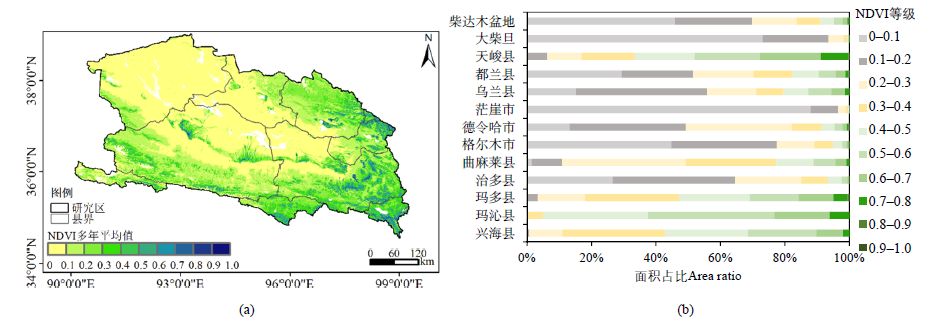
图3 2000—2021年柴达木盆地年平均NDVI空间(a)及其统计结果(b)
Figure 3 Spatial distribution (a) and interannual variation (b) of snow days over Qaidam Basin area from 2000 to 2021
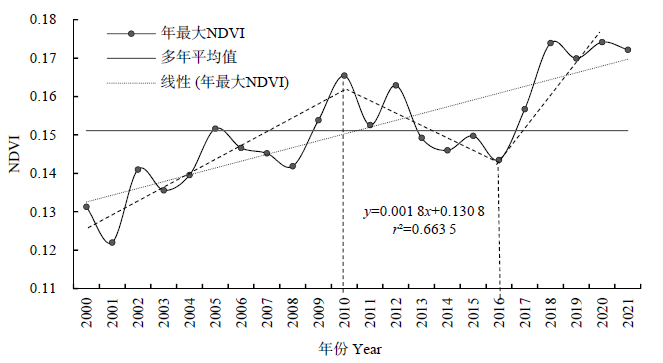
图4 2000—2021年柴达木盆地NDVI年际变化趋势
Figure 4 Interannual variation trend of NDVI over Qaidam Basin from 2000 to 2021
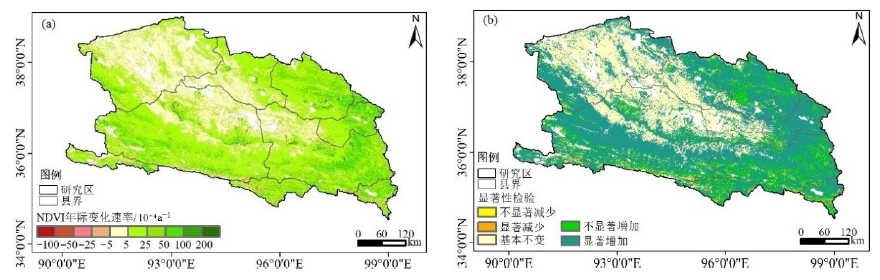
图5 2000—2021年柴达木盆地NDVI变化趋势(a)及其显著性检验(b)
Figure 5 Variation trend of NDVI over Qaidam Basin from 2000 to 2021 (a) and its significance test (b)
| 地理单元 Geographical unit | 平均年际变化速率 Average interannual change rate/(10-4 a-1) | 面积百分比 Area percentage/% | ||||||||
|---|---|---|---|---|---|---|---|---|---|---|
| 基本不变 Basically unchanged | 轻度减少 Slight reduction | 显著减少 Significant reduction | 轻度增加 Slight increase | 显著增加 Significant increase | ||||||
| 兴海县 Xinghai County | 33.76 | 16.87 | 0.00 | 3.63 | 27.08 | 52.43 | ||||
| 玛沁县 Maqin County | 32.41 | 28.86 | 0.00 | 1.63 | 44.31 | 25.20 | ||||
| 玛多县 Maduo County | 32.48 | 10.92 | 0.00 | 5.04 | 31.90 | 52.14 | ||||
| 治多县 Zhiduo County | 19.39 | 31.05 | 0.00 | 2.32 | 15.32 | 51.31 | ||||
| 曲麻莱县 Qumalai County | 24.11 | 8.57 | 0.00 | 5.31 | 33.70 | 52.42 | ||||
| 格尔木市 Golmud City | 15.41 | 32.78 | 0.00 | 1.28 | 10.63 | 55.30 | ||||
| 德令哈市 Delingha City | 27.05 | 8.32 | 0.00 | 0.70 | 19.89 | 71.09 | ||||
| 茫崖市 Mangya City | 6.85 | 62.42 | 0.00 | 0.26 | 1.57 | 35.74 | ||||
| 乌兰县 Wulan County | 33.70 | 7.58 | 0.00 | 0.97 | 10.58 | 80.87 | ||||
| 都兰县 Dulan County | 25.03 | 20.84 | 0.00 | 1.57 | 20.67 | 56.91 | ||||
| 天峻县 Tianjun County | 55.39 | 1.25 | 0.00 | 0.65 | 20.84 | 77.25 | ||||
| 大柴旦 Dachaidan | 8.91 | 47.13 | 0.00 | 0.47 | 7.43 | 44.97 | ||||
| 柴达木盆地 Qaidam Basin | 26.21 | 33.17 | 0.00 | 1.21 | 12.58 | 53.04 | ||||
表1 柴达木盆地NDVI年际变化速率及显著性检验统计
Table 1 Interannual change rate and significance test statistics of NDVI over Qaidam Basin
| 地理单元 Geographical unit | 平均年际变化速率 Average interannual change rate/(10-4 a-1) | 面积百分比 Area percentage/% | ||||||||
|---|---|---|---|---|---|---|---|---|---|---|
| 基本不变 Basically unchanged | 轻度减少 Slight reduction | 显著减少 Significant reduction | 轻度增加 Slight increase | 显著增加 Significant increase | ||||||
| 兴海县 Xinghai County | 33.76 | 16.87 | 0.00 | 3.63 | 27.08 | 52.43 | ||||
| 玛沁县 Maqin County | 32.41 | 28.86 | 0.00 | 1.63 | 44.31 | 25.20 | ||||
| 玛多县 Maduo County | 32.48 | 10.92 | 0.00 | 5.04 | 31.90 | 52.14 | ||||
| 治多县 Zhiduo County | 19.39 | 31.05 | 0.00 | 2.32 | 15.32 | 51.31 | ||||
| 曲麻莱县 Qumalai County | 24.11 | 8.57 | 0.00 | 5.31 | 33.70 | 52.42 | ||||
| 格尔木市 Golmud City | 15.41 | 32.78 | 0.00 | 1.28 | 10.63 | 55.30 | ||||
| 德令哈市 Delingha City | 27.05 | 8.32 | 0.00 | 0.70 | 19.89 | 71.09 | ||||
| 茫崖市 Mangya City | 6.85 | 62.42 | 0.00 | 0.26 | 1.57 | 35.74 | ||||
| 乌兰县 Wulan County | 33.70 | 7.58 | 0.00 | 0.97 | 10.58 | 80.87 | ||||
| 都兰县 Dulan County | 25.03 | 20.84 | 0.00 | 1.57 | 20.67 | 56.91 | ||||
| 天峻县 Tianjun County | 55.39 | 1.25 | 0.00 | 0.65 | 20.84 | 77.25 | ||||
| 大柴旦 Dachaidan | 8.91 | 47.13 | 0.00 | 0.47 | 7.43 | 44.97 | ||||
| 柴达木盆地 Qaidam Basin | 26.21 | 33.17 | 0.00 | 1.21 | 12.58 | 53.04 | ||||
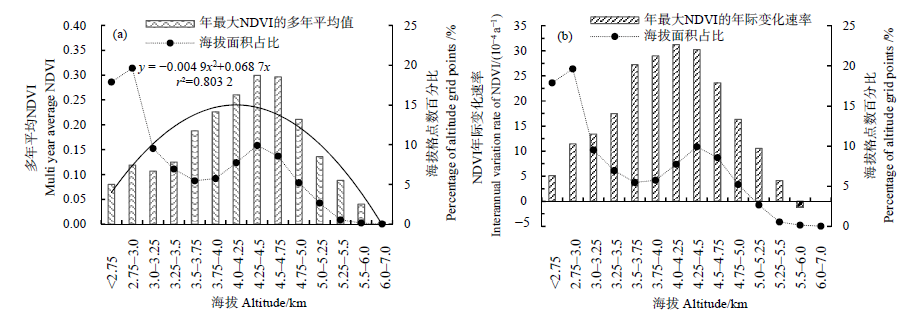
图6 2000—2021年柴达木盆地NDVI(a)及其变化趋势(b)的海拔梯度分异
Figure 6 Altitude gradient differentiation of NDVI (a) and its variation trend (b) over Qaidam Basin from 2000 to 2021
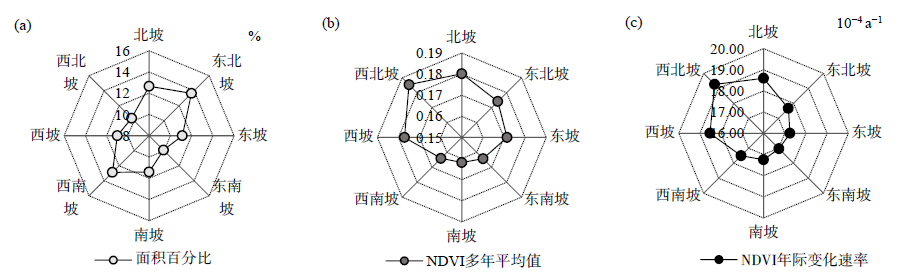
图7 柴达木盆地不同坡向占地面积(a)、NDVI(b)及其变化趋势(c)的坡向分异
Figure 7 Slope direction differentiation of land area (a), NDVI (b) and its change trend (c) in different slope directions over Qaidam Basin
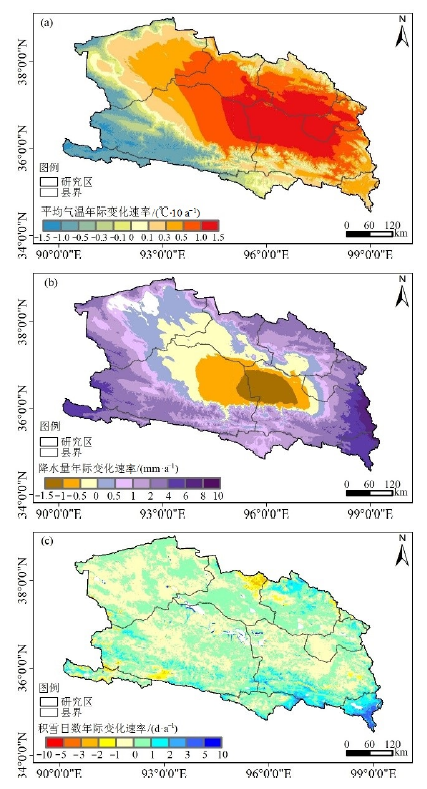
图8 柴达木盆地2000—2021年生长季平均气温(a)、累计降水量(b)及2003—2021年水文年积雪日数(c)变化趋势空间分布
Figure 8 Spatial distribution of variation trend of average temperature (a), cumulative precipitation (b) in growing season from 2000 to 2021 and snow days in hydrological year from 2003 to 2021 (c) over Qaidam Basin
| 海拔 Altitude/ km | 平均气温 Average temperature (year 2000-2021) | 降水量 Precipitation (year 2000-2021) | 积雪日数 Snow cover days (year 2003-2021) | |||||
|---|---|---|---|---|---|---|---|---|
| 多年平均值 Multi year average/ ℃ | 年际变化速率 Interannual change rate/ (℃∙a-1) | 多年平均值 Multi year average/ mm | 年际变化速率 Interannual change rate/ (mm∙a-1) | 多年平均值 Multi year average/ d | 年际变化速率 Interannual change rate/ (d∙a-1) | |||
| <2.75 | 15.30 | 0.07 | 49.30 | -0.52 | 2.41 | 0.00 | ||
| 2.75-3.0 | 14.40 | 0.07 | 77.90 | 0.00 | 1.94 | -0.02 | ||
| 3.0-3.25 | 12.69 | 0.06 | 110.40 | 0.62 | 4.89 | 0.02 | ||
| 3.25-3.5 | 11.18 | 0.05 | 133.27 | 1.16 | 7.81 | 0.03 | ||
| 3.5-3.75 | 9.63 | 0.03 | 166.07 | 1.73 | 13.04 | 0.04 | ||
| 3.75-4.0 | 8.13 | 0.02 | 189.84 | 2.00 | 19.16 | 0.02 | ||
| 4.0-4.25 | 6.61 | 0.02 | 224.11 | 2.56 | 27.56 | 0.32 | ||
| 4.25-4.5 | 5.18 | 0.00 | 247.34 | 2.66 | 41.07 | 0.49 | ||
| 4.5-4.75 | 4.04 | -0.02 | 252.52 | 2.69 | 55.74 | 0.53 | ||
| 4.75-5.0 | 2.87 | -0.05 | 249.36 | 3.18 | 74.31 | 0.35 | ||
| 5.0-5.25 | 1.79 | -0.08 | 252.53 | 3.72 | 97.89 | -0.11 | ||
| 5.25-5.5 | 0.46 | -0.10 | 264.42 | 4.03 | 163.18 | -0.22 | ||
| 5.5-7.0 | -1.08 | -0.12 | 279.12 | 4.80 | 206.58 | -0.11 | ||
表2 近20年来柴达木盆地生长季平均气温、降水量和积雪日数及其变化趋势的海拔梯度分异
Table 2 Altitude gradient differentiation of average temperature, precipitation and snow cover days and their changing trends during the growing season over Qaidam Basin in the past 20 years
| 海拔 Altitude/ km | 平均气温 Average temperature (year 2000-2021) | 降水量 Precipitation (year 2000-2021) | 积雪日数 Snow cover days (year 2003-2021) | |||||
|---|---|---|---|---|---|---|---|---|
| 多年平均值 Multi year average/ ℃ | 年际变化速率 Interannual change rate/ (℃∙a-1) | 多年平均值 Multi year average/ mm | 年际变化速率 Interannual change rate/ (mm∙a-1) | 多年平均值 Multi year average/ d | 年际变化速率 Interannual change rate/ (d∙a-1) | |||
| <2.75 | 15.30 | 0.07 | 49.30 | -0.52 | 2.41 | 0.00 | ||
| 2.75-3.0 | 14.40 | 0.07 | 77.90 | 0.00 | 1.94 | -0.02 | ||
| 3.0-3.25 | 12.69 | 0.06 | 110.40 | 0.62 | 4.89 | 0.02 | ||
| 3.25-3.5 | 11.18 | 0.05 | 133.27 | 1.16 | 7.81 | 0.03 | ||
| 3.5-3.75 | 9.63 | 0.03 | 166.07 | 1.73 | 13.04 | 0.04 | ||
| 3.75-4.0 | 8.13 | 0.02 | 189.84 | 2.00 | 19.16 | 0.02 | ||
| 4.0-4.25 | 6.61 | 0.02 | 224.11 | 2.56 | 27.56 | 0.32 | ||
| 4.25-4.5 | 5.18 | 0.00 | 247.34 | 2.66 | 41.07 | 0.49 | ||
| 4.5-4.75 | 4.04 | -0.02 | 252.52 | 2.69 | 55.74 | 0.53 | ||
| 4.75-5.0 | 2.87 | -0.05 | 249.36 | 3.18 | 74.31 | 0.35 | ||
| 5.0-5.25 | 1.79 | -0.08 | 252.53 | 3.72 | 97.89 | -0.11 | ||
| 5.25-5.5 | 0.46 | -0.10 | 264.42 | 4.03 | 163.18 | -0.22 | ||
| 5.5-7.0 | -1.08 | -0.12 | 279.12 | 4.80 | 206.58 | -0.11 | ||
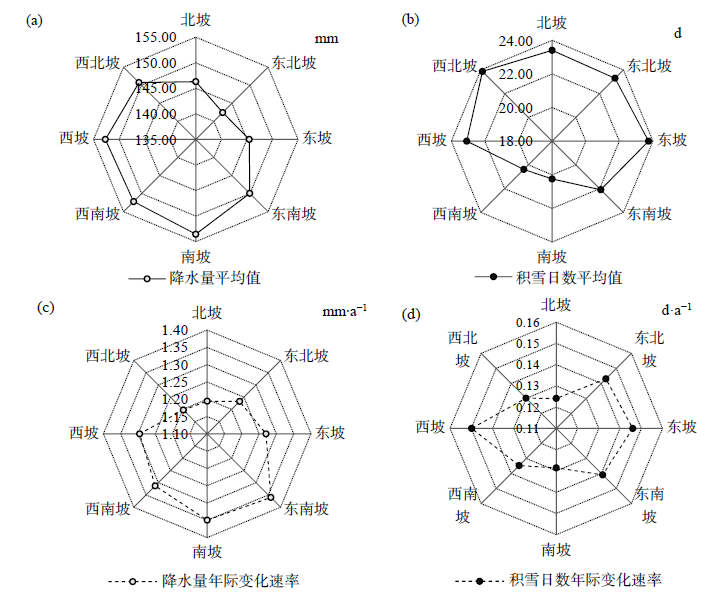
图9 柴达木盆地2000—2021年生长季累计降水量(a)、(c)及2003—2021年水文年积雪日数(b)、(d)及其变化趋势的坡向分异
Figure 9 Slope direction differentiation of cumulative precipitation during the growing season (a), (c) and snow cover days in the hydrological year (b), (d) and their variation trends over Qaidam Basin from 2000 to 2021
| [1] | CONG N, WANGT, NAN H J, et al., 2013. Changes in satellite-derived spring vegetation green-up date and its linkage to climate in China from 1982 to 2010: A multimethod analysis[J]. Global Change Biology, 19(3): 881-891. |
| [2] | FRANKLIN S E, HE Y H, PAPE A, et al., 2011. Landsat comparable land cover maps using ASTER and SPOT images: A case study for large-area mapping programmes[J]. International Journal of Remote Sensing, 32(7-8): 2185-2205. |
| [3] | HIRSCH R M, SLACK J R, 1984. A Nonparametric Trend Test for Seasonal Data With Serial Dependence[J]. Water Resources Research, 20(6): 727-732. |
| [4] |
HAN J J, WANG J P, CHEN L, et al., 2021. Driving factors of desertification in Qaidam Basin, China: An 18-year analysis using the geographic detector model[J]. Ecological Indicators, DOI: 10.1016/j.ecolind.2021.107404.
DOI URL |
| [5] | PAN N Q, FENG X M, FU B J, et al., 2018. Increasing global vegetation browning hidden in overall vegetation greening: Insights from time-varying trends[J]. Remote Sensing of Environment, 214: 59-72. |
| [6] | RANGWALA I, MILLER J R, 2012. Climate change in mountains: a review of elevation-dependent warming and its possible causes[J]. Climatic Change, 114(3-4): 527-547. |
| [7] | SUN B, WANG H J, 2018a. Interannual variation of the spring and summer precipitation over the Three River Source Region in China and the associated regimes[J]. Journal of Climate, 31(18): 7441-7457. |
| [8] | SUN B, WANG H J, 2018b. Enhanced connections between summer precipitation over the Three-River-Source region of China and the global climate system[J]. Climate Dynamics, 52(5-6): 3471-3488. |
| [9] |
YOU Q L, CHEN D L, WU F Y, et al., 2020. Elevation dependent warming over the Tibetan Plateau: Patterns, mechanisms and perspectives[J]. Earth-Science Reviews, DOI: 10.1016/j.earscirev.2020.103349.
DOI URL |
| [10] | 曹云, 钱永兰, 孙应龙, 等, 2020. 基于MODIS NDVI的西南森林植被时空变化特征及其气候响应分析[J]. 生态环境学报, 29(5): 857-865. |
| CAO Y, QIAN Y L, SUN Y L, et al., 2020. Spatial-temporal variations of forest vegetation and climatic driving force analysis in southwest China based on MODIS NDVI and climate data[J]. Ecology and Environment Sciences, 29(5): 857-865. | |
| [11] | 陈槐, 鞠佩君, 张江, 等, 2020. 青藏高原高寒草地生态系统变化的归因分析[J]. 科学通报, 65(22): 2406-2418. |
| CHEN H, JU P J, ZHANG J, et al., 2020. Attribution analyses of changes in alpine grasslands on the Qinghai-Tibetan Plateau[J]. Chinese Science Bulletin, 65(22): 2406-2418. | |
| [12] | 杜庆, 孙世洲, 1981. 柴达木盆地植被考察简况[J]. 植物生态学与地植物学丛刊, 5(1): 77-78. |
| DU Q, SUN S Z, 1981. Survey of vegetation in Qaidam Basin[J]. Plant Ecology and Geobotany Series, 5(1): 77-78. | |
| [13] | 邓晨晖, 白红英, 马新萍, 等, 2021. 2000-2017年秦岭山地植被物候变化特征及其南北差异[J]. 生态学报, 41(3): 1068-1080. |
| DENG C H, BAI H Y, MA X P, et al., 2021. Variation characteristics and its north-south differences of the vegetation phenology by remote sensing monitoring in the Qinling Mountains during 2000-2017[J]. Acta Ecologica Sinica, 41(3): 1068-1080. | |
| [14] |
付阳, 陈辉, 张斯琦, 等, 2021. 基于群落类型的寒区旱区物候特征及其对气候因子的响应--以2000-2019年柴达木盆地为例[J]. 地理研究, 40(1): 52-66.
DOI |
| FU Y, CHEN H, ZHANG S Q, et al., 2021. Phenological characteristics of alpine arid region based on biome type and its responses to climate factors: A case study of Qaidam Basin from 2000 to 2019[J]. Geographical Research, 40(1): 52-66. | |
| [15] |
郭建平, 刘欢, 安林昌, 等, 2016. 2001-2012年青藏高原积雪覆盖率变化及地形影响[J]. 高原气象, 35(1): 24-33.
DOI |
| GUO J P, LIU H, AN L C, et al., 2016. Study on variation of snow cover and its orographic impact over Qinghai-Xizang Plateau during 2001-2012[J]. Plateau Meteorology, 35(1): 24-33. | |
| [16] | 黄嘉佑, 李庆祥, 2015. 气象数据统计分析方法[M]. 北京: 气象出版社: 35-38. |
| HUANG J Y, LI Q X, 2015. Statistical analysis method of meteorological data[M]. Beiing: Meteorological publishing house. | |
| [17] | 李红梅, 2018. 柴达木盆地气候变化对植被的影响分析[J]. 草业学报, 27(3): 13-23. |
| LI H M, 2018. Analysis on the impact of climate change on vegetation in the Qaidam Basin[J]. Acta Prataculturae Sinica, 27(3): 13-23. | |
| [18] | 李林, 申红艳, 李红梅, 等, 2015. 柴达木盆地气候变化的区域显著性及其成因研究[J]. 自然资源学报, 30(4): 641-650. |
| LI L, SHEN H Y, LI H M, et al., 2015. Regional differences of climate change in Qaidam Basin and its contributing factors[J]. Journal of Natural Resources, 30(04): 641-650. | |
| [19] | 李世东, 陈应发, 2021. 柴达木盆地生态建设的思考[J]. 林草政策研究, 1(2): 68-72. |
| LI S D, CHEN Y F, 2021. Thoughts on ecological construction of Qaidam Basin[J]. Journal of Porestry and Grassland Policy, 1(2): 68-72. | |
| [20] | 刘爽, 宫鹏, 2012. 2000-2010年中国地表植被绿度变化[J]. 科学通报, 57(16): 1423-1434. |
| LIU S, GONG P, 2012. Change of surface cover greenness in China between 2000 and 2010[J]. Chinese Science Bulletin, 57(16): 1423-1434. | |
| [21] | 刘志红, LI LINGTAO, MCVICAR TIM R, 等, 2008. 专用气候数据空间插值软件ANUSPLIN及其应用[J]. 气象, 34(2): 92-100. |
| LIU Z H, LI L T, MCVICAR T R, et al., 2008. Introduction of the professional interpolation software for meteorology data: ANUSPLINN[J]. Meteorological Monthly, 34(2): 92-100. | |
| [22] | 马士彬, 安裕伦, 杨广斌, 等, 2019. 不同地形梯度上的植被变化趋势及原因分析[J]. 生态环境学报, 28(5): 857-864. |
| MA S B, AN Y L, YANG G B, et al., 2019. The analysis of distribution characteristics and reasons of NDVI change trends along the terrain gradient[J]. Ecology and Environment Sciences, 28(5): 857-864. | |
| [23] | 马炳鑫, 靖娟利, 徐勇, 等, 2021. 2000-2019年滇黔桂岩溶区植被NPP时空变化及与气候变化的关系研究[J]. 生态环境学报, 30(12): 2285-2293. |
| MA B X, JING J L, XU Y, et al., 2021. Spatial-temporal changes of NPP and its relationship with climate change in karst areas of Yunnan, Guizhou and Guangxi from 2000 to 2019[J]. Ecology and Environment Sciences, 30(12): 2285-2293. | |
| [24] | 王林林, 刘普幸, 王允, 2015. 近14年来柴达木盆地NDVI时空变化及其影响因素[J]. 生态学杂志, 34(6): 1713-1722. |
| WANG L L, LIU P X, WANG Y, 2015. Spatial and temporal variations of NDVI and its influencing factors in Qaidam Basin in the last 14 years[J]. Chinese Journal of Ecology, 34(6): 1713-1722. | |
| [25] | 徐浩杰, 杨太保, 2014. 柴达木盆地植被生长时空变化特征及其对气候要素的响应[J]. 自然资源学报, 29(3): 398-409. |
| XU H J, YANG T B, 2014. Spatial-temporal variations of vegetation activities and its responses to climatic factors in the Qaidam Basin[J]. Journal of Natural Resources, 29(3): 398-409. | |
| [26] | 杨运航, 文广超, 谢洪波, 等, 2020. 柴达木盆地典型地貌单元归一化植被指数变化特征[J]. 水土保持通报, 40(4): 133-139. |
| YANG Y H, WEN G C, XIE H B, et al., 2020. Characteristics of normalized vegetation index under typical geomorphic units in Qaidam Basin[J]. Bulletin of Soil and Water Conservation, 40(4): 133-139. | |
| [27] |
谢舒笛, 莫兴国, 胡实, 等, 2020. 三北防护林工程区植被绿度对温度和降水的响应[J]. 地理研究, 39(1): 152-165.
DOI |
| XIE S D, MO X G, HU S, et al., 2020. Responses of vegetation greenness to temperature and precipitation in the Three-North Shelter Forest Program[J]. Geographical Research, 39(1): 152-165. | |
| [28] | 银朵朵, 王艳慧, 2021. 温带大陆性半干旱季风气候区植被覆盖度时空变化及其地形分异研究[J]. 生态学报, 41(3): 1158-1167. |
| YIN D D, WANG Y H, 2021. Temporal and spatial changes of vegetation coverage and its topographic differentiation in temperate continental semi-arid monsoon climate region[J]. Acta Ecologica Sinica: 41 (3): 1158-1167. | |
| [29] |
游庆龙, 康世昌, 李剑东, 等, 2021. 青藏高原气候变化若干前沿科学问题[J]. 冰川冻土, 43(3): 885-901.
DOI |
| YOU Q L, KANG S C, LI J D, et al., 2021. Several research frontiers of climate change over the Tibetan Plateau[J]. Journal of Glaciology and Geocryology, 43(3): 885-901. | |
| [30] |
张学珍, 2014. 1982-2011年北半球中纬度秋季植被绿度变化的主要模态[J]. 地理科学, 34(10): 1226-1232.
DOI |
| ZHANG X Z, 2014. Main models of variations of autumn vegetation greenness in the mid-latitude of north hemispherein 1982-2011[J]. Scienctia Geographica Sinica, 34(10): 1226-1232. | |
| [31] | 章钊华, 赵书河, 丛佃敏, 等, 2018. 基于遥感的泰山地区植被绿度趋势变化研究[J]. 地理空间信息, 16(7): 65-68. |
| ZHANG Z H, ZHAO S H, CONG D M, et al., 2018. Research on the trend change of vegetation greenness in Mount Tai based on remote sensing[J]. Geospatial Information, 16(7): 65-68. | |
| [32] | 赵婷, 白红英, 邓晨晖, 等, 2019. 2000-2016年秦岭山地植被覆盖变化地形分异效应[J]. 生态学报, 39(12): 4499-4509. |
| ZHAO T, BAI H Y, DENG C H, et al., 2019. Topographic differentiation effect on vegetation cover in the Qinling Mountains from 2000 to 2016[J]. Acta Ecologica Sinica, 39(12): 4499-4509. | |
| [33] | 张斯琦, 陈辉, 宋明华, 等, 2019. 2000-2015年柴达木盆地植被覆盖度时空变化及其与环境因子的关系[J]. 干旱区地理, 42(5): 1124-1132. |
| ZHANG S Q, CHEN H, SONG M H, et al., 2019. Spatial and temporal variation of fractional vegetation cover and its relationship with environmental factors in the Qaidam Basin during 2000-2015[J]. Arid Land Geography, 42(5): 1124-1132. | |
| [34] | 周苏刚, 姚晓军, 张圆, 等, 2021. 1977-2018年柴达木盆地冰川矢量数据集[J]. 中国科学数据, 6(2): 169-176. |
| ZHOU S G, YAO X J, ZHANG Y, et al., 2021. A glacier vector dataset in the Qaidam Basin from 1977 to 2018[J]. China Scientific Data, 6(2): 169-176. |
| [1] | 郝蕾, 翟涌光, 戚文超, 兰穹穹. 2001-2020年内蒙古植被碳源/碳汇时空动态及对气候因子的响应[J]. 生态环境学报, 2023, 32(5): 825-834. |
| [2] | 巫晨煜, 许帆帆, 魏士博, 樊晶晶, 刘观鹏, 王坤. 渭河流域地表植被覆盖对气候变化的响应研究[J]. 生态环境学报, 2023, 32(5): 835-844. |
| [3] | 陈俊芳, 吴宪, 刘啸林, 刘娟, 杨佳绒, 刘宇. 不同土壤水分下元素化学计量对微生物多样性的塑造特征[J]. 生态环境学报, 2023, 32(5): 898-909. |
| [4] | 李晖, 李必龙, 葛黎黎, 韩琛惠, 杨倩, 张岳军. 2000-2021年汾河流域植被时空演变特征及地形效应[J]. 生态环境学报, 2023, 32(3): 439-449. |
| [5] | 秦浩, 李蒙爱, 高劲, 陈凯龙, 张殷波, 张峰. 芦芽山不同海拔灌丛土壤细菌群落组成和多样性研究[J]. 生态环境学报, 2023, 32(3): 459-468. |
| [6] | 宋志斌, 周佳诚, 谭路, 唐涛. 高原河流着生藻类群落沿海拔梯度的变化特征--以西藏黑曲、雪曲为例[J]. 生态环境学报, 2023, 32(2): 274-282. |
| [7] | 贾志峰, 刘鹏程, 刘宇, 吴博博, 陈丹姿, 张向飞. 气候变化和人类活动对松辽流域植被覆盖的影响[J]. 生态环境学报, 2023, 32(1): 1-10. |
| [8] | 黄伟佳, 刘春, 刘岳, 黄斌, 李定强, 袁再健. 南岭山地不同海拔土壤生态化学计量特征及影响因素[J]. 生态环境学报, 2023, 32(1): 80-89. |
| [9] | 齐月, 张强, 胡淑娟, 蔡迪花, 赵福年, 陈斐, 张凯, 王鹤龄, 王润元. 黄土高原地区气候变化及其对冬小麦生产潜力的影响[J]. 生态环境学报, 2022, 31(8): 1521-1529. |
| [10] | 邓天乐, 谢立勇, 张凤哲, 赵洪亮, 蒋语童. CO2浓度升高条件下稗草与水稻生长空间竞争关系研究[J]. 生态环境学报, 2022, 31(8): 1566-1572. |
| [11] | 卢燕宇, 孙维, 方砚秋, 唐为安, 邓汗青, 何冬燕. 基于种植结构的安徽省气候生产潜力估算及粮食安全气候承载力分析[J]. 生态环境学报, 2022, 31(7): 1293-1305. |
| [12] | 陈文裕, 夏丽华, 徐国良, 余世钦, 陈行, 陈金凤. 2000—2020年珠江流域NDVI动态变化及影响因素研究[J]. 生态环境学报, 2022, 31(7): 1306-1316. |
| [13] | 孙梦鑫, 张岳, 辛宇, 钟鼎杰, 杨存建. 川西高原近20 a植被物候变化及其对气候变化的响应[J]. 生态环境学报, 2022, 31(7): 1326-1339. |
| [14] | 李登科, 王钊. 气候变化和人类活动对陕西省植被NPP影响的定量分析[J]. 生态环境学报, 2022, 31(6): 1071-1079. |
| [15] | 张博文, 秦娟, 任忠明, 陈子齐, 姚舜佳, 刘烨, 宋炎玉. 坡向对北亚热带区马尾松纯林及不同针阔混交林型林下植物多样性的影响[J]. 生态环境学报, 2022, 31(6): 1091-1100. |
| 阅读次数 | ||||||
|
全文 |
|
|||||
|
摘要 |
|
|||||