生态环境学报 ›› 2022, Vol. 31 ›› Issue (2): 307-317.DOI: 10.16258/j.cnki.1674-5906.2022.02.011
赵锐1( ), 詹梨苹1, 周亮2, 张军科1,*()
收稿日期:2021-09-26
出版日期:2022-02-18
发布日期:2022-04-14
通讯作者:
*E-mail: zhangjunke@home.swjtu.edu.cn作者简介:赵锐(1983年生),男,教授,主要研究方向为环境政策与低碳可持续发展。E-mail: ruizhao@home.swjtu.edu.cn
基金资助:
ZHAO Rui1(), ZHAN Liping1, ZHOU Liang2, ZHANG Junke1,*()
Received:2021-09-26
Online:2022-02-18
Published:2022-04-14
摘要:
开展PM2.5的驱动成因分析,对大气污染防治具有重要意义。利用2015—2018年PM2.5地面监测数据,结合地理探测器和地理加权岭回归方法,探测了全国282个城市PM2.5空间分异的关键驱动因素,分析了各关键驱动因素对PM2.5影响的时空异质性。结果表明,气象参数和社会经济活动可更好地解释PM2.5呈现的空间分异性;在2015—2018年间,所建地理加权岭回归模型的R2分别为0.698、0.724、0.656和0.712,AICc分别为1317.533、1234.400、1256.107和1110.740,2种指标均优于全局回归模型和地理加权回归模型,说明地理加权岭回归模型可更好地解释PM2.5产生空间分异的关键影响机制;模型拟合结果进一步显示,气温、比湿度、地区生产总值、年平均人口和工业企业数是引起PM2.5空间分异的关键驱动因素,各因素的影响既存在正向效应也存在负向效应,其对应的回归系数具有明显的时空异质性。
中图分类号:
赵锐, 詹梨苹, 周亮, 张军科. 地理探测联合地理加权岭回归的PM2.5驱动因素分析[J]. 生态环境学报, 2022, 31(2): 307-317.
ZHAO Rui, ZHAN Liping, ZHOU Liang, ZHANG Junke. Identification of Driving Factors of PM2.5 Based on Geographic Detector Combined with Geographically Weighted Ridge Regression[J]. Ecology and Environment, 2022, 31(2): 307-317.
| 影响因素 Influence factors | 变量名称 Variables | 单位 Unit |
|---|---|---|
| 气象 Weather | 风速 | m∙s-1 |
| 降水率 | mm∙h-1 | |
| 气温 | ℃ | |
| 气压 | Pa | |
| 比湿度 | kg∙kg-1 | |
| 社会经济 Social economy | 地区生产总值 | 万元 |
| 年平均人口 | 万人 | |
| 工业企业数 | 个 | |
| 工业烟(粉)尘排放量 | t | |
| 公里客运量 | 万人 | |
| 公路货运量 | 万吨 | |
| 土地利用类型 Land use types | 城市建设用地面积 | km2 |
| 绿地面积 | hm2 |
表1 影响因素选择
Table 1 Selection of influencing factors
| 影响因素 Influence factors | 变量名称 Variables | 单位 Unit |
|---|---|---|
| 气象 Weather | 风速 | m∙s-1 |
| 降水率 | mm∙h-1 | |
| 气温 | ℃ | |
| 气压 | Pa | |
| 比湿度 | kg∙kg-1 | |
| 社会经济 Social economy | 地区生产总值 | 万元 |
| 年平均人口 | 万人 | |
| 工业企业数 | 个 | |
| 工业烟(粉)尘排放量 | t | |
| 公里客运量 | 万人 | |
| 公路货运量 | 万吨 | |
| 土地利用类型 Land use types | 城市建设用地面积 | km2 |
| 绿地面积 | hm2 |
| 变量 Variables | 最优分类组合 Best-classified combination | 变量 Variables | 最优分类组合 Best-classified combination |
|---|---|---|---|
| 风速 Wind speed | 13(EI) | 工业企业数 Number of industrial enterprise | 13(GI) |
| 降水率 Precipitation rate | 13(Q) | 工业烟(粉)尘 排放量 Amount of industrial mist and dust discharged | 11(GI) |
| 气温 Air temperature | 15(EI) | 公路客运量 Highway passenger carrying capacity | 12(GI) |
| 气压 Atmospheric pressure | 11(GI) | 公路货运量 Highway freight volume | 13(NB) |
| 比湿度 Specific humidity | 13(GI) | 城市建设用地面积 Area of urban construction land | 10(NB) |
| 地区生产总值 Regional GDP | 10(GI) | 绿地面积 Greenery area | 10(Q) |
| 年平均人口 Average annual population | 14(Q) | — | — |
表2 各因素最优分类组合
Table 2 The optimal classification combination of factors
| 变量 Variables | 最优分类组合 Best-classified combination | 变量 Variables | 最优分类组合 Best-classified combination |
|---|---|---|---|
| 风速 Wind speed | 13(EI) | 工业企业数 Number of industrial enterprise | 13(GI) |
| 降水率 Precipitation rate | 13(Q) | 工业烟(粉)尘 排放量 Amount of industrial mist and dust discharged | 11(GI) |
| 气温 Air temperature | 15(EI) | 公路客运量 Highway passenger carrying capacity | 12(GI) |
| 气压 Atmospheric pressure | 11(GI) | 公路货运量 Highway freight volume | 13(NB) |
| 比湿度 Specific humidity | 13(GI) | 城市建设用地面积 Area of urban construction land | 10(NB) |
| 地区生产总值 Regional GDP | 10(GI) | 绿地面积 Greenery area | 10(Q) |
| 年平均人口 Average annual population | 14(Q) | — | — |
| 变量名称 Variables | 2015 | 2016 | 2017 | 2018 | ||||
|---|---|---|---|---|---|---|---|---|
| q | P | q | P | q | P | q | P | |
| 风速 Wind speed | 0.131 | 0.176 | 0.113 | 0.021 | 0.137 | 0.000 | 0.089 | 0.906 |
| 降水率 Precipitation rate | 0.078 | 0.050 | 0.123 | 0.093 | 0.132 | 0.000 | 0.139 | 0.034 |
| 气温 Air temperature | 0.421 | 0.000 | 0.365 | 0.000 | 0.287 | 0.000 | 0.248 | 0.000 |
| 气压 Atmospheric pressure | 0.152 | 0.000 | 0.149 | 0.008 | 0.165 | 0.000 | 0.165 | 0.000 |
| 比湿度 Specific humidity | 0.443 | 0.000 | 0.440 | 0.000 | 0.330 | 0.000 | 0.281 | 0.000 |
| 地区生产总值 Regional GDP | 0.159 | 0.000 | 0.164 | 0.000 | 0.175 | 0.000 | 0.159 | 0.000 |
| 年平均人口 Average annual population | 0.217 | 0.000 | 0.225 | 0.000 | 0.219 | 0.000 | 0.216 | 0.000 |
| 工业企业数Number of industrial enterprise | 0.286 | 0.000 | 0.257 | 0.000 | 0.264 | 0.000 | 0.236 | 0.000 |
| 工业烟(粉)尘排放量Amount of industrial mist and dust discharged | 0.170 | 0.240 | 0.124 | 0.000 | 0.070 | 0.987 | 0.060 | 0.134 |
| 公路客运量Highway passenger carrying capacity | 0.084 | 0.476 | 0.115 | 0.451 | 0.086 | 0.593 | 0.086 | 0.640 |
| 公路货运量 Highway freight volume | 0.143 | 0.054 | 0.180 | 0.004 | 0.178 | 0.000 | 0.197 | 0.000 |
| 城市建设用地面积 Area of urban construction land | 0.114 | 0.229 | 0.134 | 0.225 | 0.140 | 0.046 | 0.111 | 0.128 |
| 绿地面积 Greenery area | 0.133 | 0.000 | 0.127 | 0.113 | 0.120 | 0.179 | 0.090 | 0.002 |
表3 PM2.5影响因素地理探测结果
Table 3 Geographical detection results of PM2.5
| 变量名称 Variables | 2015 | 2016 | 2017 | 2018 | ||||
|---|---|---|---|---|---|---|---|---|
| q | P | q | P | q | P | q | P | |
| 风速 Wind speed | 0.131 | 0.176 | 0.113 | 0.021 | 0.137 | 0.000 | 0.089 | 0.906 |
| 降水率 Precipitation rate | 0.078 | 0.050 | 0.123 | 0.093 | 0.132 | 0.000 | 0.139 | 0.034 |
| 气温 Air temperature | 0.421 | 0.000 | 0.365 | 0.000 | 0.287 | 0.000 | 0.248 | 0.000 |
| 气压 Atmospheric pressure | 0.152 | 0.000 | 0.149 | 0.008 | 0.165 | 0.000 | 0.165 | 0.000 |
| 比湿度 Specific humidity | 0.443 | 0.000 | 0.440 | 0.000 | 0.330 | 0.000 | 0.281 | 0.000 |
| 地区生产总值 Regional GDP | 0.159 | 0.000 | 0.164 | 0.000 | 0.175 | 0.000 | 0.159 | 0.000 |
| 年平均人口 Average annual population | 0.217 | 0.000 | 0.225 | 0.000 | 0.219 | 0.000 | 0.216 | 0.000 |
| 工业企业数Number of industrial enterprise | 0.286 | 0.000 | 0.257 | 0.000 | 0.264 | 0.000 | 0.236 | 0.000 |
| 工业烟(粉)尘排放量Amount of industrial mist and dust discharged | 0.170 | 0.240 | 0.124 | 0.000 | 0.070 | 0.987 | 0.060 | 0.134 |
| 公路客运量Highway passenger carrying capacity | 0.084 | 0.476 | 0.115 | 0.451 | 0.086 | 0.593 | 0.086 | 0.640 |
| 公路货运量 Highway freight volume | 0.143 | 0.054 | 0.180 | 0.004 | 0.178 | 0.000 | 0.197 | 0.000 |
| 城市建设用地面积 Area of urban construction land | 0.114 | 0.229 | 0.134 | 0.225 | 0.140 | 0.046 | 0.111 | 0.128 |
| 绿地面积 Greenery area | 0.133 | 0.000 | 0.127 | 0.113 | 0.120 | 0.179 | 0.090 | 0.002 |
| 年份 Years | 变量 Variables | R2 | AICc | ||||
|---|---|---|---|---|---|---|---|
| OLS | GWR | GWRR | OLS | GWR | GWRR | ||
| 2015 | 气温、气压、比湿度、地区生产总值、年平均人口、工业企业数、绿地面积 | 0.422 | 0.605 | 0.698 | 1498.309 | 1392.298 | 1317.533 |
| 2016 | 气温、比湿度、地区生产总值、年平均人口、 工业企业数、工业烟(粉)尘排放量 | 0.405 | 0.539 | 0.724 | 1449.089 | 1376.570 | 1234.400 |
| 2017 | 风速、降水率、气温、气压、比湿度、地区生产总值、 年平均人口、工业企业数、公路货运量 | 0.305 | 0.557 | 0.656 | 1451.439 | 1331.586 | 1256.107 |
| 2018 | 气温、气压、比湿度、地区生产总值、年平均人口、工业企业数、公路货运量 | 0.314 | 0.571 | 0.712 | 1354.153 | 1223.987 | 1110.740 |
表4 模型变量及性能评价指标
Table 4 Model variables and performance evaluation indicators
| 年份 Years | 变量 Variables | R2 | AICc | ||||
|---|---|---|---|---|---|---|---|
| OLS | GWR | GWRR | OLS | GWR | GWRR | ||
| 2015 | 气温、气压、比湿度、地区生产总值、年平均人口、工业企业数、绿地面积 | 0.422 | 0.605 | 0.698 | 1498.309 | 1392.298 | 1317.533 |
| 2016 | 气温、比湿度、地区生产总值、年平均人口、 工业企业数、工业烟(粉)尘排放量 | 0.405 | 0.539 | 0.724 | 1449.089 | 1376.570 | 1234.400 |
| 2017 | 风速、降水率、气温、气压、比湿度、地区生产总值、 年平均人口、工业企业数、公路货运量 | 0.305 | 0.557 | 0.656 | 1451.439 | 1331.586 | 1256.107 |
| 2018 | 气温、气压、比湿度、地区生产总值、年平均人口、工业企业数、公路货运量 | 0.314 | 0.571 | 0.712 | 1354.153 | 1223.987 | 1110.740 |
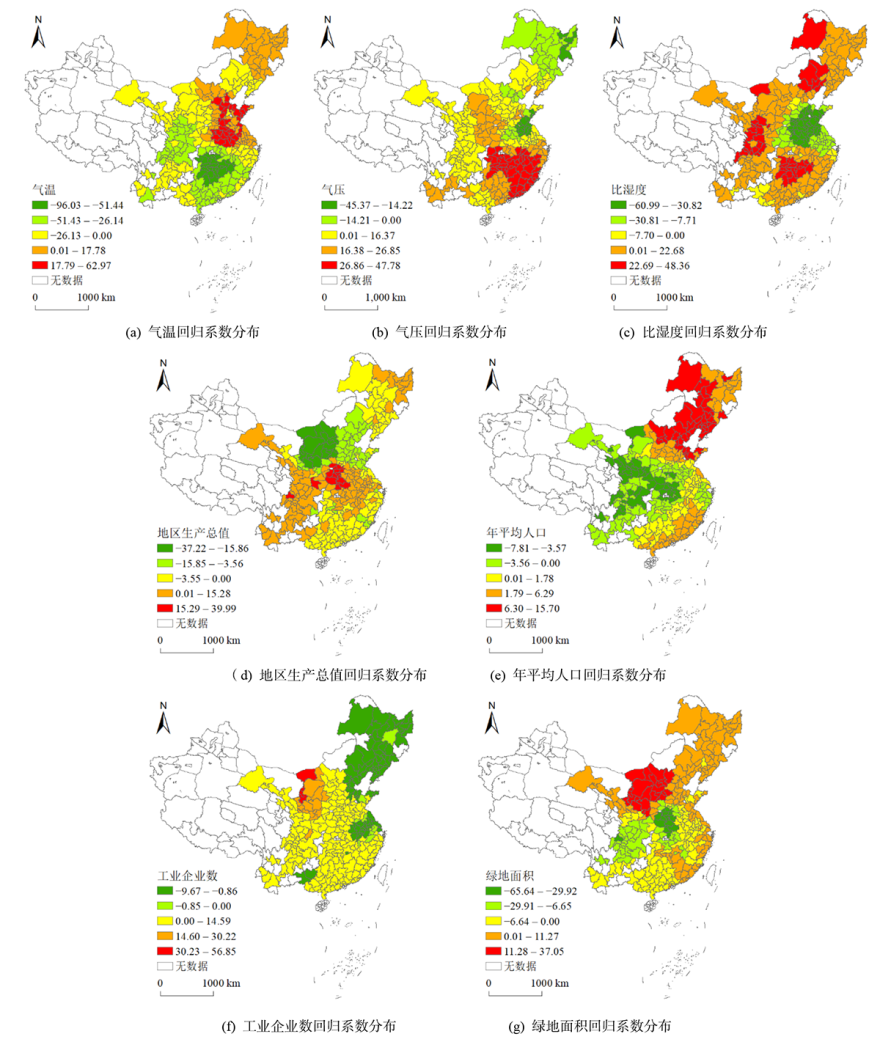
图1 2015年关键驱动因素回归系数空间分布 此图根据自然资源部标准地图服务网站下载的标准地图[审图号: GS(2020)4634号]绘制,底图无修改。下同
Figure 1 The spatial distribution of regression coefficients of the key drivers in 2015
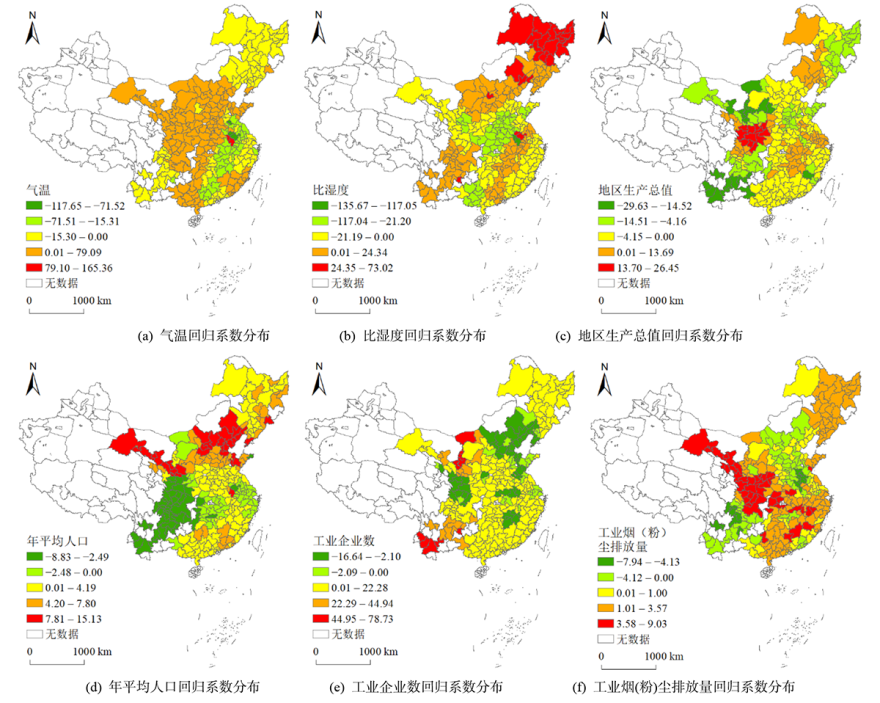
图2 2016年关键驱动因素回归系数空间分布
Figure 2 The spatial distribution of regression coefficients of the key drivers in 2016
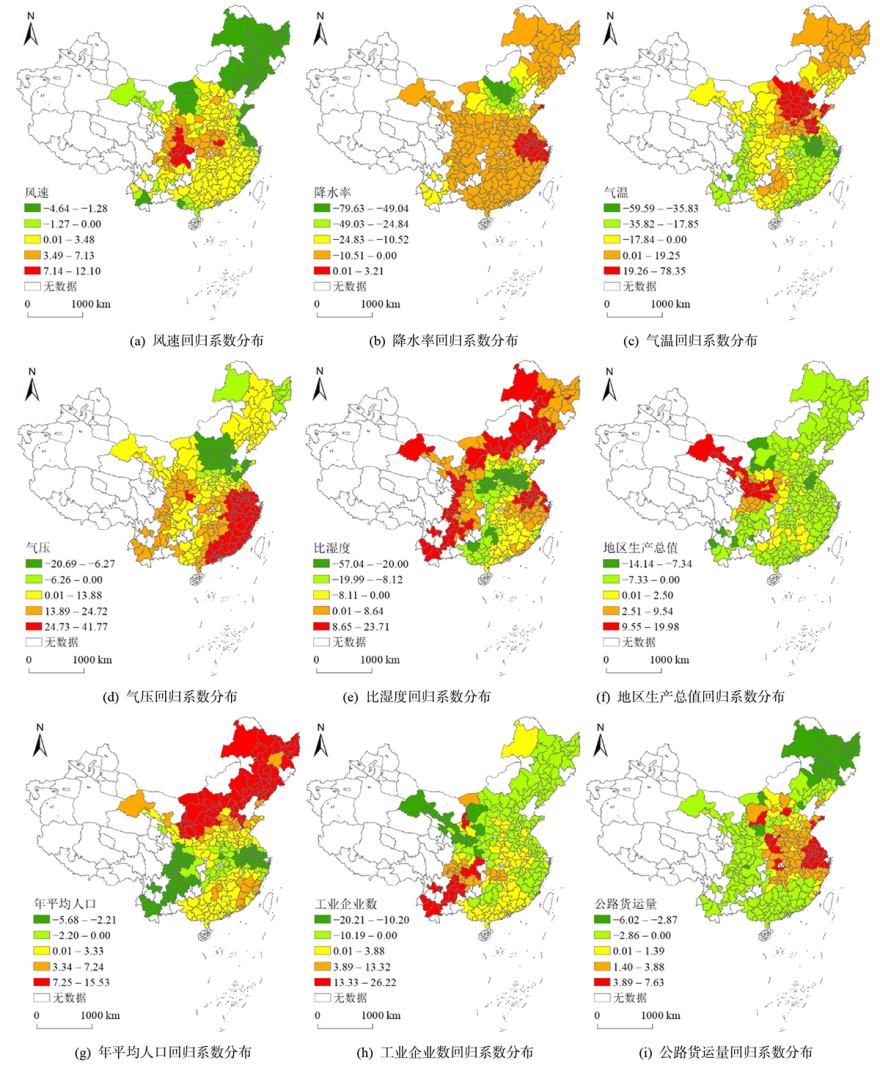
图3 2017年关键驱动因素回归系数空间分布
Figure 3 The spatial distribution of regression coefficients of the key drivers in 2017
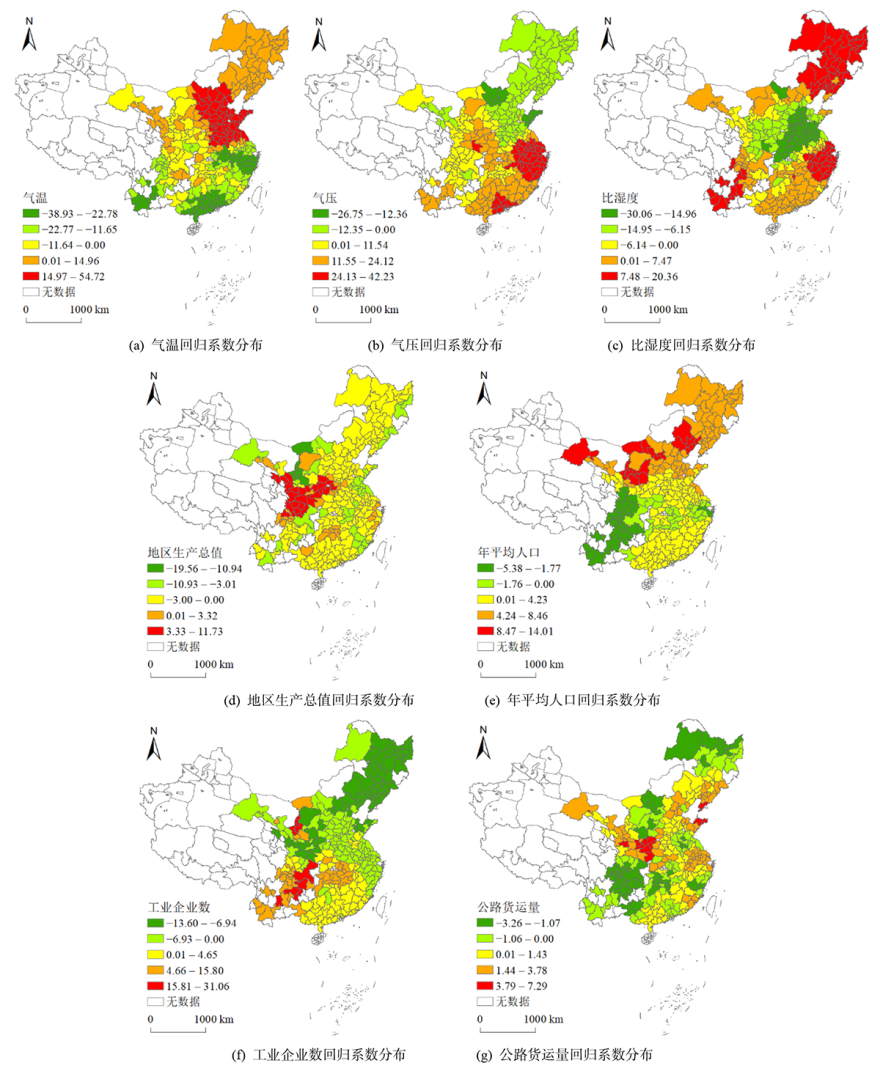
图4 2018年关键驱动因素回归系数空间分布
Figure 4 The spatial distribution of regression coefficients of the key drivers in 2018
| [1] |
BRUNSDON C, FOTHERINGHAM A S, CHARLTON M E, 1996. Geographically weighted regression: a method for exploring spatial nonstationarity[J]. Geographical Analysis, 28(4): 281-298
DOI URL |
| [2] | CAO F, GE Y, WANG J F, 2013. Optimal discretization for geographical detectors-based risk assessment[J]. GIScience & Remote Sensing, 50(1): 78-92. |
| [3] |
CHANG X, WANG S, ZHAO B, et al., 2019. Contributions of inter-city and regional transport to PM2.5 concentrations in the Beijing-Tianjin-Hebei region and its implications on regional joint air pollution control[J]. Science of the Total Environment, 660: 1191-1200.
DOI URL |
| [4] |
CHEN H, LI L, LEI Y L, et al., 2020. Public health effect and its economics loss of PM2.5 pollution from coal consumption in China[J]. Science of the Total Environment, DOI: 10.1016/j.scitotenv.2020.138973.
DOI |
| [5] |
CHEN J D, WANG B, HUANG S, et al., 2020. The influence of increased population density in China on air pollution[J]. Science of the Total Environment, DOI: 10.1016/j.scitotenv.2020.139456.
DOI |
| [6] |
CHENG N L, CHENG B F, LI S S, et al., 2019. Effects of meteorology and emission reduction measures on air pollution in Beijing during heating seasons[J]. Atmospheric Pollution Research, 10(3): 971-979.
DOI URL |
| [7] |
DING Y T, ZHANG M, QIAN X Y, et al., 2019. Using the geographical detector technique to explore the impact of socioeconomic factors on PM2.5 concentrations in China[J]. Journal of Cleaner Production, 211: 1480-1490.
DOI URL |
| [8] |
HAJILOO F, HAMZEH S, GHEYSARI M, 2019. Impact assessment of meteorological and environmental parameters on PM2.5 concentrations using remote sensing data and GWR analysis (case study of Tehran)[J]. Environmental Science and Pollution Research, 26(24): 24331-24345.
DOI URL |
| [9] |
LU D B, XU J H, YUE W Z, et al., 2020. Response of PM2.5 pollution to land use in China[J]. Journal of Cleaner Production, DOI: 10.1016/j.jclepro.2019.118741.
DOI |
| [10] |
LOU C R, LIU H Y, LI Y F, et al., 2016. Socioeconomic drivers of PM2.5 in the accumulation phase of air pollution episodes in the Yangtze River Delta of China[J]. International Journal of Environmental Research and Public Health, 13(10): 928.
DOI URL |
| [11] |
LUO W, JASIEWICZ J, STEPINSKI T, et al., 2016. Spatial association between dissection density and environmental factors over the entire conterminous United States[J]. Geophysical Research Letters, 43(2): 692-700.
DOI URL |
| [12] | MA Z Y, XIAO H W, 2017. Study on the spatial differentiation of influencing factors of PM2.5 in China: empirical analysis based on geographic weighted regression model[J]. Journal of Shanxi Finance, EC: 14-21. |
| [13] |
SONG C B, HE J J, WU L, et al., 2017. Health burden attributable to ambient PM2.5 in China[J]. Environmental Pollution, 223: 575-586.
DOI URL |
| [14] | WANG J F, HU Y, 2012. Environmental health risk detection with GeogDetector[J]. Environmental Modelling & Software, 33: 114-115. |
| [15] |
WANG J F, LI X H, CHRISTAKOS G, et al., 2010. Geographical detectors‐based health risk assessment and its application in the neural tube defects study of the Heshun Region, China[J]. International Journal of Geographical Information Science, 24(1): 107-127.
DOI URL |
| [16] |
WANG J Y, WANG S J, LI S J, 2019. Examining the spatially varying effects of factors on PM2.5 concentrations in Chinese cities using geographically weighted regression modeling[J]. Environmental Pollution, 248: 792-803.
DOI URL |
| [17] |
WANG S J, LIU X P, YANG X, et al., 2018. Spatial variations of PM2.5 in Chinese cities for the joint impacts of human activities and natural conditions: A global and local regression perspective[J]. Journal of Cleaner Production, 203: 143-152.
DOI URL |
| [18] | WHEELER D C, 2006. Diagnostic tools and remedial methods for collinearity in linear regression models with spatially varying coefficients[D]. Columbus: The Ohio State University. |
| [19] |
WU W Q, ZHANG M, DING Y T, 2020. Exploring the effect of economic and environment factors on PM2.5 concentration: a case study of the Beijing-Tianjin-Hebei region[J]. Journal of Environmental Management, DOI: 10.1016/j.jenvman.2020.110703.
DOI |
| [20] |
XU C, DONG L, YU C, et al., 2020. Can forest city construction affect urban air quality? The evidence from the Beijing-Tianjin-Hebei urban agglomeration of China[J]. Journal of Cleaner Production, DOI: 10.1016/j.jclepro.2020.121607.
DOI |
| [21] |
XU G Y, REN X D, XIONG K N, et al., 2020. Analysis of the driving factors of PM2.5 concentration in the air: A case study of the Yangtze River Delta, China[J]. Ecological Indicators, DOI: 10.1016/j.ecolind.2019.105889.
DOI |
| [22] |
ZHAO R, ZHAN L P, YAO M X, et al., 2020. A geographically weighted regression model augmented by Geodetector analysis and principal component analysis for the spatial distribution of PM2.5[J]. Sustainable Cities and Society, DOI: 10.1016/j.scs.2020.102106.
DOI |
| [23] |
ZHAO Z Q, GAO J B, WANG Y L, et al., 2015. Exploring spatially variable relationships between NDVI and climatic factors in a transition zone using geographically weighted regression[J]. Theoretical and Applied Climatology, 120(3): 507-519.
DOI URL |
| [24] |
ZHOU C S, CHEN J, WANG S J, 2018. Examining the effects of socioeconomic development on fine particulate matter (PM2.5) in China's cities using spatial regression and the geographical detector technique[J]. Science of the Total Environment, 619-620: 436-445.
DOI URL |
| [25] | 柏玲, 姜磊, 陈忠升, 2018. 长江中游城市群PM2.5时空特征及影响因素研究[J]. 长江流域资源与环境, 27(5): 960-968. |
| BAI L, JIANG L, CHEN Z S, 2018. Spatio-Temporal Characteristics of PM2.5 and Its Influencing Factors of the Urban Agglomeration in the Middle Reaches of the Yangtze Rive r[J]. Resources and Environment in the Yangtze Basin, 27(5): 960-968. | |
| [26] | 陈优良, 邹文敏, 2021. 2015-2019年长三角PM2.5时空变化特征及其影响因子分析[J/OL]. 安全与环境学报: 1-12[2021-08-11]. https://doi.org/10.13637/j.issn.1009-6094.2021 . |
| CHEN Y L, ZOU W M, 2021. Temporal-spatial characteristics of PM2.5 and impact factors analysis in Yangtze River Delta from 2015 to 2019[J/OL]. Journal of Safety and Environment: 1-12 [2021-08-11]. https://doi.org/10.13637/j.issn.1009-6094.2021 . | |
| [27] | 邓悦, 刘纪平, 刘洋, 等, 2018. 北京PM2.5浓度空间分布的贝叶斯地理加权回归模拟[J]. 测绘科学, 43(10): 39-45, 59. |
| DENG Y, LIU J P, LIU Y, et al., 2018. Spatial distribution estimation of PM2.5 concentration in Beijing by applying Bayesian geographic weighted regression model[J]. Science of Surveying and Mapping, 43(10): 39-45, 59. | |
| [28] | 段杰雄, 翟卫欣, 程承旗, 等, 2018. 中国PM2.5污染空间分布的社会经济影响因素分析[J]. 环境科学, 39(5): 2498-2504. |
| DUAN J X, ZHAI W X, CHENG C Q, et al., 2018. Socio-economic factors influencing the spatial distribution of PM2.5 concentrations in China: An exploratory analysis[J]. Environmental Science, 39(5): 2498-2504. | |
| [29] | 龚光彩, 江晨阳, 刘日明, 2018. 环境信息关联模型及植被对PM2.5浓度的影响研究[J]. 安全与环境学报, 18(3): 1184-1190. |
| GONG G C, JIANG C Y, LIU R M, 2018. An environmental information association model and influence of the vegetation on PM2.5 concentration[J]. Journal of Safety and Environment, 18(3): 1184-1190. | |
| [30] | 郭春月, 王文军, 胡泊, 等, 2016. 济宁市冬春季大气PM2.5与气象因素相关性研究[J]. 环境与健康杂志, 33(8): 715-718. |
| GUO C Y, WANG W J, HU B, et al., 2016. Correlation between PM2.5 and meteorological factors in Ji'ning in winter and spring[J]. Journal of Environment and Health, 33(8): 715-718. | |
| [31] | 汉瑞英, 陈健, 王彬, 2016. 利用LUR模型模拟杭州市PM2.5质量浓度空间分布[J]. 环境科学学报, 36(9): 3379-3385. |
| HAN R Y, CHEN J, WANG B, 2016. Application of LUR models for simulating the spatial distribution of PM2.5 concentration in Hangzhou, China[J]. Acta Scientiae Circumstantiae, 36(9): 3379-3385. | |
| [32] |
贺祥, 林振山, 刘会玉, 等, 2016. 基于灰色关联模型对江苏省PM2.5浓度影响因素的分析[J]. 地理学报, 71(7): 1119-1129.
DOI |
| HE X, LIN Z S, LIU H Y, et al., 2016. Analysis of the driving factors of PM2.5 in Jiangsu province based on grey correlation model[J]. Acta Geographica Sinica, 71(7): 1119-1129. | |
| [33] | 黄小刚, 邵天杰, 赵景波, 等, 2019. 汾渭平原PM2.5浓度的影响因素及空间溢出效应[J]. 中国环境科学, 39(8): 3539-3548. |
| HUANG X G, SHAO T J, ZHAO J B, et al., 2019. Influence factors and spillover effect of PM2.5 concentration on Fen-wei Plain[J]. China Environmental Science, 39(8): 3539-3548. | |
| [34] | 黄小刚, 赵景波, 曹军骥, 等, 2020. 长江经济带PM2.5分布格局演变及其影响因素[J]. 环境科学, 41(3): 1013-1024. |
| HUANG X G, ZHAO J B, CAO J J, et al., 2020. Evolution of the distribution of PM2.5 concentration in the Yangtze River Economic Belt and its influencing factors[J]. Environmental Science, 41(3): 1013-1024. | |
| [35] |
刘海猛, 方创琳, 黄解军, 等, 2018. 京津冀城市群大气污染的时空特征与影响因素解析[J]. 地理学报, 73(1): 177-191.
DOI |
| LIU H M, FANG C L, HUANG J J, et al., 2018. The spatial-temporal characteristics and influencing factors of air pollution in Beijing-Tianjin-Hebei urban agglomeration[J]. Acta Geographica Sinica, 73(1): 177-191. | |
| [36] | 马忠玉, 肖宏伟, 2017. 中国区域PM2.5影响因素空间分异研究--基于地理加权回归模型的实证分析[J]. 山西财经大学学报, 39(5): 14-26. |
| MA Z Y, XIAO H W, 2017. The research on a spatial differentiation of influence factors of regional PM2.5 in China: The empirical analysis based on geographically weighted regression model[J]. Journal of Shanxi University of Finance and Economics, 39(5): 14-26. | |
| [37] | 王佳佳, 夏晓圣, 程先富, 等, 2020. 合肥市PM2.5浓度时空分布特征及影响因素分析[J]. 长江流域资源与环境, 29(6): 1413-1421. |
| WANG J J, XIA X S, CHENG X F, et al., 2020. Temporal and spatial distribution characteristics and influencing factors of PM2.5 concentration in Hefei City[J]. Resources and Environment in the Yangtze Basin, 29(6): 1413-1421. | |
| [38] |
王劲峰, 徐成东, 2017. 地理探测器: 原理与展望[J]. 地理学报, 72(1): 116-134.
DOI |
| WANG J F, XU C D, 2017. Geodetector: Principle and prospective[J]. Acta Geographica Sinica, 72(1): 116-134. | |
| [39] |
王少剑, 高爽, 陈静. 基于GWR模型的中国城市雾霾污染影响因素的空间异质性研究[J]. 地理研究, 2020, 39(3): 651-668.
DOI |
| WANG S J, GAO S, CHEN J, 2020. Spatial heterogeneity of driving factors of urban haze pollution in China based on GWR model[J]. Geographical Research, 39(3): 651-668. | |
| [40] | 王祎頔, 王真祥, 2018. 上海市PM2.5浓度变化特征及其气象因子分析[J]. 干旱区地理, 41(5): 1088-1096. |
| WANG Y D, WANG Z X, 2018. Characteristics of PM2.5 concentration variability and its meteorological factors in Shanghai[J]. Arid Land Geography, 41(5): 1088-1096. | |
| [41] | 吴健生, 廖星, 彭建, 等, 2015. 重庆市PM2.5浓度空间分异模拟及影响因子[J]. 环境科学, 36(3): 759-767. |
| WU J S, LIAO X, PENG J, et al., 2015. Simulation and influencing factors of spatial distribution of PM2.5 concentrations in Chongqing[J]. Environmental Science, 36(3): 759-767. | |
| [42] | 吴浪, 周廷刚, 温莉, 等, 2018. 基于遥感数据的PM2.5与城市化的时空关系研究--以成渝城市群为例[J]. 长江流域资源与环境, 27(9): 2142-2152. |
| WU L, ZHOU T G, WEN L, et al., 2018. Study on Spatio-Temporal Relationship Between PM2.5 and Urbanization Based on Remote Sensing Data: A Case Study of Chengdu-Chongqing Urban Agglomeration[J]. Resources and Environment in the Yangtze Basin, 27(9): 2142-2152. | |
| [43] | 谢劭峰, 周志浩, 李国弘, 2020. 南宁市PM2.5浓度与气象因素的关系[J]. 科学技术与工程, 20(2): 460-466. |
| XIE S F, ZHOU Z H, LI G H, et al., 2020. Relationship between PM2.5 concentration and meteorological factors in Nanning[J]. Science Technology and Engineering, 20(2): 460-466. | |
| [44] | 杨兴川, 赵文吉, 熊秋林, 等, 2017. 2016年京津冀地区PM2.5时空分布特征及其与气象因素的关系[J]. 生态环境学报, 26(10): 1747-1754. |
| YANG X C, ZHAO W J, XIONG Q L, et al., 2017. Spatio-temporal distribution of PM2.5 in Beijing-Tianjin-Hebei (BTH) area in 2016 and its relationship with meteorological factors [J]. Ecology and Environmental Sciences, 26(10): 1747-1754. | |
| [45] | 姚青, 蔡子颖, 刘敬乐, 等, 2020. 气象条件对2009-2018年天津地区PM2.5质量浓度的影响[J]. 环境科学学报, 40(1): 65-75. |
| YAO Q, CAI Z Y, LIU J L, et al., 2020. Effects of meteorological conditions on PM2.5 concentration in Tianjin from 2009 to 2018 [J]. Acta Scientiae Circumstantiae, 40(1): 65-75. | |
| [46] | 姚荣鹏, 张勃, 王立兵, 等, 2021. 2015-2019年中东部地区PM2.5时空演变及其驱动力[J]. 生态学杂志, 40(3): 813-824. |
| YAO R P, ZHANG B, WANG L B, et al., 2021. Spatiotemporal variations of PM2.5 and driving factors over central and eastern China between 2015 and 2019[J]. Chinese Journal of Ecology, 40(3): 813-824. | |
| [47] |
周亮, 周成虎, 杨帆, 等, 2017. 2000-2011年中国PM2.5时空演化特征及驱动因素解析[J]. 地理学报, 72(11): 2079-2092.
DOI |
| ZHOU L, ZHOU C H, YANG F, et al., 2017. Spatio-temporal evolution and the influencing factors of PM2.5 in China between 2000 and 2011[J]. Acta Geographica Sinica, 72(11): 2079-2092. | |
| [48] | 周敏丹, 匡耀求, 云国梁, 2020. 基于地理探测器的广州市大气PM2.5浓度驱动因素分析[J]. 环境科学研究, 33(2): 271-279. |
| ZHOU M D, KUANG Y Q, YUN G L, 2020. Analysis of driving factors of atmospheric PM2.5 concentration in Guangzhou City based on Geo-Detector[J]. Research of Environmental Sciences, 33(2): 271-279. | |
| [49] | 张淑平, 韩立建, 周伟奇, 等, 2016. 城市规模对大气污染物NO2和PM2.5浓度的影响[J]. 生态学报, 36(16): 5049-5057. |
| ZHANG S P, HAN L J, ZHOU W Q, et al., 2016. Impact of urban population on concentrations of nitrogen dioxide (NO2) and fine particles (PM2.5) in China[J]. Acta Ecologica Sinica, 36(16): 5049-5057. | |
| [50] | 赵晨曦, 王云琦, 王玉杰, 等, 2014. 北京地区冬春PM2.5和PM10污染水平时空分布及其与气象条件的关系[J]. 环境科学, 35(2): 418-427. |
| ZHAO C X, WANG Y Q, WANG Y J, et al., 2014. Temporal and spatial distribution of PM2.5 and PM10 pollution status and the correlation of particulate matters and meteorological factors during winter and spring in Beijing[J]. Environmental Science, 35(2): 418-427. |
| [1] | 董洁芳, 邓椿, 张仲伍. 渭河流域PM2.5时空演化及人口暴露风险[J]. 生态环境学报, 2023, 32(6): 1078-1088. |
| [2] | 王琳, 卫伟. 黄土高原典型县域生态系统服务变化特征及驱动因素[J]. 生态环境学报, 2023, 32(6): 1140-1148. |
| [3] | 王超, 杨倩楠, 张池, 刘同旭, 张晓龙, 陈静, 刘科学. 丹霞山不同土地利用方式土壤磷组分特征及其有效性[J]. 生态环境学报, 2023, 32(5): 889-897. |
| [4] | 李建辉, 党争, 陈琳. 黄河几字弯都市圈PM2.5时空特征及影响因素分析[J]. 生态环境学报, 2023, 32(4): 697-705. |
| [5] | 张林, 齐实, 周飘, 伍冰晨, 张岱, 张岩. 北京山区针阔混交林地土壤有机碳含量的影响因素研究[J]. 生态环境学报, 2023, 32(3): 450-458. |
| [6] | 何艳虎, 龚镇杰, 吴海彬, 蔡宴朋, 杨志峰, 陈晓宏. 粤港澳大湾区城市生态效率时空演变及影响因素[J]. 生态环境学报, 2023, 32(3): 469-480. |
| [7] | 郝金虎, 韦玮, 李胜男, 马牧源, 李肖夏, 杨洪国, 姜琦宇, 柴沛东. 基于GEE平台的京津冀长时序水体时空格局及其影响因素[J]. 生态环境学报, 2023, 32(3): 556-566. |
| [8] | 王成武, 罗俊杰, 唐鸿湖. 基于InVEST模型的太行山沿线地区生态系统碳储量时空分异驱动力分析[J]. 生态环境学报, 2023, 32(2): 215-225. |
| [9] | 张莉, 李铖, 谭皓泽, 韦家怡, 程炯, 彭桂香. 广州典型城市林地对大气颗粒物的削减效应及影响因素[J]. 生态环境学报, 2023, 32(2): 341-350. |
| [10] | 付蓉, 武新梅, 陈斌. 城市地表温度空间分异及驱动因子差异性分析——以合肥市为例[J]. 生态环境学报, 2023, 32(1): 110-122. |
| [11] | 郑晓豪, 陈颖彪, 郑子豪, 郭城, 黄卓男, 周泳诗. 湖北省生态系统服务价值动态变化及其影响因素演变[J]. 生态环境学报, 2023, 32(1): 195-206. |
| [12] | 袁林江, 李梦博, 冷钢, 钟冰冰, 夏大朋, 王景华. 厌氧环境下硫酸盐还原与氨氧化的协同作用[J]. 生态环境学报, 2023, 32(1): 207-214. |
| [13] | 刘希林, 卓瑞娜. 崩岗崩积体坡面初始产流时间影响因素及其临界阈值[J]. 生态环境学报, 2023, 32(1): 36-46. |
| [14] | 李威闻, 黄金权, 齐瑜洁, 刘小岚, 刘纪根, 毛治超, 高绣纺. 土壤侵蚀条件下土壤微生物生物量碳含量变化及其影响因素的Meta分析[J]. 生态环境学报, 2023, 32(1): 47-55. |
| [15] | 江明, 张子洋, 李婷婷, 林勃机, 张正恩, 廖彤, 袁鸾, 潘苏红, 李军, 张干. 基于氮同位素的珠三角典型地区大气PM2.5中NH4+来源解析[J]. 生态环境学报, 2022, 31(9): 1840-1848. |
| 阅读次数 | ||||||
|
全文 |
|
|||||
|
摘要 |
|
|||||