生态环境学报 ›› 2022, Vol. 31 ›› Issue (1): 17-25.DOI: 10.16258/j.cnki.1674-5906.2022.01.003
殷祚云1,2,3( )
)
收稿日期:2021-08-13
出版日期:2022-01-18
发布日期:2022-03-10
YIN Zuoyun1,2,3()
Received:2021-08-13
Online:2022-01-18
Published:2022-03-10
Supported by:摘要:
生物群落中物种多度分布(species abundance distribution)呈典型的倒J形,即其中存在许多稀有种、少量常见种。物种多度分布模型研究有助于解决森林生态恢复中的物种配置等实际问题。本研究考察了一种过分散(over-dispersion,或称超分布,即方差大于均值)的离散型分布,即具有λ和α两个参数的广义泊松(generalized Poisson,GP)分布,能否描述群落中物种多度格局,其参数是否与物种多样性有关。以位于华南地区的鼎湖山生物圈保护区中南亚热带针阔叶混交林为研究对象,利用此群落中乔木层、灌木层和草本层3个层次的物种多度数据,进行了模型拟合与对比研究。采用最大或然法和试值法,在数学工具软件Mathematica 4中编制计算程序,完成分布模型参数的估计;采用卡方检验法考察模型对数据的适合度,再运用Akaike信息准则(AIC)和一致性Akaike信息准则(CAIC)对不同模型间的适合性进行比较。结果表明:(1)本森林群落中乔木层、灌木层和草本层全部3个层次的实测物种多度分布图都呈现相似的倒J形曲线,在统计学上均可用零截断的广义泊松分布进行较好地拟合;(2)从乔木层、灌木层到草本层,λ显著增加,而α则略有减少,且后者的变化趋势与Shannon-Wiener多样性指数和均匀性指数一致,表明参数α可作为群落中物种多样性的量度;(3)通过广义泊松分布和泊松对数正态(Poisson lognormal,PLN)分布的模拟比较可知,前者更适合定量描述群落3层次的物种多度数据,从而能更好地估计出本群落潜在的物种丰富度。群落中全部物种多度的超分布与其每个组成物种种群的超分布(即在空间上呈现聚集分布格局)有关。由于广义泊松分布模型比泊松对数正态分布模型更适合仿真过分散分布的实测物种多度计数数据,因而前者的应用前景可能比后者更广泛,特别是用于估计森林群落中(乃至在当地和区域尺度上)的潜在物种丰富度以及确定退化森林生态恢复的物种配置比例。
中图分类号:
殷祚云. 南亚热带森林3层次物种多度之广义泊松分布模型[J]. 生态环境学报, 2022, 31(1): 17-25.
YIN Zuoyun. Using Generalized Poisson Distribution to Model the Patterns of Species Abundances in Three Layers of South Subtropical Forest[J]. Ecology and Environment, 2022, 31(1): 17-25.
| Layer | Area/m2 | S | N | Min | Max | Median | Mode | m | v | v/m ratio | Dsw | Esw |
|---|---|---|---|---|---|---|---|---|---|---|---|---|
| Tree | 10000 | 69 | 3890 | 1 | 772 | 3 | 1 | 56.38 | 19317.30 | 342.65 | 3.923 | 0.642 |
| Shrub | 625 | 39 | 428 | 1 | 83 | 3 | 1 | 10.97 | 340.97 | 31.07 | 4.010 | 0.759 |
| Herb | 25 | 32 | 151 | 1 | 29 | 2 | 1 | 4.72 | 35.24 | 7.47 | 4.207 | 0.841 |
Table 1 The descriptive statistics of species abundances in the tree, shrub and herb layers of evergreen needle- and broad-leaved mixed forest community in Dinghushan Biosphere Reserve, South China
| Layer | Area/m2 | S | N | Min | Max | Median | Mode | m | v | v/m ratio | Dsw | Esw |
|---|---|---|---|---|---|---|---|---|---|---|---|---|
| Tree | 10000 | 69 | 3890 | 1 | 772 | 3 | 1 | 56.38 | 19317.30 | 342.65 | 3.923 | 0.642 |
| Shrub | 625 | 39 | 428 | 1 | 83 | 3 | 1 | 10.97 | 340.97 | 31.07 | 4.010 | 0.759 |
| Herb | 25 | 32 | 151 | 1 | 29 | 2 | 1 | 4.72 | 35.24 | 7.47 | 4.207 | 0.841 |
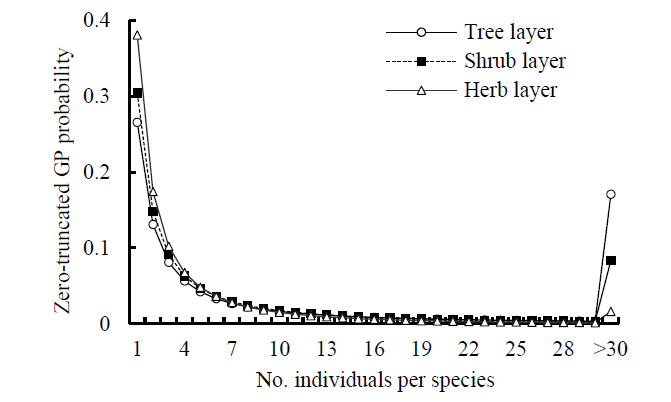
Figure 1 Comparisons of the zero-truncated generalized Poisson (GP) distributions fitted to the SAD data among the tree, shrub, and herb layers of evergreen needle- and broad-leaved mixed forest community in Dinghushan Biosphere Reserve, South China
| Layer | λ | α | P(χ2) | P0 | S* | M' | V' | S*(α) |
|---|---|---|---|---|---|---|---|---|
| Tree | 27.345 | 1.470 | 0.395 | 0.515 | 142.3 | 56.38 | 94073.15 | 139.8 |
| Shrub | 4.908 | 1.483 | 0.160 | 0.553 | 87.2 | 10.97 | 685.64 | 79.5 |
| Herb | 1.676 | 1.682 | 0.066 | 0.645 | 90.1 | 4.72 | 54.49 | 71.4 |
Table 2 Fitting results of the zero-truncated generalized Poisson (GP) distributions to the species abundance distributions (SADs) in the tree, shrub, and herb layers of evergreen needle-and broad-leaved mixed forest community in Dinghushan Biosphere Reserve, South China
| Layer | λ | α | P(χ2) | P0 | S* | M' | V' | S*(α) |
|---|---|---|---|---|---|---|---|---|
| Tree | 27.345 | 1.470 | 0.395 | 0.515 | 142.3 | 56.38 | 94073.15 | 139.8 |
| Shrub | 4.908 | 1.483 | 0.160 | 0.553 | 87.2 | 10.97 | 685.64 | 79.5 |
| Herb | 1.676 | 1.682 | 0.066 | 0.645 | 90.1 | 4.72 | 54.49 | 71.4 |
| Layer | GP | PLN | |||||
|---|---|---|---|---|---|---|---|
| lnL | AIC | CAIC | lnL | AIC | CAIC | ||
| Tree | -265.3 | 267.3 | 541.0 | -930.7 | 932.7 | 1876.0 | |
| Shrub | -116.9 | 118.9 | 243.1 | -117.5 | 119.5 | 247.9 | |
| Herb | -74.0 | 76.0 | 157.0 | -74.7 | 76.7 | 161.4 | |
Table 3 Comparisons of the goodness of fit between the generalized Poisson (GP) and Poisson lognormal (PLN) distributions in describing the species abundance distributions (SADs) of the tree, shrub, and herb layers of evergreen needle- and broad-leaved mixed forest community in Dinghushan Biosphere Reserve, South China
| Layer | GP | PLN | |||||
|---|---|---|---|---|---|---|---|
| lnL | AIC | CAIC | lnL | AIC | CAIC | ||
| Tree | -265.3 | 267.3 | 541.0 | -930.7 | 932.7 | 1876.0 | |
| Shrub | -116.9 | 118.9 | 243.1 | -117.5 | 119.5 | 247.9 | |
| Herb | -74.0 | 76.0 | 157.0 | -74.7 | 76.7 | 161.4 | |
| [1] | AKAIKE H, 1973. Information theory and an extension of maximum likelihood principle[C]// PETROV B N, CSAKI F. Proceedings of the Second International Symposium of Information Theory. Budapest: Akademiai Kiado. |
| [2] | AN W L, LU Y H, XIE W, et al., 2021. Mixed sowing of arbor, shrub and herb seeds based on near natural vegetation restoration[J]. Soil and Water Conservation in China, 8: 40-43. |
| [3] | AZIZ L, CHASANI A R, 2020. Perbandingan Struktur Dan Komposisi Makroalga Di Pantai Drini Dan Pantai Krakal[J]. Jurnal Kelautan Indonesian (Journal of Marine Science and Technology), 13(2): 75-86. |
| [4] |
BROWN J H, MEHLMAN D W, STEVENS G C, 1995. Spatial variation in abundance[J]. Ecology, 76(7): 2028-2043.
DOI URL |
| [5] |
BULMER M G, 1974. On fitting the Poisson lognormal distribution to species abundance data[J]. Biometrics, 30: 101-110.
DOI URL |
| [6] | CHEN C R, AN W L, GAO Y F, et al., 2020. Comparison of species diversity of understory vegetation of Cunninghamia lanceolata with different densities in northern Guangdong[J]. Forestry and Environmental Science, 36(5): 73-78. |
| [7] |
CONDIT R, ASHTON P S, BAKER P, et al., 2000. Spatial patterns in the distribution of tropical tree species[J]. Science, 288(5470): 1414-1418.
DOI URL |
| [8] | CONSUL P C, 1989. Generalized Poisson distribution: Properties and applications[M]. NY: Marcel Dekker. |
| [9] |
CONSUL P C, JAIN G C, 1973. A generalization of the Poisson distribution[J]. Technometrics, 15: 791-799.
DOI URL |
| [10] |
ENGEN S, 2001. A dynamic and spatial model with migration generating the log-Gaussian field of population densities[J]. Mathematical Biosciences, 173(2): 85-102.
DOI URL |
| [11] |
ETIENNE R S, OLFF H, 2004. A novel genealogical approach to neutral biodiversity theory[J]. Ecology Letters, 7(3): 170-175.
DOI URL |
| [12] |
FAMOYE F, 1993. Restricted generalized Poisson regression model[J]. Communications in Statistics-Theory and Methods, 22(5): 1335-1354.
DOI URL |
| [13] |
FESL C, 2002. Biodiversity and resource use of larval chironomids in relation to environmental factors in a large river[J]. Freshwater Biology, 47(6): 1065-1087.
DOI URL |
| [14] | GLOVER T J, MITCHELL K J, 2001. An Introduction to Biostatistics[M]. NY: McGraw-Hill Companies, Inc. |
| [15] | GREIG-SMITH P, 1983. Quantitative Plant Ecology[M]. 3rd ed. Oxford: Blackwell. |
| [16] |
GRUNDY P M, 1951. The expected frequencies in a sample of an animal population in which the abundances of the species are log-normally distributed: Part I[J]. Biometrika, 38(3-4): 427-434.
DOI URL |
| [17] | GURMU S, TRIVEDI P K, 1996. Excess zeros in count models for recreation trips[J]. Journal of Business and Economic Statistics, 14(4): 469-477. |
| [18] | HE F, LEGENDRE P, 2002. Species diversity patterns derived from species-area models[J]. Ecology, 83(5): 1185-1198. |
| [19] |
HE F, LEGENDRE P, LAFRANKIE J V, 1997. Distribution patterns of tree species in a Malaysian tropical rain forest[J]. Journal of Vegetation Science, 8(1): 105-114.
DOI URL |
| [20] |
KEMPTON R A, TAYLOR L R, 1974. Log-series and log-normal parameters as diversity discriminants for the Lepidopterat[J]. Journal of Animal Ecology, 43: 381-399.
DOI URL |
| [21] | KREBS C J, 1978. Ecology: The Experimental Analysis of Distribution and Abundance[M]. 2nd ed. NY: Harper & Row Publishers. |
| [22] | KREBS C J, 2001. Ecology: the Experimental Analysis of Distribution and Abundance[M]. 5th ed. CA: Benjamin Cummings. |
| [23] | LI C R, GAO Y F, LIU Z F, et al., 2021. Species diversity analysis of Chinese fir forest in Ruyang forest farm[J]. Forestry and Environmental Science, 37(4): 122-128. |
| [24] | LV Y Y, GAO Y F, XIE W, et al., 2020. Comparative study on plant community structure in eucalyptus plantations of different slope directions[J]. Eucalypt Science & Technology, 37(3): 10-16. |
| [25] | MAY R M, 1975. Patterns of species abundance and diversity[C]// CODY M T, DIAMOND J M. Ecology and Evolution of Community. Cambridge: Harvard University Press: 81-120. |
| [26] |
MCGILL B J, 2003. Does Mother Nature really prefer rare species or are log-left-skewed SADs a sampling artefact?[J]Ecology Letters, 6(8): 766-773.
DOI URL |
| [27] |
MCGILL B J, ETIENNE R S, GRAY J S, et al., 2007. Species abundance distributions: moving beyond single prediction theories to integration within an ecological framework[J]. Ecology Letters, 10(10): 995-1015.
DOI URL |
| [28] |
MELKERSSON M, ROOTH D O, 2000. Modeling female fertility using inflated count data models[J]. Journal of Population Economics, 13: 189-203.
DOI URL |
| [29] |
MILLER R I, WIEGERT R G, 1989. Documenting completeness, species-area relations, and the species-abundance distribution of a regional flora[J]. Ecology, 70(1): 16-22.
DOI URL |
| [30] | MOLLES M C, 1999. Ecology: Concepts and Applications[M]. NY: McGraw-Hill Companies, Inc. |
| [31] | NOVOTNY V, 1993. What can be inferred from species diversity indices?[J]Coenoses, 8: 25-26. |
| [32] | PENG S L, 1996. Community Dynamics in Lower Subtropical Forests[M]. Beijing: Science Press. |
| [33] | PENG S L, YIN Z Y, REN H, et al., 2003. Advances in research on the species-abundance relationship models in multi-species collection[J]. Acta Ecologica Sinica, 23: 1590-1605. |
| [34] | PIELOU E C, 1977. Mathematical Ecology[M]. NY: Wiley-Interscience. |
| [35] |
PRESTON F W, 1948. The commonness and rarity of species[J]. Ecology, 29(3): 254-283.
DOI URL |
| [36] |
SLOCOMB J, STAUFFER B, DICKSON K L, 1977. On fitting the truncated lognormal distribution to species-abundance data using maximum likelihood estimation[J]. Ecology, 58(3): 693-696.
DOI URL |
| [37] |
SUGIHARA G, 1980. Minimal community structure: An explanation of species abundance pattern[J]. American Naturalist, 116(6): 770-787.
DOI URL |
| [38] |
TUENTER H J H, 2000. On the generalized Poisson distribution[J]. Statistica Neerlandica, 54(3): 374-376.
DOI URL |
| [39] |
VILLA P M, MARTINS S V, RODRIGUES A C, et al., 2019. Testing species abundance distribution models in tropical forest successions: Implications for fine-scale passive restoration[J]. Ecological Engineering, 135: 28-35.
DOI URL |
| [40] |
WANG W, FAMOYE F, 1997. Modeling household fertility decisions with generalized Poisson regression[J]. Journal of Population Economics, 10(3): 273-283.
DOI URL |
| [41] | WEI S G, LI L, CHEN Z C, et al., 2014. Which Models Are Appropriate for Six Subtropical Forests: Species-Area and Species-Abundance Models[J]. PLOS ONE, 9(4): 1-9. |
| [42] |
WHITTAKER R H, 1965. Dominance and diversity in land plant communities[J]. Science, 147(3655): 250-260.
DOI URL |
| [43] | XIAN G B, XIAN W G, YIN Z Y, et al., 2014. Plant species diversity of Cunninghamia lanceolata forest cutover lands after improvement by planting broadleaved trees at Yunyong of Foshan, south China[J]. Guangdong Forestry Science and Technology, 30(6): 52-56. |
| [44] | YIN Z Y, 1998. Research on natural regeneration of Pinus massoniana ecological forest in Guangdong Province[D]. Guangzhou: Sun Yat-Sen University (Zhongshan University): 1-65. |
| [45] | YIN Z Y, 2005. Modeling on Species Abundance and Distribution Patterns in Plant Communities[D]. Guangzhou:South China Botanical Garden; Beijing: Graduate School, the Chinese Academy of Sciences: 1-97. |
| [46] | YIN Z Y, 2018. My views on the protection and restoration of natural forests: a case study of Guangdong Province[C]// ZHENG H, HU X W, LIANG H Z, et al. Proceedings of seminars on the biodiversity around South China Sea and the national park pilot construction. Haikou: Hainan Association for Science and Technology, Hainan University: 33. |
| [47] |
YIN Z Y, GUO Q F, REN H, et al., 2005b. Seasonal changes in spatial patterns of two annual plants in the Chihuahuan Desert, USA[J]. Plant Ecology, 178(2): 189-199.
DOI URL |
| [48] | YIN Z Y, LIAO W B, 1999. Studies on lognormal distribution patterns of species abundance of south subtropical forest community, China[J]. Guihaia, 19(3): 221-224. |
| [49] |
YIN Z Y, PENG S L, REN H, et al., 2005a. LogCauchy, log-sech and lognormal distributions of species abundances in forest communities[J]. Ecological Modelling, 184(2-4): 329-340.
DOI URL |
| [50] |
YIN Z Y, REN H, ZHANG Q M, et al., 2005c. Species abundance in a forest community in South China: A case of Poisson lognormal distribution[J]. Journal of Integrative Plant Biology, 47(7): 801-810.
DOI URL |
| [51] | YIN Z Y, REN H, PENG S L, et al., 2009. Dynamics and modeling of species abundance distribution during natural restoration of degraded hilly grassland in south China[J]. Ecology and Environmental Sciences, 18(1): 222-228. |
| [52] | YIN Z Y, ZENG L H, HE B X, et al., 2013. Statistical distribution models of body sizes of young Castanopsis hystrix in an urban landscape forest[J]. Ecology and Environmental Sciences, 22(2): 189-198. |
| [53] | YIN Z Y, ZENG L H, LIAN H M, et al., 2014. The Study of Relationships between Plants Introduction and Native Species Diversity in Secondary Forest[J]. Guangdong Forestry Science and Technology, 30(6): 15-19. |
| [54] | YIN Z Y, ZENG L, LUO S M, et al., 2018. Examining the Patterns and Dynamics of Species Abundance Distributions in Succession of Forest Communities by Model Selection[J]. PLOS ONE, 13(5): 1-15. |
| [55] | ZENG L H, YIN Z Y, 2013. The Management of Secondary Tropical Forests[M]. Guangzhou:Guangdong Science and Technology Press,Guangdong Publishing Group: 1-165. |
| [56] | ZHANG Q M, HUANG Z L, LIU S Z, et al., 2002. The community structure of coniferous and broad-leaved mixed forest in Dinghushan[C]// Dinghushan Forest Ecosystem Research Station. Tropical and Subtropical Forest Ecosystem (Volume 9). Beijing: China Environmental Science Press: 18-27. |
| [57] | ZHONG Y H, AN W L, XIE W, et al., 2021. Study on near natural vegetation restoration based on mixed planting of tree, shrub and grass seeds[J]. Applied Technology of Soil and Water Conservation, 1: 1-3, 12. |
| [1] | 王雪梅, 杨雪峰, 赵枫, 安柏耸, 黄晓宇. 基于机器学习算法的干旱区绿洲地上生物量估算[J]. 生态环境学报, 2023, 32(6): 1007-1015. |
| [2] | 陈科屹, 林田苗, 王建军, 何友均, 张立文. 天保工程20年对黑龙江大兴安岭国有林区森林碳库的影响[J]. 生态环境学报, 2023, 32(6): 1016-1025. |
| [3] | 张兴旺, 谢艳萍, 吴晓敏, 李垚, 肖书平. 福建省明溪县极小种群野生植物喜树种群结构与动态特征[J]. 生态环境学报, 2023, 32(6): 1037-1044. |
| [4] | 杜彩艳, 杨鹏, 蜂述先, 毛妍婷, 陶琼, 此主拉姆, 彭慧娉, 和建美, 李卫林. 不同生态区维西糯山药品质与生态因子相关性研究[J]. 生态环境学报, 2023, 32(6): 1053-1061. |
| [5] | 翁升恒, 张玉琴, 姜冬昕, 潘卫华, 李丽纯, 张方敏. 福建省森林植被NEP时空变化及影响因子分析[J]. 生态环境学报, 2023, 32(5): 845-856. |
| [6] | 巫晨煜, 许帆帆, 魏士博, 樊晶晶, 刘观鹏, 王坤. 渭河流域地表植被覆盖对气候变化的响应研究[J]. 生态环境学报, 2023, 32(5): 835-844. |
| [7] | 郝蕾, 翟涌光, 戚文超, 兰穹穹. 2001-2020年内蒙古植被碳源/碳汇时空动态及对气候因子的响应[J]. 生态环境学报, 2023, 32(5): 825-834. |
| [8] | 李阳, 侯志勇, 陈薇, 于晓英, 谢永宏, 黄鑫, 谭佩阳, 李继承, 黎尚林, 杨辉. 大围山高山湿地植物多样性与区系组成研究[J]. 生态环境学报, 2023, 32(4): 643-650. |
| [9] | 胡芳, 刘聚涛, 温春云, 韩柳, 文慧. 抚河流域浮游植物群落结构特征及其水生态状况评价[J]. 生态环境学报, 2023, 32(4): 744-755. |
| [10] | 李善家, 王兴敏, 刘海锋, 孙梦格, 雷雨昕. 河西走廊荒漠植物多样性及其对环境因子的响应[J]. 生态环境学报, 2023, 32(3): 429-438. |
| [11] | 李晖, 李必龙, 葛黎黎, 韩琛惠, 杨倩, 张岳军. 2000-2021年汾河流域植被时空演变特征及地形效应[J]. 生态环境学报, 2023, 32(3): 439-449. |
| [12] | 徐晨, 裴顺祥, 吴莎, 郭慧, 马淑敏, 吴迪, 章尧想, 法蕾. 北京九龙山不同林型林间大气主要BVOCs组成研究[J]. 生态环境学报, 2023, 32(2): 245-255. |
| [13] | 张鐥文, 杨冉, 侯文星, 王丽丽, 刘爽, 宋汉扬, 赵文吉, 李令军. 生态补水前后永定河两岸植被覆盖度变化及驱动力分析[J]. 生态环境学报, 2023, 32(2): 264-273. |
| [14] | 宋志斌, 周佳诚, 谭路, 唐涛. 高原河流着生藻类群落沿海拔梯度的变化特征--以西藏黑曲、雪曲为例[J]. 生态环境学报, 2023, 32(2): 274-282. |
| [15] | 贾志峰, 刘鹏程, 刘宇, 吴博博, 陈丹姿, 张向飞. 气候变化和人类活动对松辽流域植被覆盖的影响[J]. 生态环境学报, 2023, 32(1): 1-10. |
| 阅读次数 | ||||||
|
全文 |
|
|||||
|
摘要 |
|
|||||