生态环境学报 ›› 2025, Vol. 34 ›› Issue (2): 181-196.DOI: 10.16258/j.cnki.1674-5906.2025.02.002
陶德凯1,2,*( ), 张子建1
收稿日期:2024-08-20
出版日期:2025-02-18
发布日期:2025-03-03
通讯作者:
*陶德凯(1978年生),男,副教授,博士,主要研究方向为国土空间规划、城乡空间绿色发展。E-mail: dk_tao@126.com。基金资助:
TAO Dekai1,2,*(), ZHANG Zijian1
Received:2024-08-20
Online:2025-02-18
Published:2025-03-03
摘要:
探析国土空间绿色发展水平与生态系统服务之间的耦合关系对于协同区域生态经济发展具有重要意义。该研究从资源承载力、环境承载力、国土空间开发程度及土地利用集约程度等4个方面构建国土空间绿色发展评价体系;采用单位面积价值当量因子法测算江苏省2010-2020年生态系统服务价值;通过耦合协调度和标准差椭圆模型分析二者之间的耦合协调关系,并据此划分管制分区。结果显示:1)江苏省国土空间绿色发展水平持续提升,整体增长1.20,增幅达21.1%,较高水平的城市由3个增至10个;2)江苏省生态系统服务价值持续增加,其中水域生态系统服务价值占比最大,其次为耕地;3)江苏省国土空间绿色发展水平与生态系统服务的耦合协调度总体处于低水平协调阶段,呈现东西方向扩张、南北方向收缩的趋势,除镇江市有所下降,其他城市均有所上升,所处阶段基本稳定但呈现向好态势;4)将江苏省划分为生态系统服务与绿色发展水平高质量协调地区、生态系统服务滞后地区、绿色发展水平滞后地区、生态系统服务与绿色发展低水平失调地区等4种类型。研究结果可为江苏省协调经济发展和生态保护、评定并适时调整区域发展模式提供依据。
中图分类号:
陶德凯, 张子建. 江苏省国土空间绿色发展水平与生态系统服务耦合协同关系研究[J]. 生态环境学报, 2025, 34(2): 181-196.
TAO Dekai, ZHANG Zijian. A Study on the Coupling and Synergistic Relationship between the Level of Territorial Space Green Development and Ecosystem Services in Jiangsu Province[J]. Ecology and Environment, 2025, 34(2): 181-196.
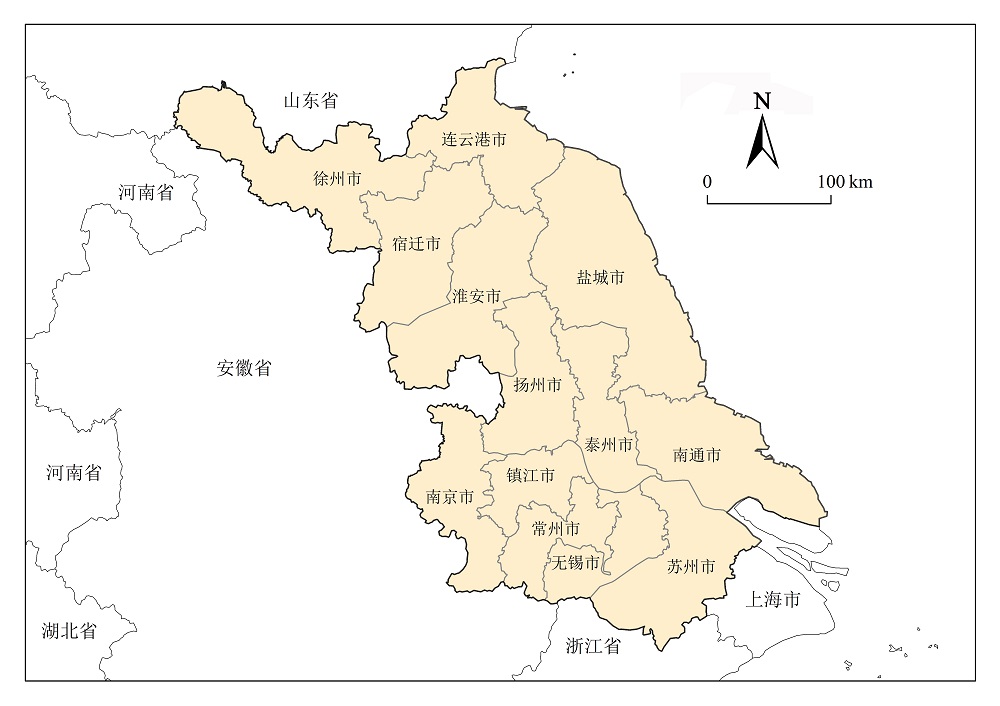
图1 江苏省行政区划 审图号:GS(2024)0650号,源于国家基础地理信息中心。底图无修改
Figure 1 Administrative divisions of Jiangsu Province
| 准则层 | 一级指标 | 二级指标 | 单位 | 指标属性 | 表征内涵 | 熵权法 | 变异系数法 | CRITIC法 | 综合权重 |
|---|---|---|---|---|---|---|---|---|---|
| 资源环境承载能力 | 资源 承载力 | 每万元GDP供水量 | m3 | − 1) | 反映水资源利用水平 | 0.01532 | 0.02668 | 0.04199 | 0.02800 |
| 每万元GDP CO2排放量 | t | − | 衡量区域资源利用水平 | 0.01619 | 0.02913 | 0.03933 | 0.02822 | ||
| 工业用水重复利用率 | % | +2) | 反映资源利用集约节约水平 | 0.01279 | 0.02411 | 0.03994 | 0.02561 | ||
| 林木覆盖率 | % | + | 反映区域植被覆盖情况 | 0.03945 | 0.04591 | 0.05295 | 0.04610 | ||
| 人均农作物播种面积 | m2 | + | 反映区域农业基础种植规模 | 0.07807 | 0.06603 | 0.07311 | 0.07240 | ||
| 环境 承载力 | 空气质量优良天数比率 | % | + | 反映区域大气质量情况 | 0.05315 | 0.05566 | 0.08121 | 0.06334 | |
| 城市建成区绿化覆盖率 | % | + | 反映区域绿化程度 | 0.03046 | 0.04053 | 0.04277 | 0.03792 | ||
| 人均公园绿地面积 | m2 | + | 反映区域绿化程度 | 0.03800 | 0.04698 | 0.04442 | 0.04313 | ||
| 生活垃圾无害化处理量 | 104 t | + | 反映污染治理能力 | 0.14544 | 0.10873 | 0.04704 | 0.10040 | ||
| 一般工业固体废弃物 综合利用率 | % | + | 反映工业生产污染治理能力 | 0.02970 | 0.04036 | 0.05734 | 0.04247 | ||
| 城镇污水处理率 | % | + | 反映污染治理能力 | 0.05087 | 0.04988 | 0.05237 | 0.05104 | ||
| 每公顷农业化肥使用量 | t | − | 反映区域农业生产污染程度 | 0.03134 | 0.04146 | 0.05076 | 0.04119 | ||
| 国土空间开发适宜程度 | 国土空间开发程度 | 人均建成区规模 | m2 | + | 反映区域人口分布疏密程度 | 0.04296 | 0.05250 | 0.04445 | 0.04664 |
| 人均道路面积 | m2 | + | 反映城市道路设施情况 | 0.06057 | 0.05671 | 0.07211 | 0.06313 | ||
| 城市建设用地占比 | % | − | 反映区域用地结构变化 | 0.01885 | 0.03002 | 0.05597 | 0.03495 | ||
| 每公顷城镇人口 | 人 | − | 反映城镇空间分布疏密程度 | 0.03177 | 0.04075 | 0.06939 | 0.04730 | ||
| 市政公用设施建设固定资产投资额 | 亿元 | + | 反映城市基础设施发展情况 | 0.16219 | 0.11904 | 0.04177 | 0.10767 | ||
| 土地利用集约程度 | 每万元GDP城市建设 用地面积 | m2 | − | 反映土地集约利用水平 | 0.02095 | 0.03099 | 0.04409 | 0.03201 | |
| 每公顷地均GDP | 元 | + | 反映土地开发利用效率 | 0.12192 | 0.09452 | 0.04899 | 0.08848 |
表1 江苏省国土空间绿色发展水平评价指标体系及其各指标权重
Table 1 Evaluation index system for the level of territorial space green development of Jiangsu Province and the weights of each index
| 准则层 | 一级指标 | 二级指标 | 单位 | 指标属性 | 表征内涵 | 熵权法 | 变异系数法 | CRITIC法 | 综合权重 |
|---|---|---|---|---|---|---|---|---|---|
| 资源环境承载能力 | 资源 承载力 | 每万元GDP供水量 | m3 | − 1) | 反映水资源利用水平 | 0.01532 | 0.02668 | 0.04199 | 0.02800 |
| 每万元GDP CO2排放量 | t | − | 衡量区域资源利用水平 | 0.01619 | 0.02913 | 0.03933 | 0.02822 | ||
| 工业用水重复利用率 | % | +2) | 反映资源利用集约节约水平 | 0.01279 | 0.02411 | 0.03994 | 0.02561 | ||
| 林木覆盖率 | % | + | 反映区域植被覆盖情况 | 0.03945 | 0.04591 | 0.05295 | 0.04610 | ||
| 人均农作物播种面积 | m2 | + | 反映区域农业基础种植规模 | 0.07807 | 0.06603 | 0.07311 | 0.07240 | ||
| 环境 承载力 | 空气质量优良天数比率 | % | + | 反映区域大气质量情况 | 0.05315 | 0.05566 | 0.08121 | 0.06334 | |
| 城市建成区绿化覆盖率 | % | + | 反映区域绿化程度 | 0.03046 | 0.04053 | 0.04277 | 0.03792 | ||
| 人均公园绿地面积 | m2 | + | 反映区域绿化程度 | 0.03800 | 0.04698 | 0.04442 | 0.04313 | ||
| 生活垃圾无害化处理量 | 104 t | + | 反映污染治理能力 | 0.14544 | 0.10873 | 0.04704 | 0.10040 | ||
| 一般工业固体废弃物 综合利用率 | % | + | 反映工业生产污染治理能力 | 0.02970 | 0.04036 | 0.05734 | 0.04247 | ||
| 城镇污水处理率 | % | + | 反映污染治理能力 | 0.05087 | 0.04988 | 0.05237 | 0.05104 | ||
| 每公顷农业化肥使用量 | t | − | 反映区域农业生产污染程度 | 0.03134 | 0.04146 | 0.05076 | 0.04119 | ||
| 国土空间开发适宜程度 | 国土空间开发程度 | 人均建成区规模 | m2 | + | 反映区域人口分布疏密程度 | 0.04296 | 0.05250 | 0.04445 | 0.04664 |
| 人均道路面积 | m2 | + | 反映城市道路设施情况 | 0.06057 | 0.05671 | 0.07211 | 0.06313 | ||
| 城市建设用地占比 | % | − | 反映区域用地结构变化 | 0.01885 | 0.03002 | 0.05597 | 0.03495 | ||
| 每公顷城镇人口 | 人 | − | 反映城镇空间分布疏密程度 | 0.03177 | 0.04075 | 0.06939 | 0.04730 | ||
| 市政公用设施建设固定资产投资额 | 亿元 | + | 反映城市基础设施发展情况 | 0.16219 | 0.11904 | 0.04177 | 0.10767 | ||
| 土地利用集约程度 | 每万元GDP城市建设 用地面积 | m2 | − | 反映土地集约利用水平 | 0.02095 | 0.03099 | 0.04409 | 0.03201 | |
| 每公顷地均GDP | 元 | + | 反映土地开发利用效率 | 0.12192 | 0.09452 | 0.04899 | 0.08848 |
| 生态系统分类 | 供给服务 | 调节服务 | 支持服务 | 文化服务 | ||||||||||
|---|---|---|---|---|---|---|---|---|---|---|---|---|---|---|
| 一级分类 | 食物供给 | 原材料供给 | 水资源供给 | 气体调节 | 气候调节 | 净化环境 | 水文调节 | 土壤保持 | 维持养分循环 | 生物多样性 | 美学景观 | |||
| 耕地 | 3139.53 | 713.53 | −3738.89 | 2540.16 | 1341.44 | 399.58 | 4281.18 | 1484.14 | 456.66 | 485.20 | 228.33 | |||
| 草地 | 656.45 | 970.40 | 542.28 | 3453.48 | 9104.64 | 2996.82 | 6678.64 | 4195.55 | 313.95 | 3824.52 | 1683.93 | |||
| 林地 | 713.53 | 1655.39 | 856.24 | 5451.37 | 16297.01 | 4766.38 | 10674.40 | 6621.55 | 513.74 | 6050.73 | 2654.33 | |||
| 水域 | 1883.72 | 1056.02 | 15526.4 | 3824.52 | 8419.65 | 13071.86 | 180494.41 | 4623.67 | 371.04 | 14869.95 | 9447.13 | |||
| 建设用地 | 0 | 0 | 0 | 0 | 0 | 0 | 0 | 0 | 0 | 0 | 0 | |||
| 未利用地 | 0 | 0 | 0 | 57.08 | 0 | 285.41 | 85.62 | 57.08 | 0 | 57.08 | 28.54 | |||
表2 江苏省单位面积生态系统服务价值当量表
Table 2 Equivalent value of ecosystem services per unit area in Jiangsu Province yuan?hm?2
| 生态系统分类 | 供给服务 | 调节服务 | 支持服务 | 文化服务 | ||||||||||
|---|---|---|---|---|---|---|---|---|---|---|---|---|---|---|
| 一级分类 | 食物供给 | 原材料供给 | 水资源供给 | 气体调节 | 气候调节 | 净化环境 | 水文调节 | 土壤保持 | 维持养分循环 | 生物多样性 | 美学景观 | |||
| 耕地 | 3139.53 | 713.53 | −3738.89 | 2540.16 | 1341.44 | 399.58 | 4281.18 | 1484.14 | 456.66 | 485.20 | 228.33 | |||
| 草地 | 656.45 | 970.40 | 542.28 | 3453.48 | 9104.64 | 2996.82 | 6678.64 | 4195.55 | 313.95 | 3824.52 | 1683.93 | |||
| 林地 | 713.53 | 1655.39 | 856.24 | 5451.37 | 16297.01 | 4766.38 | 10674.40 | 6621.55 | 513.74 | 6050.73 | 2654.33 | |||
| 水域 | 1883.72 | 1056.02 | 15526.4 | 3824.52 | 8419.65 | 13071.86 | 180494.41 | 4623.67 | 371.04 | 14869.95 | 9447.13 | |||
| 建设用地 | 0 | 0 | 0 | 0 | 0 | 0 | 0 | 0 | 0 | 0 | 0 | |||
| 未利用地 | 0 | 0 | 0 | 57.08 | 0 | 285.41 | 85.62 | 57.08 | 0 | 57.08 | 28.54 | |||
| 耦合协调阶段 | 耦合协调度 | 协调发展程度 | 编号 |
|---|---|---|---|
| 失调阶段 | [0.00, 0.10) | 极度失调 | Ⅰ |
| [0.10, 0.20) | 严重失调 | Ⅱ | |
| [0.20, 0.30) | 中度失调 | Ⅲ | |
| [0.30, 0.40) | 轻度失调 | Ⅳ | |
| 过渡阶段 | [0.40, 0.50) | 濒临失调 | Ⅴ |
| [0.50, 0.60) | 勉强协调 | Ⅵ | |
| 磨合阶段 | [0.60, 0.70) | 基本协调 | Ⅶ |
| [0.70, 0.80) | 中度协调 | Ⅷ | |
| 协调阶段 | [0.80, 0.90) | 高度协调 | Ⅸ |
| [0.90, 1.00] | 极度协调 | Ⅹ |
表3 国土空间绿色发展水平与生态系统服务耦合协调度等级划分
Table 3 Classification of coupling coordination degree between the level of territorial space green development and ecosystem services
| 耦合协调阶段 | 耦合协调度 | 协调发展程度 | 编号 |
|---|---|---|---|
| 失调阶段 | [0.00, 0.10) | 极度失调 | Ⅰ |
| [0.10, 0.20) | 严重失调 | Ⅱ | |
| [0.20, 0.30) | 中度失调 | Ⅲ | |
| [0.30, 0.40) | 轻度失调 | Ⅳ | |
| 过渡阶段 | [0.40, 0.50) | 濒临失调 | Ⅴ |
| [0.50, 0.60) | 勉强协调 | Ⅵ | |
| 磨合阶段 | [0.60, 0.70) | 基本协调 | Ⅶ |
| [0.70, 0.80) | 中度协调 | Ⅷ | |
| 协调阶段 | [0.80, 0.90) | 高度协调 | Ⅸ |
| [0.90, 1.00] | 极度协调 | Ⅹ |
| 年份 | 变化值 或幅度 | 资源承载力 | 环境承载力 | 国土空间开发程度 | 土地利用集约程度 | 总计 |
|---|---|---|---|---|---|---|
| 2020 | -1) | 1.65 | 2.91 | 1.46 | 0.839 | 6.86 |
| 2015 | - | 1.71 | 2.21 | 1.94 | 0.637 | 6.50 |
| 2010 | - | 1.33 | 2.17 | 1.74 | 0.428 | 5.67 |
| 2010‒2015 | 变化值 | 0.375 | 0.046 | 0.204 | 0.210 | 0.834 |
| 变化幅度 | 28.1% | 2.10% | 11.7% | 49.0% | 14.7% | |
| 2015‒2020 | 变化值 | −0.062 | 0.701 | −0.478 | 0.201 | 0.362 |
| 变化幅度 | −3.61% | 31.7% | −24.7% | 31.6% | 5.56% | |
| 2010‒2020 | 变化值 | 0.313 | 0.747 | −0.275 | 0.411 | 1.20 |
| 变化幅度 | 23.5% | 34.5% | −15.8% | 96.1% | 21.1% |
表4 2010-2020年江苏省国土空间绿色发展指标情况
Table 4 Indicators of territorial space green development of Jiangsu Province from 2010 to 2020
| 年份 | 变化值 或幅度 | 资源承载力 | 环境承载力 | 国土空间开发程度 | 土地利用集约程度 | 总计 |
|---|---|---|---|---|---|---|
| 2020 | -1) | 1.65 | 2.91 | 1.46 | 0.839 | 6.86 |
| 2015 | - | 1.71 | 2.21 | 1.94 | 0.637 | 6.50 |
| 2010 | - | 1.33 | 2.17 | 1.74 | 0.428 | 5.67 |
| 2010‒2015 | 变化值 | 0.375 | 0.046 | 0.204 | 0.210 | 0.834 |
| 变化幅度 | 28.1% | 2.10% | 11.7% | 49.0% | 14.7% | |
| 2015‒2020 | 变化值 | −0.062 | 0.701 | −0.478 | 0.201 | 0.362 |
| 变化幅度 | −3.61% | 31.7% | −24.7% | 31.6% | 5.56% | |
| 2010‒2020 | 变化值 | 0.313 | 0.747 | −0.275 | 0.411 | 1.20 |
| 变化幅度 | 23.5% | 34.5% | −15.8% | 96.1% | 21.1% |
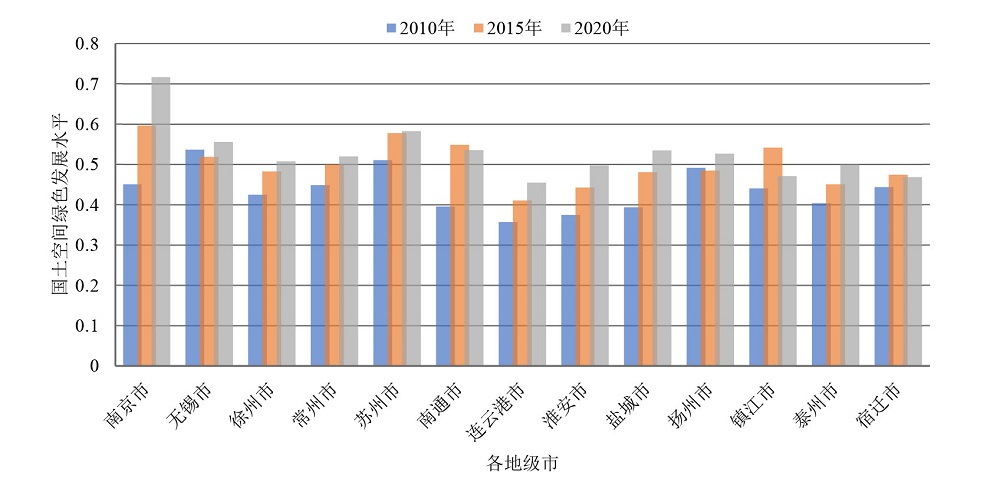
图2 2010-2020年江苏省各地级市国土空间绿色发展水平情况
Figure 2 The level of territorial space green development in various cities of Jiangsu Province from 2010 to 2020
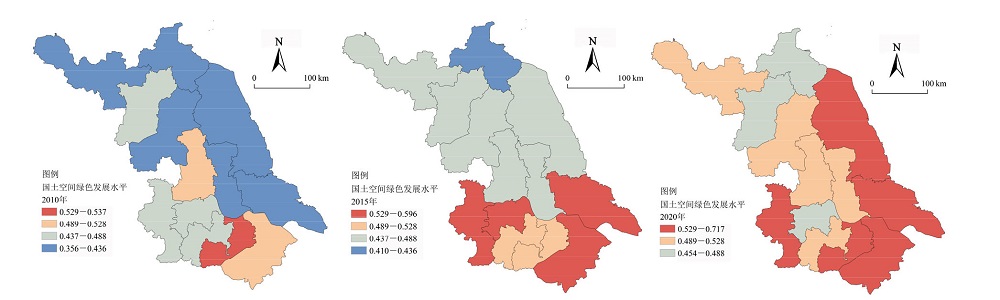
图3 2010-2020年江苏省各地级市国土空间绿色发展水平分级情况
Figure 3 Classification of the level of territorial space green development in various cities of Jiangsu Province from 2010 to 2020
| 生态系统 | 服务价值/亿元 | 平均贡献率 | 2010‒2020年变化值/亿元 | 2010‒2020年增减率/% | ||
|---|---|---|---|---|---|---|
| 2010年 | 2015年 | 2020年 | ||||
| 耕地 | 871.6 | 842.7 | 812.9 | 19.6% | −58.6 | −6.73 |
| 草地 | 31.2 | 33.2 | 36.9 | 0.787% | 5.74 | 18.4 |
| 林地 | 77.5 | 75.3 | 72.0 | 1.75% | −5.47 | −7.06 |
| 水域 | 3287.2 | 3319.6 | 3402.5 | 77.8% | 115.4 | 3.51 |
| 建设用地 | 0 | 0 | 0 | 0.00% | ‒ | ‒ |
| 未利用地 | 9.17×10⁻³ | 4.20×10⁻³ | 4.85×10⁻³ | 0.001‰ | −4.32×10⁻³ | −47.1 |
| 总计 | 4267.4 | 4270.8 | 4324.4 | 100% | 57.0 | 1.34 |
表5 2010-2020年江苏省各生态系统类型的服务价值情况
Table 5 Service value of various ecosystem types in Jiangsu Province from 2010 to 2020
| 生态系统 | 服务价值/亿元 | 平均贡献率 | 2010‒2020年变化值/亿元 | 2010‒2020年增减率/% | ||
|---|---|---|---|---|---|---|
| 2010年 | 2015年 | 2020年 | ||||
| 耕地 | 871.6 | 842.7 | 812.9 | 19.6% | −58.6 | −6.73 |
| 草地 | 31.2 | 33.2 | 36.9 | 0.787% | 5.74 | 18.4 |
| 林地 | 77.5 | 75.3 | 72.0 | 1.75% | −5.47 | −7.06 |
| 水域 | 3287.2 | 3319.6 | 3402.5 | 77.8% | 115.4 | 3.51 |
| 建设用地 | 0 | 0 | 0 | 0.00% | ‒ | ‒ |
| 未利用地 | 9.17×10⁻³ | 4.20×10⁻³ | 4.85×10⁻³ | 0.001‰ | −4.32×10⁻³ | −47.1 |
| 总计 | 4267.4 | 4270.8 | 4324.4 | 100% | 57.0 | 1.34 |
| 城市 | 服务价值/亿元 | 变化值/亿元 | 变化率/% | 平均贡献率/% | ||||||||
|---|---|---|---|---|---|---|---|---|---|---|---|---|
| 2020年 | 2015年 | 2010年 | 2010-2015年 | 2015-2020年 | 2010-2020年 | 2010-2015年 | 2015-2020年 | 2010-2020年 | ||||
| 常州 | 163.7 | 160.5 | 160.5 | −0.017 | 3.35 | 3.34 | −0.011 | 2.09 | 2.08 | 3.77 | ||
| 淮安 | 478.2 | 466.9 | 465.7 | 1.25 | 11.2 | 12.5 | 0.268 | 2.41 | 2.68 | 11.0 | ||
| 连云港 | 242.1 | 242.7 | 248.1 | −5.42 | −0.666 | −6.08 | −2.18 | −0.274 | −2.45 | 5.70 | ||
| 南京 | 254.1 | 251.7 | 250.0 | 1.61 | 2.47 | 4.08 | 0.643 | 0.981 | 1.63 | 5.88 | ||
| 南通 | 360.3 | 366.6 | 374.1 | −7.5 | −6.32 | −13.8 | −2.00 | −1.72 | −3.69 | 8.56 | ||
| 苏州 | 780.6 | 782.8 | 787.5 | −4.66 | −2.24 | −6.9 | −0.592 | −0.286 | −0.877 | 18.3 | ||
| 宿迁 | 362.7 | 357.8 | 358.7 | −0.836 | 4.86 | 4.02 | −0.233 | 1.36 | 1.12 | 8.39 | ||
| 泰州 | 222.4 | 199.6 | 186.2 | 13.4 | 22.9 | 36.3 | 7.20 | 11.5 | 19.5 | 4.73 | ||
| 无锡 | 281.8 | 281.1 | 282.2 | −1.15 | 0.687 | −0.463 | −0.408 | 0.245 | −0.164 | 6.57 | ||
| 徐州 | 175.2 | 174.3 | 173.4 | 0.897 | 0.826 | 1.72 | 0.517 | 0.474 | 0.993 | 4.07 | ||
| 盐城 | 609.8 | 600.5 | 597.2 | 3.279 | 9.33 | 12.6 | 0.549 | 1.55 | 2.11 | 14.1 | ||
| 扬州 | 283.4 | 276.1 | 272.8 | 3.353 | 7.33 | 10.7 | 1.23 | 2.65 | 3.92 | 6.47 | ||
| 镇江 | 110.0 | 110.1 | 111.0 | −0.833 | −0.124 | −0.957 | −0.751 | −0.112 | −0.862 | 2.57 | ||
表6 2010-2020年江苏省各地级市生态系统服务价值情况
Table 6 Value of ecosystem services of various cities in Jiangsu Province from 2010 to 2020
| 城市 | 服务价值/亿元 | 变化值/亿元 | 变化率/% | 平均贡献率/% | ||||||||
|---|---|---|---|---|---|---|---|---|---|---|---|---|
| 2020年 | 2015年 | 2010年 | 2010-2015年 | 2015-2020年 | 2010-2020年 | 2010-2015年 | 2015-2020年 | 2010-2020年 | ||||
| 常州 | 163.7 | 160.5 | 160.5 | −0.017 | 3.35 | 3.34 | −0.011 | 2.09 | 2.08 | 3.77 | ||
| 淮安 | 478.2 | 466.9 | 465.7 | 1.25 | 11.2 | 12.5 | 0.268 | 2.41 | 2.68 | 11.0 | ||
| 连云港 | 242.1 | 242.7 | 248.1 | −5.42 | −0.666 | −6.08 | −2.18 | −0.274 | −2.45 | 5.70 | ||
| 南京 | 254.1 | 251.7 | 250.0 | 1.61 | 2.47 | 4.08 | 0.643 | 0.981 | 1.63 | 5.88 | ||
| 南通 | 360.3 | 366.6 | 374.1 | −7.5 | −6.32 | −13.8 | −2.00 | −1.72 | −3.69 | 8.56 | ||
| 苏州 | 780.6 | 782.8 | 787.5 | −4.66 | −2.24 | −6.9 | −0.592 | −0.286 | −0.877 | 18.3 | ||
| 宿迁 | 362.7 | 357.8 | 358.7 | −0.836 | 4.86 | 4.02 | −0.233 | 1.36 | 1.12 | 8.39 | ||
| 泰州 | 222.4 | 199.6 | 186.2 | 13.4 | 22.9 | 36.3 | 7.20 | 11.5 | 19.5 | 4.73 | ||
| 无锡 | 281.8 | 281.1 | 282.2 | −1.15 | 0.687 | −0.463 | −0.408 | 0.245 | −0.164 | 6.57 | ||
| 徐州 | 175.2 | 174.3 | 173.4 | 0.897 | 0.826 | 1.72 | 0.517 | 0.474 | 0.993 | 4.07 | ||
| 盐城 | 609.8 | 600.5 | 597.2 | 3.279 | 9.33 | 12.6 | 0.549 | 1.55 | 2.11 | 14.1 | ||
| 扬州 | 283.4 | 276.1 | 272.8 | 3.353 | 7.33 | 10.7 | 1.23 | 2.65 | 3.92 | 6.47 | ||
| 镇江 | 110.0 | 110.1 | 111.0 | −0.833 | −0.124 | −0.957 | −0.751 | −0.112 | −0.862 | 2.57 | ||
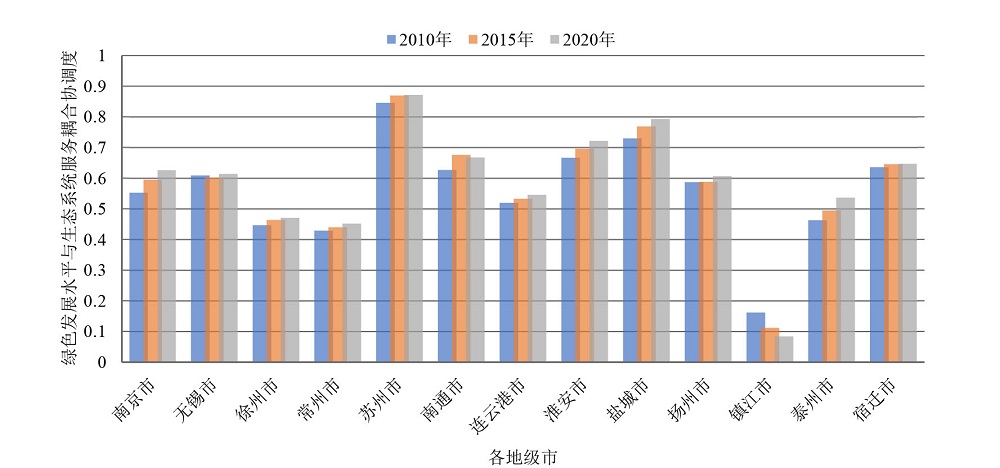
图4 2010-2020年江苏省绿色发展水平与生态系统服务耦合协调度情况
Figure 4 Coupling and coordination degree of green development level and ecosystem services in Jiangsu Province from 2010 to 2020
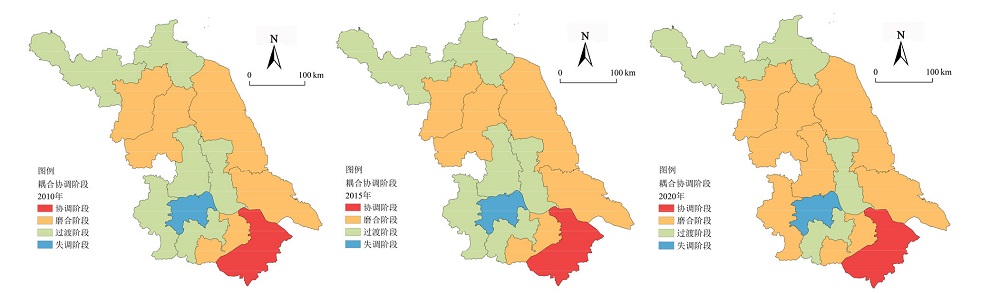
图5 2010-2020年江苏省国土空间绿色发展水平与生态系统服务耦合协调阶段
Figure 5 The stage of coupling and coordination between the level of territorial space green development and ecosystem services in Jiangsu Province from 2010 to 2020
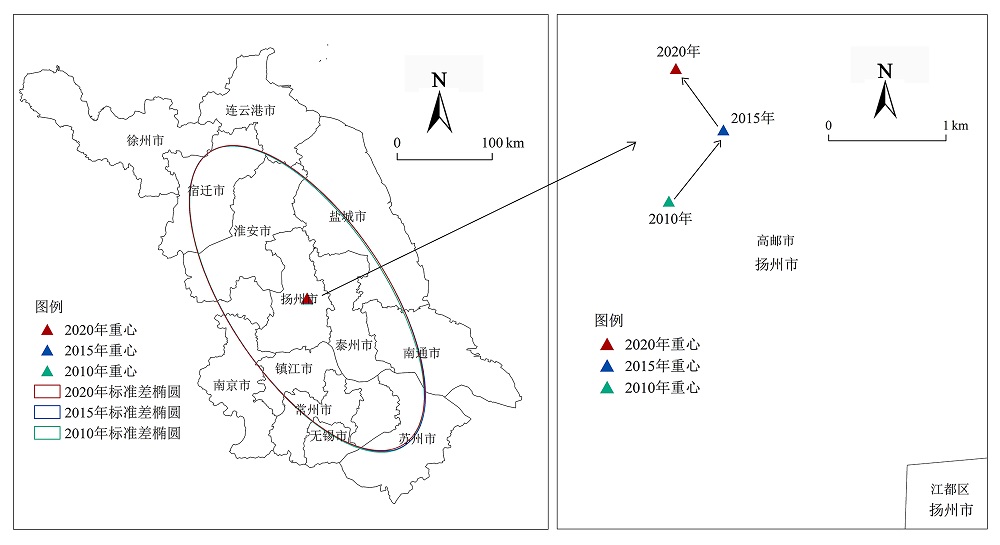
图6 江苏省国土空间绿色发展水平与生态系统服务耦合协调度标准差椭圆与重心迁移
Figure 6 Standard deviation ellipse and center of gravity shift of the coupling coordination degree between the level of territorial space green development and ecosystem services in Jiangsu Province
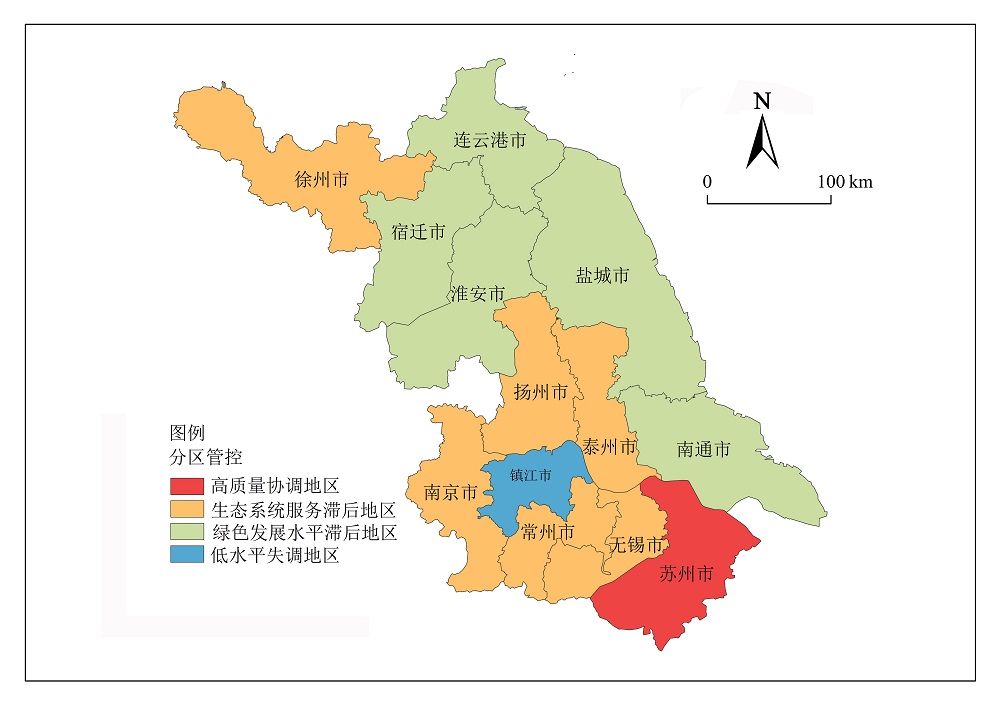
图7 江苏省国土空间绿色发展与生态系统服务协调管制分区
Figure 7 Control zones for the coordination of territorial space green development and ecosystem services in Jiangsu Province
| [1] | CHEN W, CHI G, 2023. Ecosystem services trade-offs and synergies in China, 2000-2015 [J]. International Journal of Environmental Science and Technology, 20(3): 3221-3236. |
| [2] | GUO R, SONG X Y, LI P R, et al., 2020. Large-scale and refined green space identification-based sustainable urban renewal mode assessment[J]. Mathematical Problems in Engineering, 2020(1): 2043019. |
| [3] | HUANG J X, YANG S Q, ZHU W H, et al., 2024. Spatial and temporal characterization of critical ecosystem services in China's terrestrial area, 2000-2020: Trade-off synergies, driving mechanisms and functional zoning[J]. Frontiers in Ecology and Evolution, 12: 1443683. |
| [4] | LI Z R, ZHENG K H, ZHONG Q K, 2022. Comprehensive evaluation and spatial-temporal pattern of green development in Hunan Province, China[J]. Sustainability, 14(11): 6819. |
| [5] | POMARA L Y, LEE D C, 2021. The role of regional ecological assessment in quantifying ecosystem services for forest management[J]. Land, 10(7): 725. |
| [6] | SHEN J S, LI S C, WANG H, et al., 2023. Understanding the spatial relationships and drivers of ecosystem service supply-demand mismatches towards spatially-targeted management of social-ecological system[J]. Journal of Cleaner Production, 406: 136882. |
| [7] | XU J, XU D W, QU C, 2022. Construction of ecological security pattern and identification of ecological restoration zones in the city of Changchun, China[J]. International Journal of Environmental Research and Public Health, 20(1): 289. |
| [8] | XUE H L, LAN X, ZHANG Q, et al., 2021. Assessment of the green development level for participating countries in the Belt and Road initiative[J]. Annals of Operations Research, 326: 125. |
| [9] | YANG D, LIU W, TANG L Y, et al., 2019. Estimation of water provision service for monsoon catchments of South China: Applicability of the InVEST model[J]. Landscape and Urban Planning, 182: 133-143. |
| [10] | YANG J X, MA X, ZHAO X Y, et al., 2022. Spatiotemporal of the coupling relationship between ecosystem services and human well-being in Guanzhong plain urban agglomeration[J]. International Journal of Environmental Research and Public Health, 19(19): 12535. |
| [11] | YANG Q, WAN X Z, MA H M, 2015. Assessing green development efficiency of municipalities and provinces in China integrating models of super-efficiency DEA and Malmquist Index[J]. Sustainability, 7(4): 4492-4510. |
| [12] | YUAN Q Q, YANG D W, YANG F, et al., 2020. Green industry development in China: An index based assessment from perspectives of both current performance and historical effort[J]. Journal of Cleaner Production, 250: 119457. |
| [13] | ZHAO H, LI C, GAO M H, 2023. Investigation of the relationship between supply and demand of ecosystem services and the influencing factors in resource-based cities in China[J]. Sustainability, 15(9): 7397. |
| [14] | 陈佳琦, 姜海宁, 金星星, 2024. 长三角地区科技创新与绿色发展耦合协调格局及驱动机制[J]. 长江流域资源与环境, 33(5): 924-936. |
| CHEN J Q, JIANG H N, JIN X X, 2024. Coupling and coordination pattern and driving mechanism of scientific-technological innovation and green development in Yangtze River Delta region[J]. Resources and Environment in the Yangtze Basin, 33(5): 924-936. | |
| [15] | 陈睿, 杨灿, 童晶, 等, 2023. 长株潭城市群新型城镇化对生态系统服务价值空间分异的影响[J]. 中南林业科技大学学报, 43(6): 158-167. |
| CHEN R, YANG C, TONG J, et al., 2023. The impact of new urbanization of Changsha-Zhuzhou-Xiangtan urban agglomeration on the spatial differentiation of ecosystem service values[J]. Journal of Central South University of Forestry & Technology, 43(6): 158-167. | |
| [16] | 方应波, 2022. 我国绿色发展水平评价及时空演变特征分析[J]. 统计与决策, 38(20): 54-58. |
| FANG Y B, 2022. Evaluation of Chinese green development level and analysis of its spatiotemporal evolution characteristics[J]. Statistics & Decision, 38(20): 54-58. | |
| [17] | 冯兆华, 吴钊骏, 吴大放, 等, 2021. 珠海市多功能视角下资源环境承载能力评价[J]. 中国资源综合利用, 40(9): 80-86. |
| FENG Z H, WU Z J, WU D F, et al., 2021. Evaluation of resource and environment carrying capacity of Zhuhai City from multi-functional perspective[J]. China Resources Comprehensive Utilization, 40(9): 80-86. | |
| [18] | 郭朝琼, 徐昔保, 舒强, 2020. 生态系统服务供需评估方法研究进展[J]. 生态学杂志, 39(6): 2086-2096. |
| GUO C Q, XU X B, SHU Q, 2020. A review on the assessment methods of supply and demand of ecosystem services[J]. Chinese Journal of Ecology, 39(6): 2086-2096. | |
| [19] | 国家发展和改革委员会价格司, 2021. 全国农产品成本收益资料汇编[M]. 北京: 中国统计出版社: 101-142. |
| Price Department of National Development and Reform Commission, 2021. National agricultural product cost and benefit data compilation[M]. Beijing: China Statistics Press: 101-142. | |
| [20] | 黄志斌, 姚灿, 王新, 2015. 绿色发展理论基本概念及其相互关系辨析[J]. 自然辩证法研究, 31(8): 108-113. |
| HUANG Z B, YAO C, WANG X, 2015. Discrimination on some fundamental concepts of green development theory and their relationships[J]. Studies in Dialectics of Nature, 31(8): 108-113. | |
| [21] | 蒋乾, 2021. 长江上游城镇空间开发适宜性评价[J]. 城市问题 (12): 69-76. |
| JIANG Q, 2021. Suitability evaluation of urban spatial development in the upper reaches of the Yangtze River[J]. Urban Problems (12): 69-76. | |
| [22] | 江苏省人民政府, 2024. 关于全面推进美丽江苏建设的实施意见[EB/OL]. [2024-11-20]. https://www.jiangsu.gov.cn/art/2024/7/3/art_84322_11287064.html. |
| Jiangsu Provincial People’s Government, 2024. Implementation opinions on comprehensively promoting the construction of beautiful Jiangsu[EB/OL]. [2024-11-20]. https://www.jiangsu.gov.cn/art/2024/7/3/art_84322_11287064.html. | |
| [23] |
金淑婷, 李博, 杨永春, 等, 2015. 中国城市分布特征及其影响因素[J]. 地理研究, 34(7): 1352-1366.
DOI |
| JIN S T, LI B, YANG Y C, et al., 2015. The distribution of cities in China and its influencing factors[J]. Geographical Research, 34(7): 1352-1366. | |
| [24] | 林瑒焱, 徐昔保, 王维, 2023. 长江经济带绿色发展水平时空分异特征与影响因素[J]. 长江流域资源与环境, 32(9): 1822-1833. |
| LIN C Y, XU X B, WANG W, 2023. Spatial-temporal variation characteristics and influencing factors of green development level in Yangtze River Economic Belt[J]. Resources and Environment in the Yangtze Basin, 32(9): 1822-1833. | |
| [25] | 刘良云, 张肖, 2021. 2020年全球30米地表覆盖精细分类产品V1.0[DB/OL]. 北京: 中国科学院空天信息创新研究院, [2024-11-20]. DOI:10.12237/casearth.6123651428a58f70c2a51e49. |
| LIU L Y, ZHANG X, 2021. Global 30 meter ground cover fine classification product V1.0 in 2020[DB/OL]. Beijing: Aerospace Information Innovation Institute of the Chinese Academy of Sciences, [2024-11-20]. DOI:10.12237/casearth.6123651428a58f70c2a51e49. | |
| [26] | 刘儒, 何莉, 2024. 以绿色发展促进乡村全面振兴: 目标任务、基本依循与路径优化[J]. 西北农林科技大学学报(社会科学版), 24(3): 1-10. |
| LIU R, HE L, 2024. Promoting rural revitalization through green development: Objectives, tasks, basic guidelines and path optimization[J]. Journal of Northwest A&F University (Social Science Edition), 24(3): 1-10. | |
| [27] | 刘珊珊, 吴文婕, 王志强, 2023. 基于DPSIR-TOPSIS模型的乌鲁木齐市绿色发展水平测度及其影响因素[J]. 地球科学与环境学报, 45(4): 857-868. |
| LIU S S, WU W J, WANG Z Q, 2023. Calculation on green development level of Urumqi in Xinjiang, China based on DPSIR-TOPSIS model and its influencing factors[J]. Journal of Earth Sciences and Environment, 45(4): 857-868. | |
| [28] | 路昌, 王雨晴, 刘晓丽, 等, 2023. 黄河下游地区新型城镇化与生态系统服务耦合分析[J]. 生态经济, 39(9): 85-92. |
| LU C, WANG Y Q, LIU X L, et al., 2023. Coupling relationship between new urbanization and ecosystem services: A case of lower Yellow River[J]. Ecological Economy, 39(9): 85-92. | |
| [29] | 罗佳, 黎蕾, 姜芸, 等, 2022. 湖南省森林生态系统服务功能价值评估[J]. 生态科学, 41(4): 70-77. |
| LUO J, LI L, JIANG Y, et al., 2022. Evaluation of service function of forest ecosystem in Hunan province[J]. Ecological Science, 41(4): 70-77. | |
| [30] | 孟凡迪, 周智, 张贵军, 等, 2023. 基于生态系统服务供需与生态恢复力的国土空间生态修复分区——以京津冀为例[J]. 中国生态农业学报(中英文), 31(9): 1496-1510. |
| MENG F D, ZHOU Z, ZHANG G J, et al., 2023. Land space ecological restoration zoning based on ecosystem service supply and demand and ecological resilience: A case study in the Beijing-Tianjin-Hebei region[J]. Chinese Journal of Eco-Agriculture, 31(9): 1496-1510. | |
| [31] |
彭建, 胡晓旭, 赵明月, 等, 2017. 生态系统服务权衡研究进展: 从认知到决策[J]. 地理学报, 72(6): 960-973.
DOI |
|
PENG J, HU X X, ZHAO M Y, et al., 2017. Research progress on ecosystem service trade-offs: From cognition to decision-making[J]. Acta Geographica Sinica, 72(6): 960-973.
DOI |
|
| [32] | 戚丽萍, 栾兆擎, 魏勉, 等, 2023. 基于土地利用的江苏省各市生态系统服务价值时空变化研究[J]. 南京林业大学学报 (自然科学版), 47(4): 200-208. |
| QI L P, LUAN Z Q, WEI M, et al., 2023. Spatial and temporal variations of ecosystem service values in Jiangsu Province based on land-use change[J]. Journal of Nanjing Forestry University (Natural Sciences Edition), 47(4): 200-208. | |
| [33] | 秦晓川, 付碧宏, 2020. 青岛都市圈生态系统服务-经济发展时空协调性分析及优化利用[J]. 生态学报, 40(22): 8251-8264. |
| QIN X C, FU B H, 2020. Spatio-temporal coordination between ecosystem services and economic development and its optimal utilization in Qingdao Metropolitan Region, China[J]. Acta Ecologica Sinica, 40(22): 8251-8264. | |
| [34] | 王成新, 刘洪颜, 史佳璐, 等, 2014. 山东省省级以上开发区土地集约利用评价研究[J]. 中国人口·资源与环境, 24(6): 128-133. |
| WANG C X, LIU H Y, SHI J L, et al., 2014. Evaluation on intensive land use in development zones of Shandong Province[J]. China Population, Resources and Environment, 24(6): 128-133. | |
| [35] |
王琳, 卫伟, 2023. 黄土高原典型县域生态系统服务变化特征及驱动因素[J]. 生态环境学报, 32(6): 1140-1148.
DOI |
| WANG L, WEI W, 2023. Characteristics and driving factors of ecosystem services changes in a typical county of the Loess Plateau[J]. Ecology and Environmental Sciences, 32(6): 1140-1148. | |
| [36] | 王楠, 姚国慧, 马伟波, 等, 2023. 喜马拉雅东南部生物多样性保护优先区县域乡村振兴与生态系统服务耦合协调度研究: 以定结县为例[J]. 生态与农村环境学报, 39(12): 1515-1524. |
| WANG N, YAO G H, MA W B, et al., 2023. Analysis on the degree of coupling coordination between county ecosystem services and rural revitalization in the priority areas for biodiversity conservation in southeastern Himalayas: A case study of Dingjie County[J]. Journal of Ecology and Rural Environment, 39(12): 1515-1524. | |
| [37] | 王韶华, 徐静蕾, 张伟, 等, 2023. 京津冀工业绿色发展的时空分异及影响因素研究[J]. 地理与地理信息科学, 39(5): 107-113, 144. |
| WANG S H, XU J L, ZHANG W, et al., 2023. Spatio-temporal difference and influencing factors of industrial green development in the Beijing-Tianjin-Hebei region[J]. Geography and Geo-Information Science, 39(5): 107-113, 144. | |
| [38] | 王思博, 焦翔, 李冬冬, 等, 2021. 生态系统服务研究评述与展望: 由功能认知、价值核算向消费价值实现的演变[J]. 林业经济, 43(6): 49-67. |
| WANG S B, JIAO X, LI D D, et al., 2021. Review and prospect of research on ecosystem services: The evolution from functional cognition and value accounting to consumption value realization[J]. Forestry Economics, 43(6): 49-67. | |
| [39] | 王小莉, 高振斌, 苏婧, 等, 2018. 区域生态系统服务价值评估方法比较与案例分析[J]. 环境工程技术学报, 8(2): 212-220. |
| WANG X L, GAO Z B, SU J, et al., 2018. Assessment methods of regional ecosystem service value and a case study of Dongjiang River basin[J]. Journal of Environmental Engineering Technology, 8(2): 212-220. | |
| [40] | 王曰芬, 徐天傲, 岑咏华, 2023. 绿色发展理念支撑的生态文明建设综合评价指标体系构建及应用[J]. 智库理论与实践, 8(4): 52-63. |
| WANG Y F, XU T A, CEN Y H, 2023. Comprehensive evaluation of eco-civilization construction supported by green development[J]. Think Tank: Theory & Practice, 8(4): 52-63. | |
| [41] | 谢高地, 张彩霞, 张雷明, 等, 2015. 基于单位面积价值当量因子的生态系统服务价值化方法改进[J]. 自然资源学报, 30(8): 1243-1254. |
|
XIE G D, ZHANG C X, ZHANG L M, et al., 2015. Improvement of the evaluation method for ecosystem service value based on per unit area[J]. Journal of Natural Resources, 30(8): 1243-1254.
DOI |
|
| [42] | 谢高地, 甄霖, 鲁春霞, 等, 2008. 一个基于专家知识的生态系统服务价值化方法[J]. 自然资源学报, 23(5): 911-919. |
| XIE G D, ZHEN L, LU C X, et al., 2008. Expert know ledge based valuation method of ecosystem services in China[J]. Journal of Natural Resources, 23(5): 911-919. | |
| [43] |
于琛, 胡德勇, 曹诗颂, 等, 2019. 近30年北京市ISP-LST空间特征及其变化[J]. 地理研究, 38(9): 2346-2356.
DOI |
| YU C, HU D Y, CAO S S, et al., 2019. The spatial characteristics and changes of ISP-LST of Beijing in recent 30 years[J]. Geographical Research, 38(9): 2346-2356. | |
| [44] |
岳文泽, 吴桐, 王田雨, 等, 2020. 面向国土空间规划的“双评价”: 挑战与应对[J]. 自然资源学报, 35(10): 2299-2310.
DOI |
| YUE W Z, WU T, WANG T Y, et al., 2020. “Double evaluations” for territorial spatial planning: Challenges and responses[J]. Journal of Natural Resources, 35(10): 2299-2310. | |
| [45] | 张友国, 2023. 人与自然和谐共生绿色发展的路径选择[J]. 社会科学辑刊 (5): 181-189. |
| ZHANG Y G, 2023. The path selection of harmonious coexistence between humans and nature and green development[J]. Social Science Journal (5): 181-189. | |
| [46] | 张臻, 曹春霞, 何波, 2020. 国土空间规划体系重构语境下“双评价”研究进展与趋势[J]. 规划师, 36(5): 5-9. |
| ZHANG Z, CAO C X, HE B, 2020. Research progress of “Dual Evaluations” in the restructuring of national land use and spatial plan[J]. Planners, 36(5): 5-9. | |
| [47] | 赵海溶, 莫宏伟, 2022. 长株潭城市群生态系统服务价值时空变化分析[J]. 测绘科学, 47(12): 206-215. |
| ZHAO H R, MO H W, 2022. Spatial-temporal change of ecosystem service value in Changsha-Zhuzhou-Xiangtan urban agglomeration[J]. Science of Surveying and Mapping, 47(12): 206-215. | |
| [48] | 朱相君, 薛亮, 2022. 关中地区生态系统服务价值变化及其与经济发展耦合关系[J]. 生态学杂志, 41(4): 769-776. |
|
ZHU X J, XUE L, 2022. Changes of ecological service value and its coupling with economic development in Guanzhong region[J]. Chinese Journal of Ecology, 41(4): 769-776.
DOI |
|
| [49] | 自然资源部, 2020. 资源环境承载能力和国土空间开发适宜性评价指南(试行)[EB/OL]. [2024-11-20]. https://www.gov.cn/zhengce/zhengceku/2020-01/22/content_5471523.htm. |
| Ministry of Natural Resources of the People’s Republic of China, 2020. Guidelines for evaluating resources and environment carrying capacity and territorial space development suitability (Trial)[EB/OL]. [2024-11-20]. https://www.gov.cn/zhengce/zhengceku/2020-01/22/content_5471523.htm. |
| [1] | 马月伟, 陈玉美, 张盛蓝, 桂雅丽, 陈艳梅. 夹金山脉大熊猫栖息地生境质量与人类活动强度耦合协调研究[J]. 生态环境学报, 2025, 34(2): 197-208. |
| [2] | 叶俊宏, 刘珍环, 刘子瑜. 珠江三角洲城市群国土空间生态修复分区情景模拟[J]. 生态环境学报, 2025, 34(1): 4-12. |
| [3] | 高文明, 宋芊, 张皓翔, 王士如. 基于生态系统服务功能和保护动物栖息地适宜性评价的优先保护区选取——以三江源地区为例[J]. 生态环境学报, 2024, 33(8): 1318-1328. |
| [4] | 王雯, 侯青青, 裴婷婷. 甘肃河东地区坡度对生态系统服务的影响及其阈值效应[J]. 生态环境学报, 2024, 33(7): 1117-1129. |
| [5] | 张维琛, 王惺琪, 王博杰. 塔布河流域生态系统服务时空格局及影响因素分析[J]. 生态环境学报, 2024, 33(7): 1142-1152. |
| [6] | 向男, 王明旭, 张宏锋, 廖宝淦. 生态保护重要性分区及其长时间序列生境状况时空分异研究——以广东省为例[J]. 生态环境学报, 2024, 33(6): 958-968. |
| [7] | 王鹭莹, 李小马, 甘德欣, 刘鹏翱, 郭胜, 李毅. 长株潭城市群生态系统服务权衡与协同关系的空间异质性及其驱动因素[J]. 生态环境学报, 2024, 33(6): 969-979. |
| [8] | 杨非凡, 何浩. 基于“EVI-ESV”伊犁河谷生态环境评估及生态分区构建[J]. 生态环境学报, 2024, 33(4): 655-664. |
| [9] | 李荣杰, 李惠梅, 武非非, 赵明德, 王诗涵, 孙雪颖. 青海湖流域生态系统服务空间分异规律及驱动力研究[J]. 生态环境学报, 2024, 33(2): 301-309. |
| [10] | 林馨, 徐伟铭, 廖云婷, 邵尔辉. 福建省耕地占补时空分异及其对生态系统服务价值的影响研究[J]. 生态环境学报, 2024, 33(12): 1837-1848. |
| [11] | 田嘉莉, 毛靖宇, 彭甲超, 姚婷婷, 付书科. 重污染企业减污降碳协同效应时空分异特征及其驱动因素分析——来自A股100家企业的证据[J]. 生态环境学报, 2024, 33(11): 1661-1671. |
| [12] | 李辉蔷, 梁小英, 魏峥, 朱泳霏, 石金鑫. 基于logistic回归模型的生态系统服务簇变化驱动力分析——以关天经济区为例[J]. 生态环境学报, 2024, 33(11): 1803-1815. |
| [13] | 许静, 王德仁. 基于VORS模型的黄河流域生态系统健康评估与预测[J]. 生态环境学报, 2024, 33(10): 1612-1623. |
| [14] | 李惠梅, 李荣杰, 晏旭昇, 武非非, 高泽兵, 谭永忠. 青海湖流域生态风险评价及生态功能分区研究[J]. 生态环境学报, 2023, 32(7): 1185-1195. |
| [15] | 徐梓津, 张雪松, 陈明曼. 山地岩溶区生态系统服务时空演变特征分析——以贵州省为例[J]. 生态环境学报, 2023, 32(7): 1196-1206. |
| 阅读次数 | ||||||
|
全文 |
|
|||||
|
摘要 |
|
|||||