生态环境学报 ›› 2024, Vol. 33 ›› Issue (11): 1803-1815.DOI: 10.16258/j.cnki.1674-5906.2024.11.014
李辉蔷1( ), 梁小英1,2,*(), 魏峥1, 朱泳霏1, 石金鑫1
收稿日期:2024-07-01
出版日期:2024-11-18
发布日期:2024-12-06
通讯作者:
*梁小英。E-mail: liangxy@nwu.edu.cn作者简介:李辉蔷(1999年生),男,硕士研究生,研究方向为生态系统服务簇与驱动因素。E-mail: hq_lea@163.com
基金资助:
LI Huiqiang1(), LIANG Xiaoying1,2,*(), WEI Zheng1, ZHU Yongfei1, SHI Jinxin1
Received:2024-07-01
Online:2024-11-18
Published:2024-12-06
摘要:
生态系统服务簇(ESB)是多种生态系统服务在特定空间上形成的不同组合,探索影响其变化的驱动因素有助于理解ESB的功能变化特征,为国土空间优化提供理论支撑。以2000-2020年关中-天水经济区为例,在量化土壤保持、NPP、游憩服务、生境质量和粮食生产5种生态系统服务的基础上,利用自组织映射网络识别ESB,并探讨了影响不同ESB变化的驱动因素。结果表明,1)土壤保持、NPP、生境质量和游憩服务4种生态系统服务呈现出中西部低、南北山系高的空间分布格局,而粮食生产则恰好相反。2)研究区被划分为4种ESB,其中ESB1和ESB2主要分布在秦岭地区,ESB1的土壤保持服务显著高于ESB2;ESB3主要位于关中平原城市建成区和天水市,簇中5种生态系统服务水平均较低;ESB4则集中分布在关中平原地区,以粮食生产服务为主。3)ESB间的转换主要表现为6种类型,且其主要驱动因素存在一定差异。即:土地利用对4种ESB的转换均有重要驱动作用,其中以耕地和建筑用地的影响最显著;同时,ESB1、ESB4还受到降水等自然因素的影响,ESB2、ESB3、ESB4则多受GDP等社会经济因素的影响。该研究为关中-天水经济区的生态保护和可持续发展提供了新视角和科学依据。
中图分类号:
李辉蔷, 梁小英, 魏峥, 朱泳霏, 石金鑫. 基于logistic回归模型的生态系统服务簇变化驱动力分析——以关天经济区为例[J]. 生态环境学报, 2024, 33(11): 1803-1815.
LI Huiqiang, LIANG Xiaoying, WEI Zheng, ZHU Yongfei, SHI Jinxin. Driving Force Analysis of Ecosystem Service Bundle Change Based on Logistic Regression Model: A Case Study of Guantian Economic Zone[J]. Ecology and Environment, 2024, 33(11): 1803-1815.

图1 研究区地形示意图
Figure 1 Topographic map of the studied area
| 数据类型 | 时间 (年份) | 分辨率 | 数据来源 |
|---|---|---|---|
| 土地利用数据 | 2000、2010、2020 | 30 m | 中科院资源环境科学与数据中心 ( |
| GDP | 2000、2010、2020 | 1 km | |
| 人口密度 | 2000、2010、2020 | 1 km | WorldPop ( |
| DEM | 2000 | 30 m | 地理空间数据云 ( |
| 潜在蒸散发 | 2000、2010、2020 | 1 km | 国家地球系统科学数据中心 ( |
| NDVI | 2000、2010、2020 | 1 km | |
| 气温 | 2000、2010、2020 | 1 km | 国家青藏高原科学数据中心 ( |
| 降水 | 2000、2010、2020 | 1 km | |
| 太阳辐射 | 2000、2010、2020 | 1 km | ERA5数据集 ( |
| 土壤数据 | 2000 | 1 km | 世界土壤数据库 ( |
| 粮食产量 | 2000、2010、2020 | ‒ | 各相关市、区 (县) 2000-2020年统计年鉴 |
表1 数据来源
Table 1 Data sources
| 数据类型 | 时间 (年份) | 分辨率 | 数据来源 |
|---|---|---|---|
| 土地利用数据 | 2000、2010、2020 | 30 m | 中科院资源环境科学与数据中心 ( |
| GDP | 2000、2010、2020 | 1 km | |
| 人口密度 | 2000、2010、2020 | 1 km | WorldPop ( |
| DEM | 2000 | 30 m | 地理空间数据云 ( |
| 潜在蒸散发 | 2000、2010、2020 | 1 km | 国家地球系统科学数据中心 ( |
| NDVI | 2000、2010、2020 | 1 km | |
| 气温 | 2000、2010、2020 | 1 km | 国家青藏高原科学数据中心 ( |
| 降水 | 2000、2010、2020 | 1 km | |
| 太阳辐射 | 2000、2010、2020 | 1 km | ERA5数据集 ( |
| 土壤数据 | 2000 | 1 km | 世界土壤数据库 ( |
| 粮食产量 | 2000、2010、2020 | ‒ | 各相关市、区 (县) 2000-2020年统计年鉴 |
| 用地类型 | 自然度 | 用地类型 | 自然度 |
|---|---|---|---|
| 水田 | 2 | 湖泊 | 5 |
| 旱地 | 2 | 水库坑塘 | 3 |
| 有林地 | 4 | 滩地 | 5 |
| 灌木林 | 3 | 城镇用地 | 1 |
| 疏林地 | 3 | 农村居民点 | 2 |
| 高覆盖草地 | 4 | 其他建设用地 | 1 |
| 中覆盖草地 | 3 | 沼泽地 | 5 |
| 低覆盖草地 | 2 | 裸岩石质地 | 5 |
| 河渠 | 4 |
表2 不同土地利用类型分值表
Table 2 Score table for different land use
| 用地类型 | 自然度 | 用地类型 | 自然度 |
|---|---|---|---|
| 水田 | 2 | 湖泊 | 5 |
| 旱地 | 2 | 水库坑塘 | 3 |
| 有林地 | 4 | 滩地 | 5 |
| 灌木林 | 3 | 城镇用地 | 1 |
| 疏林地 | 3 | 农村居民点 | 2 |
| 高覆盖草地 | 4 | 其他建设用地 | 1 |
| 中覆盖草地 | 3 | 沼泽地 | 5 |
| 低覆盖草地 | 2 | 裸岩石质地 | 5 |
| 河渠 | 4 |

图2 2000-2020年研究区5种生态系统服务时空分布
Figure 2 Spatial and temporal distribution of five ecosystem services in the studied area from 2000 to 2020

图3 2000-2020年4种生态系统服务簇状况
Figure 3 Status of four ecosystem service bundles from 2000 to 2020
| ESB类型 | 2000年 | 2010年 | 2020年 |
|---|---|---|---|
| ESB1 | 6.87 | 8.49 | 8.91 |
| ESB2 | 36.40 | 39.29 | 40.53 |
| ESB3 | 40.83 | 35.62 | 32.92 |
| ESB4 | 15.90 | 16.60 | 17.64 |
表3 2000-2020年ESB面积占比
Table 3 Proportion of ESB area from 2000 to 2020 %
| ESB类型 | 2000年 | 2010年 | 2020年 |
|---|---|---|---|
| ESB1 | 6.87 | 8.49 | 8.91 |
| ESB2 | 36.40 | 39.29 | 40.53 |
| ESB3 | 40.83 | 35.62 | 32.92 |
| ESB4 | 15.90 | 16.60 | 17.64 |
| ESB转化 类型 | 2000‒2010 | 2010‒2020 | ||||
|---|---|---|---|---|---|---|
| 面积/km2 | 占比/% | 面积/km2 | 占比/% | |||
| ESB1 | ESB1 | 4511.61 | 81.95 | 5707.22 | 82.17 | |
| ESB2 | 973.78 | 17.69 | 1132.58 | 16.31 | ||
| ESB3 | 16.52 | 0.30 | 88.63 | 1.28 | ||
| ESB4 | 3.10 | 0.06 | 17.52 | 0.25 | ||
| ESB2 | ESB1 | 2005.39 | 6.88 | 1429.38 | 4.55 | |
| ESB2 | 26385.04 | 90.50 | 28646.38 | 91.20 | ||
| ESB3 | 715.62 | 2.45 | 1191.32 | 3.79 | ||
| ESB4 | 47.50 | 0.16 | 143.25 | 0.46 | ||
| ESB3 | ESB1 | 180.71 | 0.55 | 122.64 | 0.43 | |
| ESB2 | 3952.96 | 12.09 | 2410.47 | 8.46 | ||
| ESB3 | 26544.07 | 81.17 | 23194.73 | 81.45 | ||
| ESB4 | 2026.04 | 6.20 | 2748.49 | 9.65 | ||
| ESB4 | ESB1 | 100.17 | 0.79 | 22.67 | 0.17 | |
| ESB2 | 162.12 | 1.27 | 206.11 | 1.55 | ||
| ESB3 | 1257.76 | 9.87 | 1843.67 | 13.90 | ||
| ESB4 | 11217.59 | 88.07 | 11194.94 | 84.38 | ||
表4 2000-2010、2010-2020年ESB间转换数量
Table 4 Number of transformations between ESBs from 2000 to 2010 and 2010 to 2020
| ESB转化 类型 | 2000‒2010 | 2010‒2020 | ||||
|---|---|---|---|---|---|---|
| 面积/km2 | 占比/% | 面积/km2 | 占比/% | |||
| ESB1 | ESB1 | 4511.61 | 81.95 | 5707.22 | 82.17 | |
| ESB2 | 973.78 | 17.69 | 1132.58 | 16.31 | ||
| ESB3 | 16.52 | 0.30 | 88.63 | 1.28 | ||
| ESB4 | 3.10 | 0.06 | 17.52 | 0.25 | ||
| ESB2 | ESB1 | 2005.39 | 6.88 | 1429.38 | 4.55 | |
| ESB2 | 26385.04 | 90.50 | 28646.38 | 91.20 | ||
| ESB3 | 715.62 | 2.45 | 1191.32 | 3.79 | ||
| ESB4 | 47.50 | 0.16 | 143.25 | 0.46 | ||
| ESB3 | ESB1 | 180.71 | 0.55 | 122.64 | 0.43 | |
| ESB2 | 3952.96 | 12.09 | 2410.47 | 8.46 | ||
| ESB3 | 26544.07 | 81.17 | 23194.73 | 81.45 | ||
| ESB4 | 2026.04 | 6.20 | 2748.49 | 9.65 | ||
| ESB4 | ESB1 | 100.17 | 0.79 | 22.67 | 0.17 | |
| ESB2 | 162.12 | 1.27 | 206.11 | 1.55 | ||
| ESB3 | 1257.76 | 9.87 | 1843.67 | 13.90 | ||
| ESB4 | 11217.59 | 88.07 | 11194.94 | 84.38 | ||
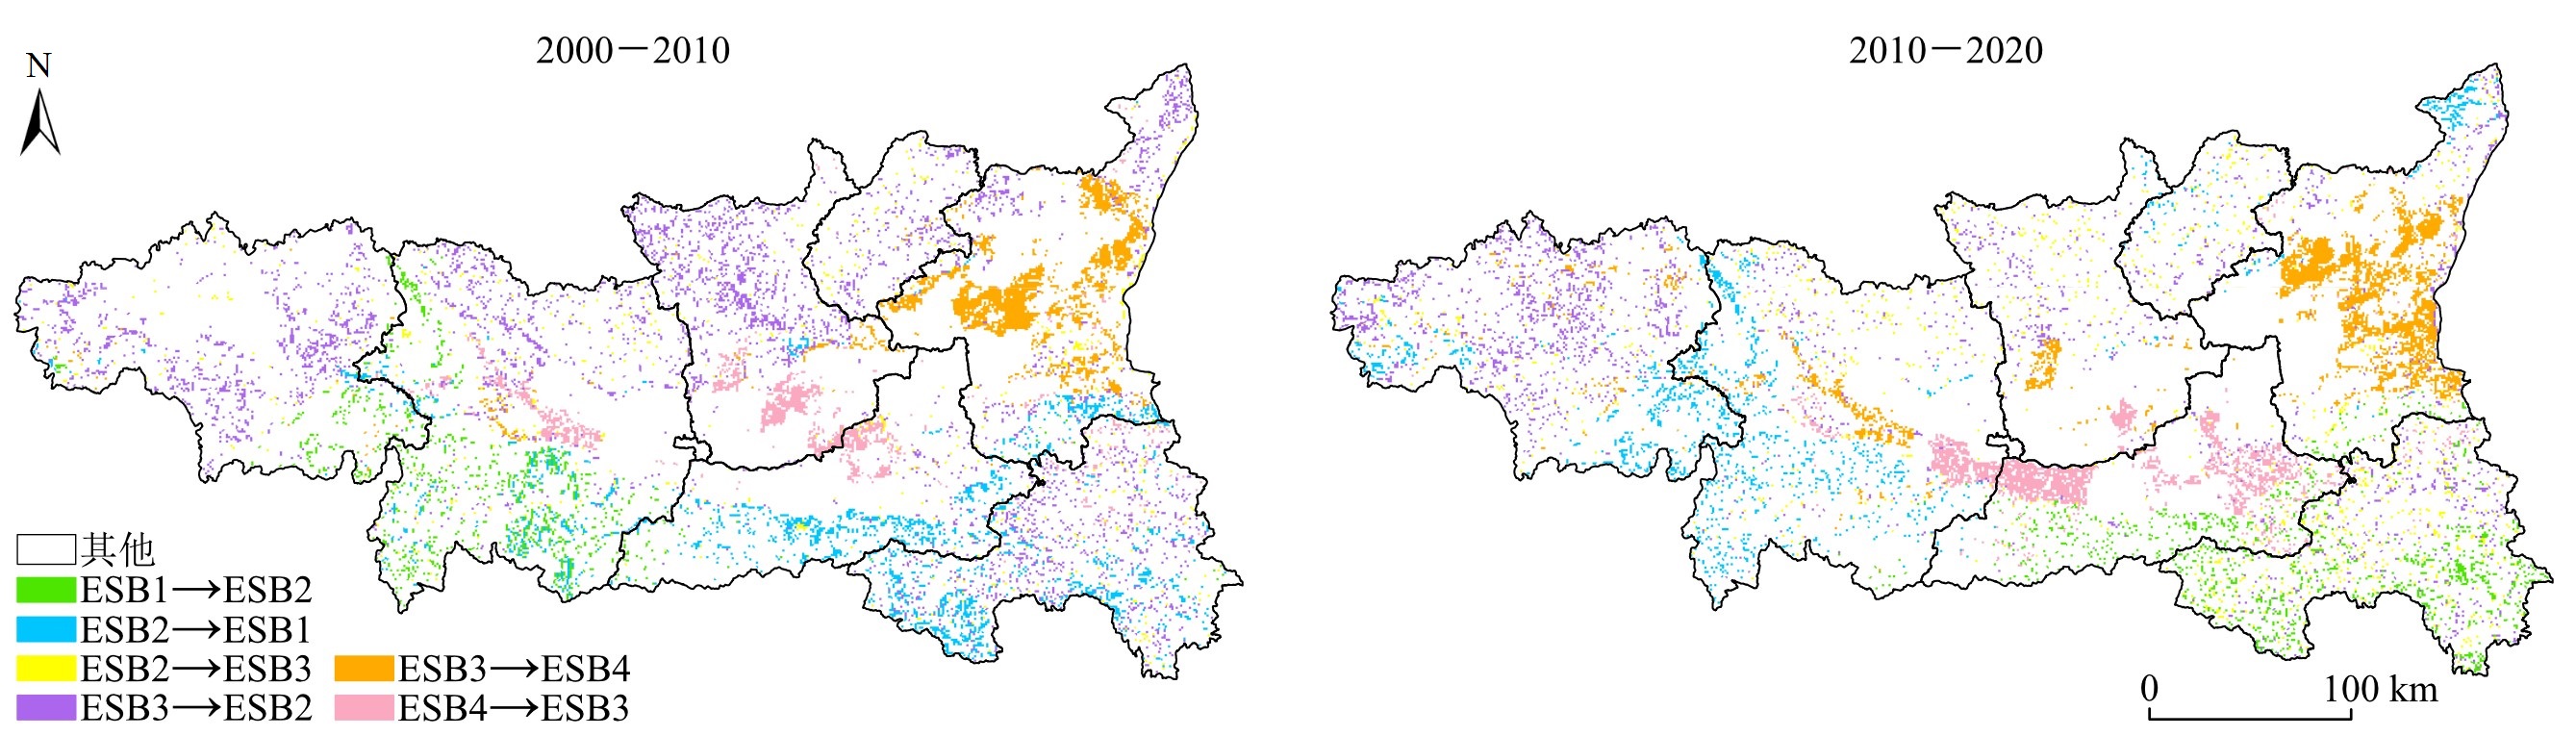
图4 2000-2020年ESB转换空间分布情况
Figure 4 Spatial distribution of ESB transformations from 2000 to 2020
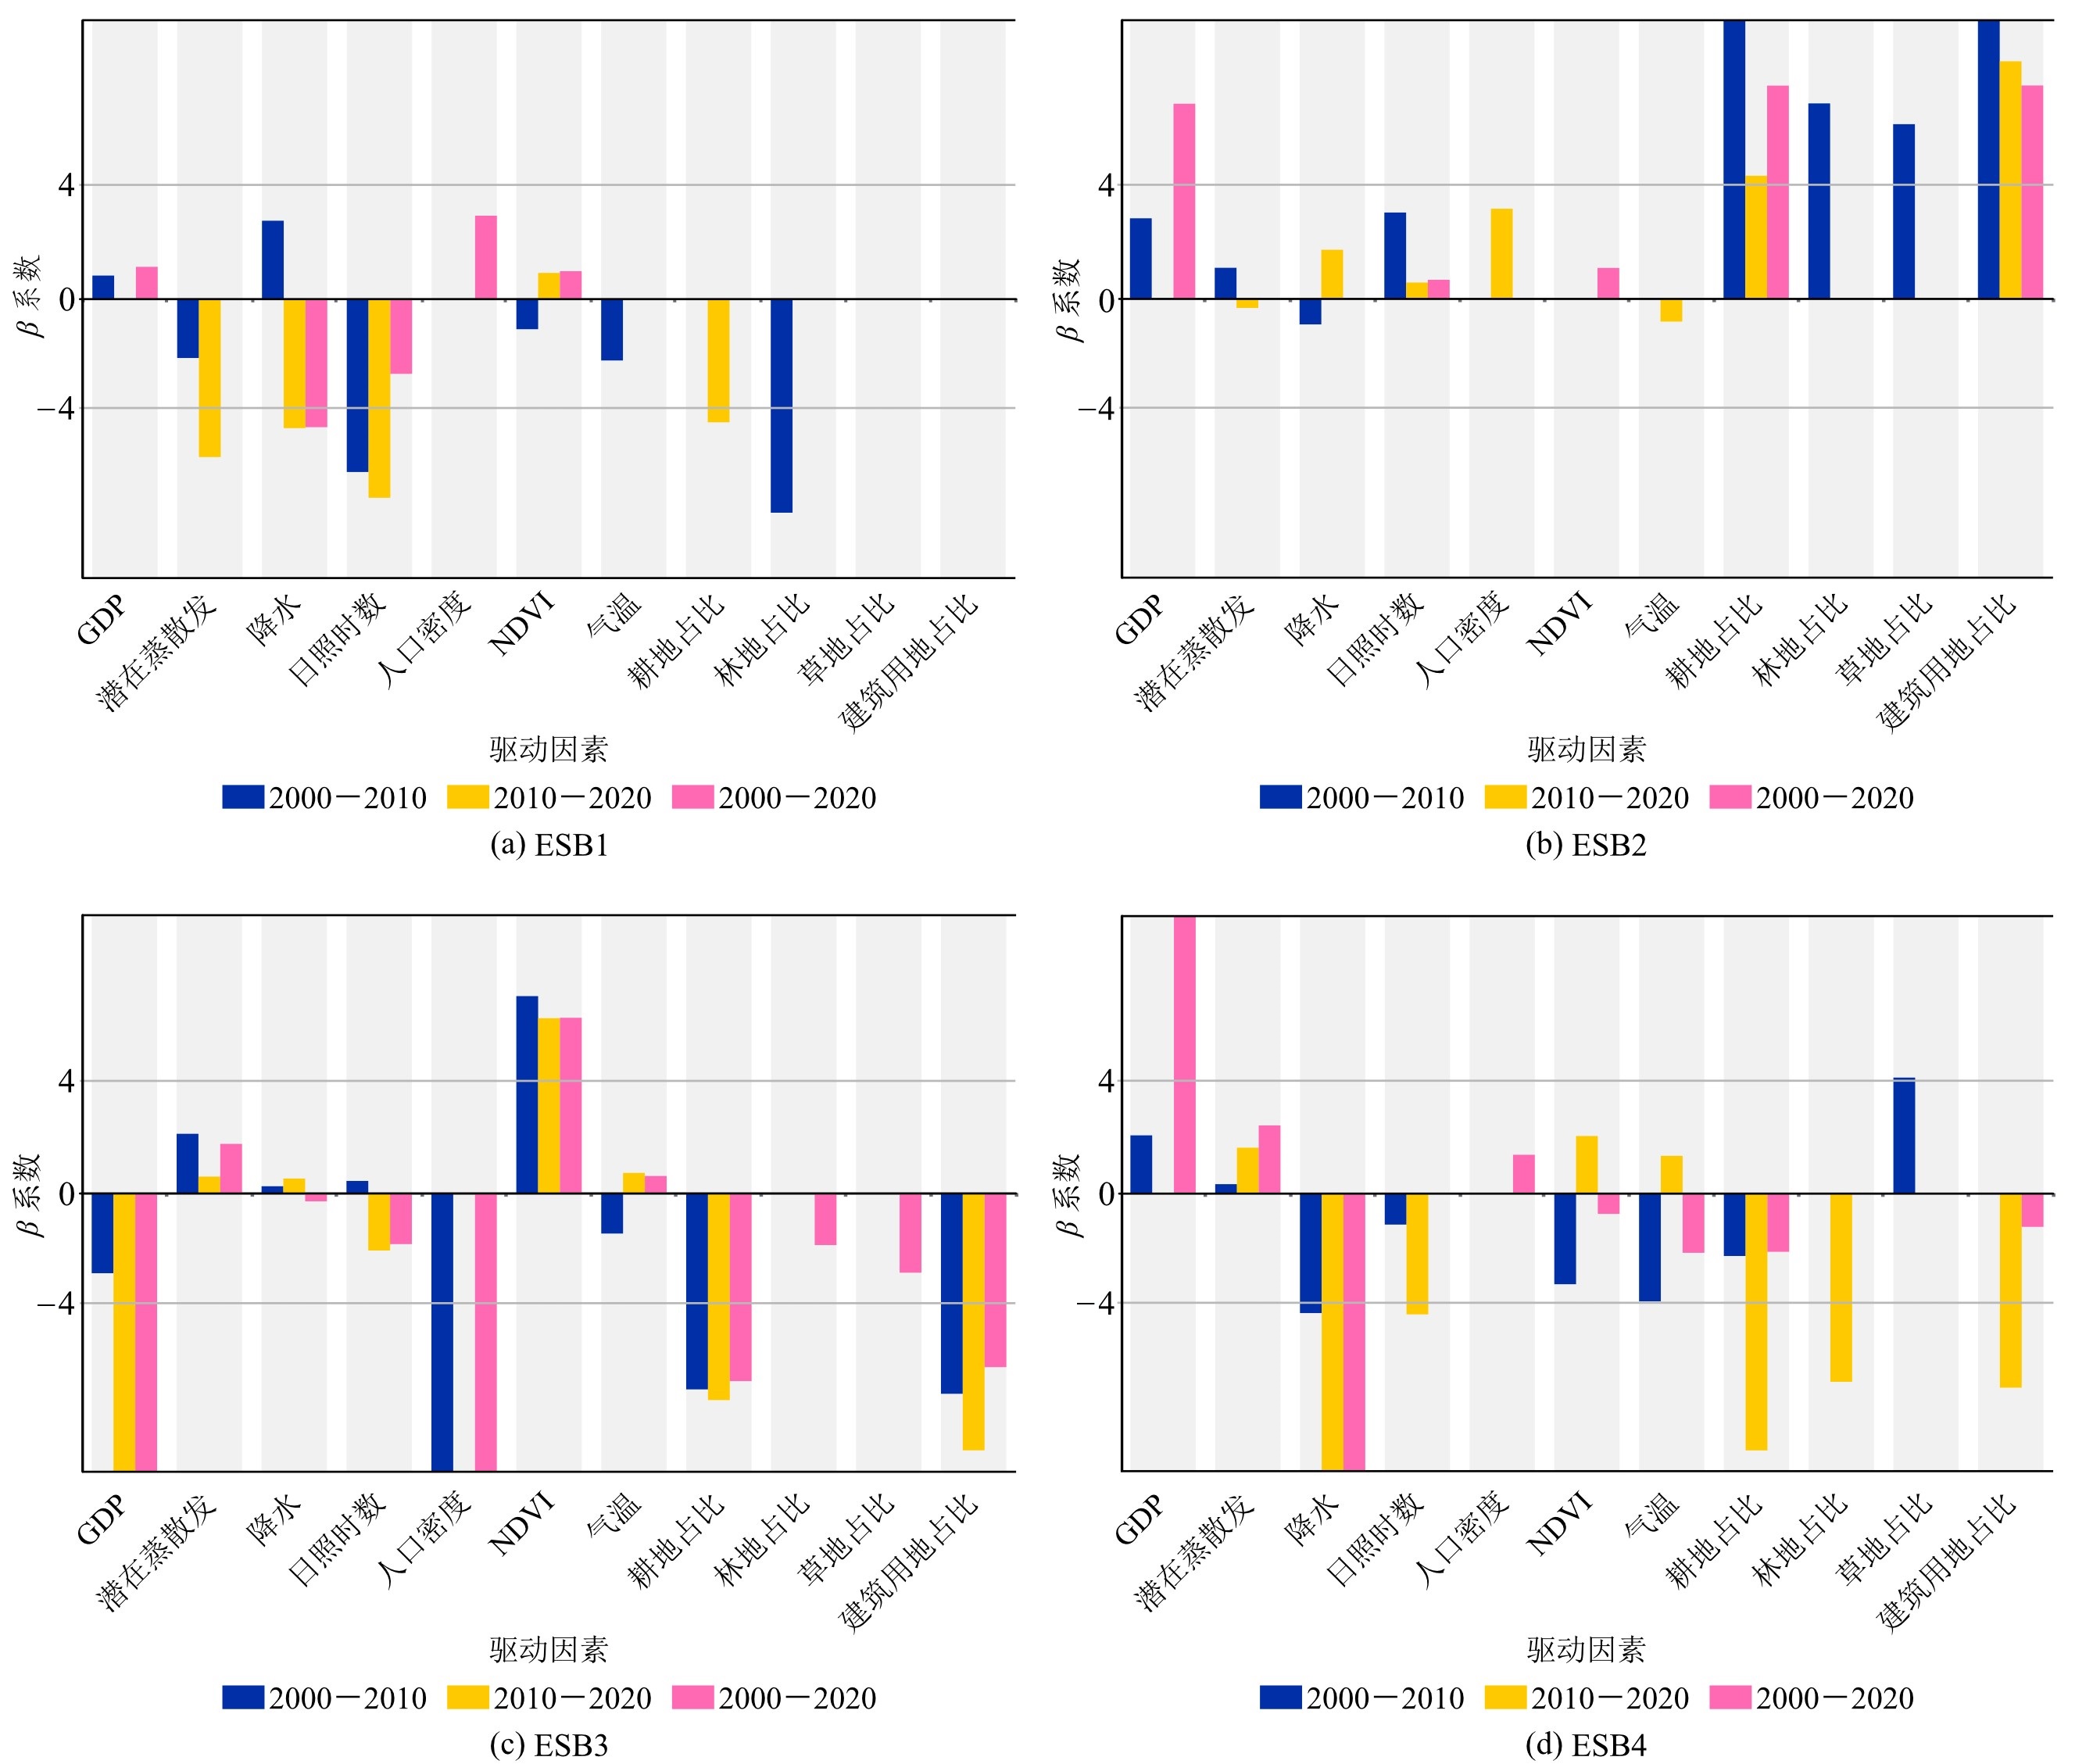
图5 不同ESB中驱动因素的β系数
Figure 5 β coefficient of drivers in different ESBs
| ESB类型 | 生态系统服务 | 游憩服务 | 土壤保持 | 净初级生产力 | 粮食生产 | 生境质量 |
|---|---|---|---|---|---|---|
| ESB1 | 游憩服务 | 1.000 | -0.023 | 0.004 | -0.108** | 0.379** |
| 土壤保持 | 1.000 | -0.122** | 0.017 | -0.008 | ||
| NPP | 1.000 | -0.016 | 0.117** | |||
| 粮食生产 | 1.000 | -0.232** | ||||
| 生境质量 | 1.000 | |||||
| ESB2 | 游憩服务 | 1.000 | 0.069**1) | 0.167** | -0.026** | 0.483** |
| 土壤保持 | 1.000 | 0.194** | -0.074** | 0.169** | ||
| NPP | 1.000 | -0.117** | 0.372** | |||
| 粮食生产 | 1.000 | -0.153** | ||||
| 生境质量 | 1.000 | |||||
| ESB3 | 游憩服务 | 1.000 | 0.168** | 0.075** | -0.086** | 0.316** |
| 土壤保持 | 1.000 | 0.250** | 0.112** | 0.286** | ||
| NPP | 1.000 | 0.044** | 0.304** | |||
| 粮食生产 | 1.000 | 0.007 | ||||
| 生境质量 | 1.000 | |||||
| ESB4 | 游憩服务 | 1.000 | 0.231** | 0.084** | 0.041** | 0.012 |
| 土壤保持 | 1.000 | 0.131** | -0.060** | 0.228** | ||
| NPP | 1.000 | 0.400** | 0.240** | |||
| 粮食生产 | 1.000 | -0.102** | ||||
| 生境质量 | 1.000 |
表5 2020年ESB内ES间权衡协同关系
Table 5 Trade-offs of synergies between ES within ESB in 2020
| ESB类型 | 生态系统服务 | 游憩服务 | 土壤保持 | 净初级生产力 | 粮食生产 | 生境质量 |
|---|---|---|---|---|---|---|
| ESB1 | 游憩服务 | 1.000 | -0.023 | 0.004 | -0.108** | 0.379** |
| 土壤保持 | 1.000 | -0.122** | 0.017 | -0.008 | ||
| NPP | 1.000 | -0.016 | 0.117** | |||
| 粮食生产 | 1.000 | -0.232** | ||||
| 生境质量 | 1.000 | |||||
| ESB2 | 游憩服务 | 1.000 | 0.069**1) | 0.167** | -0.026** | 0.483** |
| 土壤保持 | 1.000 | 0.194** | -0.074** | 0.169** | ||
| NPP | 1.000 | -0.117** | 0.372** | |||
| 粮食生产 | 1.000 | -0.153** | ||||
| 生境质量 | 1.000 | |||||
| ESB3 | 游憩服务 | 1.000 | 0.168** | 0.075** | -0.086** | 0.316** |
| 土壤保持 | 1.000 | 0.250** | 0.112** | 0.286** | ||
| NPP | 1.000 | 0.044** | 0.304** | |||
| 粮食生产 | 1.000 | 0.007 | ||||
| 生境质量 | 1.000 | |||||
| ESB4 | 游憩服务 | 1.000 | 0.231** | 0.084** | 0.041** | 0.012 |
| 土壤保持 | 1.000 | 0.131** | -0.060** | 0.228** | ||
| NPP | 1.000 | 0.400** | 0.240** | |||
| 粮食生产 | 1.000 | -0.102** | ||||
| 生境质量 | 1.000 |
| [1] |
BENNETT E M, PETERSON G D, GORDON L J, 2009. Understanding relationships among multiple ecosystem services[J]. Ecology Letters, 12(12): 1394-404.
DOI PMID |
| [2] | CHEN S, CHEN H, YANG R J, et al., 2023. Linking social-ecological management and ecosystem service bundles: Lessons from a peri-urban agriculture landscape[J]. Land Use Policy, 131: 106697. |
| [3] | CORTINOVIS C, GENELETTI D, 2018. Ecosystem services in urban plans: What is there, and what is still needed for better decisions[J]. Land Use Policy, 70: 298-312. |
| [4] | COSTANZA R, GROOT D R, BRAAT L, et al., 2017. Twenty years of ecosystem services: How far have we come and how far do we still need to go?[J]. Ecosystem Services, 28(Part A): 1-16. |
| [5] |
DAGMAR H, NEELE L, ERIK A, et al., 2014. A quantitative review of urban ecosystem service assessments: Concepts, models, and implementation[J]. Ambio, 43(4): 413-33.
DOI PMID |
| [6] |
DELPHINE R, JEANINE R, ELENA B, 2015. Historical dynamics in ecosystem service bundles[J]. Proceedings of the National Academy of Sciences of the United States of America, 112(43): 13411-13416.
DOI PMID |
| [7] | GROTEN S M E, 1993. NDVI-crop monitoring and early yield assessment of Burkina Faso[J]. International Journal of Remote Sensing, 14(8): 1495-1515. |
| [8] | LI S C, ZHAO Y L, XIAO W, et al., 2021. Identifying ecosystem service bundles and the spatiotemporal characteristics of trade-offs and synergies in coal mining areas with a high groundwater table[J]. Science of the Total Environment, 807(Part 3): 151036. |
| [9] | ZHAO H Z, HE J H, LIU D F, et al., 2023. Incorporating ecological connectivity into ecological functional zoning: A case study in the middle reaches of Yangtze River urban agglomeration[J]. Ecological Informatics, 75: 102098. |
| [10] | ZINIA J N, MCSHANE P, 2018. Ecosystem services management: An evaluation of green adaptations for urban development in Dhaka, Bangladesh[J]. Landscape and Urban Planning, 173: 23-32. |
| [11] |
邓元杰, 侯孟阳, 张晓, 等, 2022. 基于Logistic回归模型的陕西秦巴山区林地变化驱动力分析[J]. 南京林业大学学报(自然科学版), 46(1): 106-114.
DOI |
| DENG Y J, HOU M Y, ZHANG X, et al., 2022. Drivers of forestland change in the Qinba Mountain region of Shaanxi based on the Logistic regression model[J]. Journal of Nanjing Forestry University (Natural Science Edition), 46(1): 106-114. | |
| [12] |
方露露, 许德华, 王伦澈, 等, 2021. 长江、黄河流域生态系统服务变化及权衡协同关系研究[J]. 地理研究, 40(3): 821-838.
DOI |
| FANG L L, XU D H, WANG L C, et al., 2021. The study of ecosystem services and the comparison of trade-off and synergy in Yangtze River Basin and Yellow River Basin[J]. Geographical Research, 40(3): 821-838. | |
| [13] | 冯兆, 彭建, 吴健生, 2020. 基于生态系统服务簇的深圳市生态系统服务时空演变轨迹研究[J]. 生态学报, 40(8): 2545-2554. |
| FENG Z, PENG J, WU J S, 2020. Ecosystem service bundles based approach to exploring the trajectories of ecosystem service spatiotemporal change: A case study of Shenzhen City[J]. Acta Ecologica Sinica, 40(8): 2545-2554. | |
| [14] | 古圳威, 刘京, 陈怡, 等, 2023. 陕西渭北旱塬区生境质量及碳储量时空演变分析与模拟[J]. 环境科学, 44(8): 4666-4678. |
| GU Z W, LIU J, CHEN Y, et al., 2023. Analysis and simulation of the spatiotemporal evolution of habitat quality and carbon storage in the Weibei Dry Plateau Region of Shaanxi[J]. Environmental Science, 44(8): 4666-4678. | |
| [15] | 郭洋, 杨飞龄, 王军军, 等, 2020. “三江并流” 区游憩文化生态系统服务评价研究[J]. 生态学报, 40(13): 4351-4361. |
| GUO Y, YANG F L, WANG J J, et al., 2020. Assessment of the tourism and recreation cultural ecosystem services in Three Parallel Rivers Region[J]. Acta Ecologica Sinica, 40(13): 4351-4361. | |
| [16] |
郝梦雅, 任志远, 孙艺杰, 等, 2017. 关中盆地生态系统服务的权衡与协同关系动态分析[J]. 地理研究, 36(3): 592-602.
DOI |
| HAO M Y, REN Z Y, SUN Y J, et al., 2017. The dynamic analysis of trade-off and synergy of ecosystem services in the Guanzhong Basin[J]. Geographical Research, 36(3): 592-602. | |
| [17] |
刘迪, 陈海, 荔童, 等, 2022. 黄土丘陵沟壑区村域生态系统服务簇的时空分异及其地形梯度分析[J]. 地理科学进展, 41(4): 670-681.
DOI |
|
LIU D, CHEN H, LI T, et al., 2022. Spatiotemporal differentiation of village ecosystem service bundles in the loess hilly and gully region and terrain gradient analysis[J]. Progress in Geography, 41(4): 670-681.
DOI |
|
| [18] | 李军保, 俞靓, 谢治国, 等, 2023. 陕西省秦岭自然保护区建设现状分析[J]. 陕西林业科技, 51(6): 83-86. |
| LI J B, YU L, XIE Z G, et al., 2023. Analysis on the construction status of Qinling Nature Reserve in Shaanxi Province[J]. Shaanxi Forest Science and Technology, 51(6): 83-86. | |
| [19] | 廖俊, 焦菊英, 严增, 等, 2024. RUSLE模型对黄土高原退耕植被恢复坡面土壤侵蚀的模拟效果分析[J]. 水土保持学报, 38(2): 97-108. |
| LIAO J, JIAO J Y, YAN Z, et al., 2024. Simulation effect analysis of RUSLE model on slope soil erosion restored by reclaimed vegetation in Loess Plateau[J]. Journal of Soil and Water Conservation, 38(2): 97-108. | |
| [20] |
李倩茹, 贾彦龙, 王慧军, 等, 2023. 基于生态功能区的河北省生态系统服务权衡与协同分析[J]. 地理学报, 78(11): 2833-2849.
DOI |
|
LI Q R, JIA Y L, WANG H J, et al., 2023. Analysis of trade-off and synergy effects of ecosystem services in Hebei Province from the perspective of ecological function area[J]. Acta Geographica Sinica, 78(11): 2833-2849.
DOI |
|
| [21] | 荔琢, 侯鹏, 蒋卫国, 等, 2023. 土地利用变化对生态系统服务功能的驱动效应研究——以秦岭地区自然保护区为例[J]. 北京师范大学学报(自然科学版), 59(2): 196-205. |
| LI Z, HOU P, JIANG W G, et al., 2023. The driving effect of land use changes on ecosystem services: A case study at the Qinling Natural Reserves[J]. Journal of Beijing Normal University (Natural Science), 59(2): 196-205. | |
| [22] | 潘莹, 郑华, 易齐涛, 等, 2021. 流域生态系统服务簇变化及影响因素——以大清河流域为例[J]. 生态学报, 41(13): 5204-5213. |
| PAN Y, ZHENG H, YI Q T, et al., 2021. The change and driving factors of ecosystem service bundles: A case study of Daqing River Basin[J]. Acta Ecologica Sinica, 41(13): 5204-5213. | |
| [23] |
宋家鹏, 陈松林, 2021. 基于生态系统服务簇的福州市生态系统服务格局[J]. 应用生态学报, 32(3): 1045-1053.
DOI |
| SONG J P, CHEN S L, 2021. Ecosystem service pattern of Fuzhou City based on ecosystem service bundles[J]. Chinese Journal of Applied Ecology, 32(3): 1045-1053. | |
| [24] | 孙艺杰, 任志远, 郝梦雅, 等, 2019. 黄土高原生态系统服务权衡与协同时空变化及影响因素——以延安市为例[J]. 生态学报, 39(10): 3443-3454. |
| SUN Y J, REN Z Y, HAO M Y, et al., 2019. Spatial and temporal changes in the synergy and trade-off between ecosystem services, and its influencing factors in Yanan, Loess Plateau[J]. Acta Ecologica Sinica, 39(10): 3443-3454. | |
| [25] |
王彬宇, 王玲, 陈俊辰, 等, 2023. 四湖流域生态功能分区及其影响因素识别[J]. 应用生态学报, 34(10): 2757-2766.
DOI |
|
WANG B Y, WANG L, CHEN J C, et al., 2023. Identification of ecological functional zoning and its influencing factors in the Sihu Lake Basin, China[J]. Chinese Journal of Applied Ecology, 34(10): 2757-2766.
DOI |
|
| [26] |
王琦琨, 武玮, 杨雪琪, 等, 2022. 陕西省生境质量时空演变及驱动机制分析[J]. 干旱区研究, 39(5): 1684-1694.
DOI |
|
WANG Q K, WU W, YANG X Q, et al., 2022. Spatial-temporal changes and driving factors of habitat quality in Shaanxi Province during the past 20 years[J]. Arid Zone Research, 39(5): 1684-1694.
DOI |
|
| [27] | 王胤懿, 2023. 基于生态系统服务水平提升的乡村景观优化研究——以杭州市富阳区场口镇为例[D]. 杭州: 浙江农林大学:59-72. |
| WANY Y Y, 2023. Study on rural landscape optimization based on ecosystem services enhancement: A case study of Changkou Town, Fuyang District[D]. Hangzhou: Zhejiang A & F University: 59-72. | |
| [28] | 韦钧培, 杨云川, 谢鑫昌, 等, 2022. 基于服务簇的南宁市生态系统服务权衡与协同关系研究[J]. 生态与农村环境学报, 38(1): 21-31. |
| WEI J P, YANG Y C, XIE X C, et al., 2022. Quantifying ecosystem service trade-offs and synergies in Nanning City based on ecosystem service bundle[J]. Journal of Ecology and Rural Environment, 38(1): 21-31. | |
| [29] | 魏健美, 李常斌, 武磊, 等, 2021. 基于USLE的甘南川西北土壤侵蚀研究[J]. 水土保持学报, 35(2): 31-37. |
| WEI J M, LI C B, WU L, et al., 2021. Study on soil erosion in northwestern Sichuan and southern Gansu (NSSG) based on USLE[J]. Journal of Soil and Water Conservation, 35(2): 31-37. | |
| [30] | 王诗媛, 向洋, 高翻翻, 等, 2024. 自然和人为因素影响下的生态系统服务时空演变特征——以关中平原城市群为例[J/OL]. 西安理工大学学报, 1-12[2024-09-20]. http://kns.cnki.net/kcms/detail/61.1294.n.20240708.1207.002.html. |
| WANG S Y, XIANG Y, GAO F F, et al., 2024. Spatiotemporal evolution characteristics of ecosystem services under the influence of natural and human factors: A case study of the urban agglomeration in the Guanzhong Plain[J/OL]. Journal of Xi’an University of Technology, 1-12 [2024-09-20]. http://kns.cnki.net/kcms/detail/61.1294.n.20240708.1207.002.html. | |
| [31] |
王治国, 白永平, 车磊, 等, 2020. 关中平原城市群植被覆盖的时空特征与影响因素[J]. 干旱区地理, 43(4): 1041-1050.
DOI |
| WANG Z G, BAI Y P, CHE L, et al., 2020. Spatiotemporal characteristics and influencing factors of vegetation coverage in urban agglomeration of Guanzhong Plain[J]. Arid Land Geography, 43(4): 1041-1050. | |
| [32] | 肖杰, 郑国璋, 赵培, 等, 2020. 基于GIS的关中-天水经济区人口分布特征及影响因素研究[J]. 中国农业资源与区划, 41(5): 167-175. |
| XIAO J, ZHENG G Z, ZHAO P, et al., 2020. Study on population distribution and influencing factors of Guanzhong-Tianshui Economic Zone base on GIS[J]. Chinese Journal of Agricultural Resources and Regional Planning, 41(5): 167-175. | |
| [33] | 闫晓露, 李欣媛, 刘澄浩, 等, 2022. 生态系统服务簇空间演变轨迹及其社会-生态驱动的地理探测——以大连市为例[J]. 生态学报, 42(14): 5734-5747. |
| YAN X L, LI X Y, LIU C H, et al., 2022. Spatial evolution trajectory of ecosystem service bundles and its social-ecological driven by geographical exploration: A case study of Dalian[J]. Acta Ecologica Sinica, 42(14): 5734-5747. | |
| [34] | 杨慧, 2022. 陕西省粮食产量及其影响因素分析[D]. 西安: 长安大学: 56-61. |
| YANG H, 2022. Analysis on the grain yield and its influencing factors in Shaanxi Province[D]. Xi’an: Chang’an University: 56-61. | |
| [35] |
杨晓楠, 李晶, 秦克玉, 等, 2015. 关中-天水经济区生态系统服务的权衡关系[J]. 地理学报, 70(11): 1762-1773.
DOI |
|
YANG X N, LI J, QIN K Y, et al., 2015. Trade-offs between ecosystem services in Guanzhong-Tianshui Economic Region[J]. Acta Geographica Sinica, 70(11): 1762-1773.
DOI |
|
| [36] | 袁碧霞, 2021. 绿色基础设施空间格局对生态系统服务权衡与协同关系的影响研究——以武汉都市圈为例[D]. 武汉: 华中农业大学: 26-27. |
| YUAN B X, 2021. Research on the impact of spatial pattern of green infrastructure on the trade-off and synergy of ecosystem service: A case study of Wuhan Metropolitan[D]. Wuhan: Huazhong Agricultural University: 26-27. | |
| [37] | 岳萌, 耿广坡, 王涛, 等, 2023. 2000-2019年黄河流域陕西段植被NDVI时空变化及其驱动因素分析[J]. 水土保持研究, 30(2): 238-246. |
| YUE M, GENG G P, WANG T, et al., 2023. Spatiotemporal variation of vegetation NDVI and its driving factors in the Shaanxi section of the Yellow River Basin from 2000 to 2019[J]. Research of Soil and Water Conservation, 30(2): 238-246. | |
| [38] | 曾莉, 2020. 关中-天水经济区生态系统服务权衡协同关系及空间格局优化研究[D]. 西安: 陕西师范大学: 1-6. |
| ZENG L, 2020. Study on the synergistic relationship and spatial pattern optimization of ecosystem service trade-offs in Guanzhong-Tianshui Economic Zone[D]. Xi’an: Shaanxi Normal University: 1-6. | |
| [39] |
张鑫, 张丹, 张广森, 等, 2024. 关中平原城市群生态系统服务时空特征及生态功能区划分[J]. 干旱区地理, 47(9): 1587-1595.
DOI |
|
ZHANG X, ZHANG D, ZHANG G S, et al., 2024. Spatiotemporal characteristics of ecosystem services and ecological function areas in Guanzhong Plain urban agglomeration[J]. Arid Land Geography, 47(9): 1587-1595.
DOI |
|
| [40] |
朱文泉, 潘耀忠, 张锦水, 2007. 中国陆地植被净初级生产力遥感估算[J]. 植物生态学报, 31(3): 413-424.
DOI |
| ZHU W Q, PAN Y Z, ZHANG J S, 2007. Estimation of net primary productivity of Chinese terrestrial vegetation based on remote sensing[J]. Chinese Journal of Plant Ecology, 31(3): 413-424. |
| [1] | 张舒涵, 姜海玲, 于海淋, 冯馨慧. 沈阳现代化都市圈景观生态风险时空演变及驱动力分析[J]. 生态环境学报, 2024, 33(9): 1471-1481. |
| [2] | 高文明, 宋芊, 张皓翔, 王士如. 基于生态系统服务功能和保护动物栖息地适宜性评价的优先保护区选取——以三江源地区为例[J]. 生态环境学报, 2024, 33(8): 1318-1328. |
| [3] | 王雯, 侯青青, 裴婷婷. 甘肃河东地区坡度对生态系统服务的影响及其阈值效应[J]. 生态环境学报, 2024, 33(7): 1117-1129. |
| [4] | 张维琛, 王惺琪, 王博杰. 塔布河流域生态系统服务时空格局及影响因素分析[J]. 生态环境学报, 2024, 33(7): 1142-1152. |
| [5] | 向男, 王明旭, 张宏锋, 廖宝淦. 生态保护重要性分区及其长时间序列生境状况时空分异研究——以广东省为例[J]. 生态环境学报, 2024, 33(6): 958-968. |
| [6] | 王鹭莹, 李小马, 甘德欣, 刘鹏翱, 郭胜, 李毅. 长株潭城市群生态系统服务权衡与协同关系的空间异质性及其驱动因素[J]. 生态环境学报, 2024, 33(6): 969-979. |
| [7] | 王美娜, 范顺祥, 舒翰俊, 张建杰, 褚力其, 法玉琦. 河南省土壤侵蚀时空分异特征及土壤保持经济价值[J]. 生态环境学报, 2024, 33(5): 730-744. |
| [8] | 程鹏, 孙明东, 宋晓伟. 中国灰水足迹时空动态演进及驱动因素研究[J]. 生态环境学报, 2024, 33(5): 745-756. |
| [9] | 杨非凡, 何浩. 基于“EVI-ESV”伊犁河谷生态环境评估及生态分区构建[J]. 生态环境学报, 2024, 33(4): 655-664. |
| [10] | 李荣杰, 李惠梅, 武非非, 赵明德, 王诗涵, 孙雪颖. 青海湖流域生态系统服务空间分异规律及驱动力研究[J]. 生态环境学报, 2024, 33(2): 301-309. |
| [11] | 田嘉莉, 毛靖宇, 彭甲超, 姚婷婷, 付书科. 重污染企业减污降碳协同效应时空分异特征及其驱动因素分析——来自A股100家企业的证据[J]. 生态环境学报, 2024, 33(11): 1661-1671. |
| [12] | 罗光浴, 王志远. 洞庭湖生态经济区国土空间格局演变的碳储量效应及驱动因素研究[J]. 生态环境学报, 2024, 33(11): 1672-1685. |
| [13] | 许静, 王德仁. 基于VORS模型的黄河流域生态系统健康评估与预测[J]. 生态环境学报, 2024, 33(10): 1612-1623. |
| [14] | 高文明, 宋芊, 张皓翔, 王士如. 三江源区生态脆弱性时空演变及驱动因素分析[J]. 生态环境学报, 2024, 33(10): 1648-1660. |
| [15] | 李惠梅, 李荣杰, 晏旭昇, 武非非, 高泽兵, 谭永忠. 青海湖流域生态风险评价及生态功能分区研究[J]. 生态环境学报, 2023, 32(7): 1185-1195. |
| 阅读次数 | ||||||
|
全文 |
|
|||||
|
摘要 |
|
|||||