生态环境学报 ›› 2023, Vol. 32 ›› Issue (1): 1-10.DOI: 10.16258/j.cnki.1674-5906.2023.01.001
• 研究论文 •
下一篇
贾志峰1,2,3,4,*( ), 刘鹏程1,2,3, 刘宇5, 吴博博1,2,3, 陈丹姿1,2,3, 张向飞6
收稿日期:2022-11-03
出版日期:2023-01-18
发布日期:2023-04-06
通讯作者:
*贾志峰(1986年生),男,副教授,博士,主要从事水文生态过程研究。E-mail: jiazhifeng123@163.com基金资助:
JIA Zhifeng1,2,3,4,*(), LIU Pengcheng1,2,3, LIU Yu5, WU Bobo1,2,3, CHEN Danzi1,2,3, ZHANG Xiangfei6
Received:2022-11-03
Online:2023-01-18
Published:2023-04-06
摘要:
探究植被变化及其对气候变化和人类活动的响应,对科学高效管理区域生态系统具有重要意义。基于年归一化植被指数(Normalized Difference Vegetation Index,NDVI)、标准化降水蒸散指数(Standardized Precipitation Evapotranspiration Index,SPEI)、年降水量和年平均气温数据,采用Theil-Sen Median趋势分析、Mann-Kendall趋势检验、残差分析等方法,定量分析了松辽流域1998—2018年NDVI时空变化特征及其驱动因素。结果表明,流域年均NDVI在0.72—0.82之间,呈极显著增加趋势,总体增长速率为0.0041/a;在2000—2005年和2009—2014年期间增速较快,平均增长速率分别为0.0137/a和0.0092/a。流域NDVI空间变化率在 (-0.44—0.44)/(10 a)之间,92.85%区域植被呈改善趋势,极显著改善区域面积占比达72.26%;而7.15%的区域植被呈退化趋势,极显著退化的区域面积占比仅为0.91%,退化区域主要集中在大兴安岭西部地区、渤海湾及东北各省会城市区。气候因素对流域NDVI影响在 (-1.4×10⁻³—1.6×10⁻³)/a之间,人类活动对流域NDVI影响在(-3.6×10-3—4.0×10-3)/a之间;气候驱动和人类活动驱动下流域植被呈极显著改善区域的面积占比分别为3.77%,62.84%。流域内有79.40%的区域人类活动贡献率超过了70%。气候变化对NDVI抑制的区域主要分布在海拉尔河左岸及大兴安岭西南侧区域;人类活动对NDVI抑制区域主要分布于东北城市群及大兴安岭西部区域。对于不同的土地利用类型,人类活动对NDVI的贡献率均明显高于气候变化的贡献率。在植被改善区域,人类活动对林地植被变化的贡献率最大,其次为耕地、未利用土地、草地。在植被退化区域,人类活动对草地植被变化的贡献率最大,其次为未利用土地、林地、耕地。建议在东北地区高质量发展战略规划中应更加重视对草地、未利用地的保护。
中图分类号:
贾志峰, 刘鹏程, 刘宇, 吴博博, 陈丹姿, 张向飞. 气候变化和人类活动对松辽流域植被覆盖的影响[J]. 生态环境学报, 2023, 32(1): 1-10.
JIA Zhifeng, LIU Pengcheng, LIU Yu, WU Bobo, CHEN Danzi, ZHANG Xiangfei. Effects of Climatic Change and Human Activities on Vegetation Cover in Songliao River Basin[J]. Ecology and Environment, 2023, 32(1): 1-10.
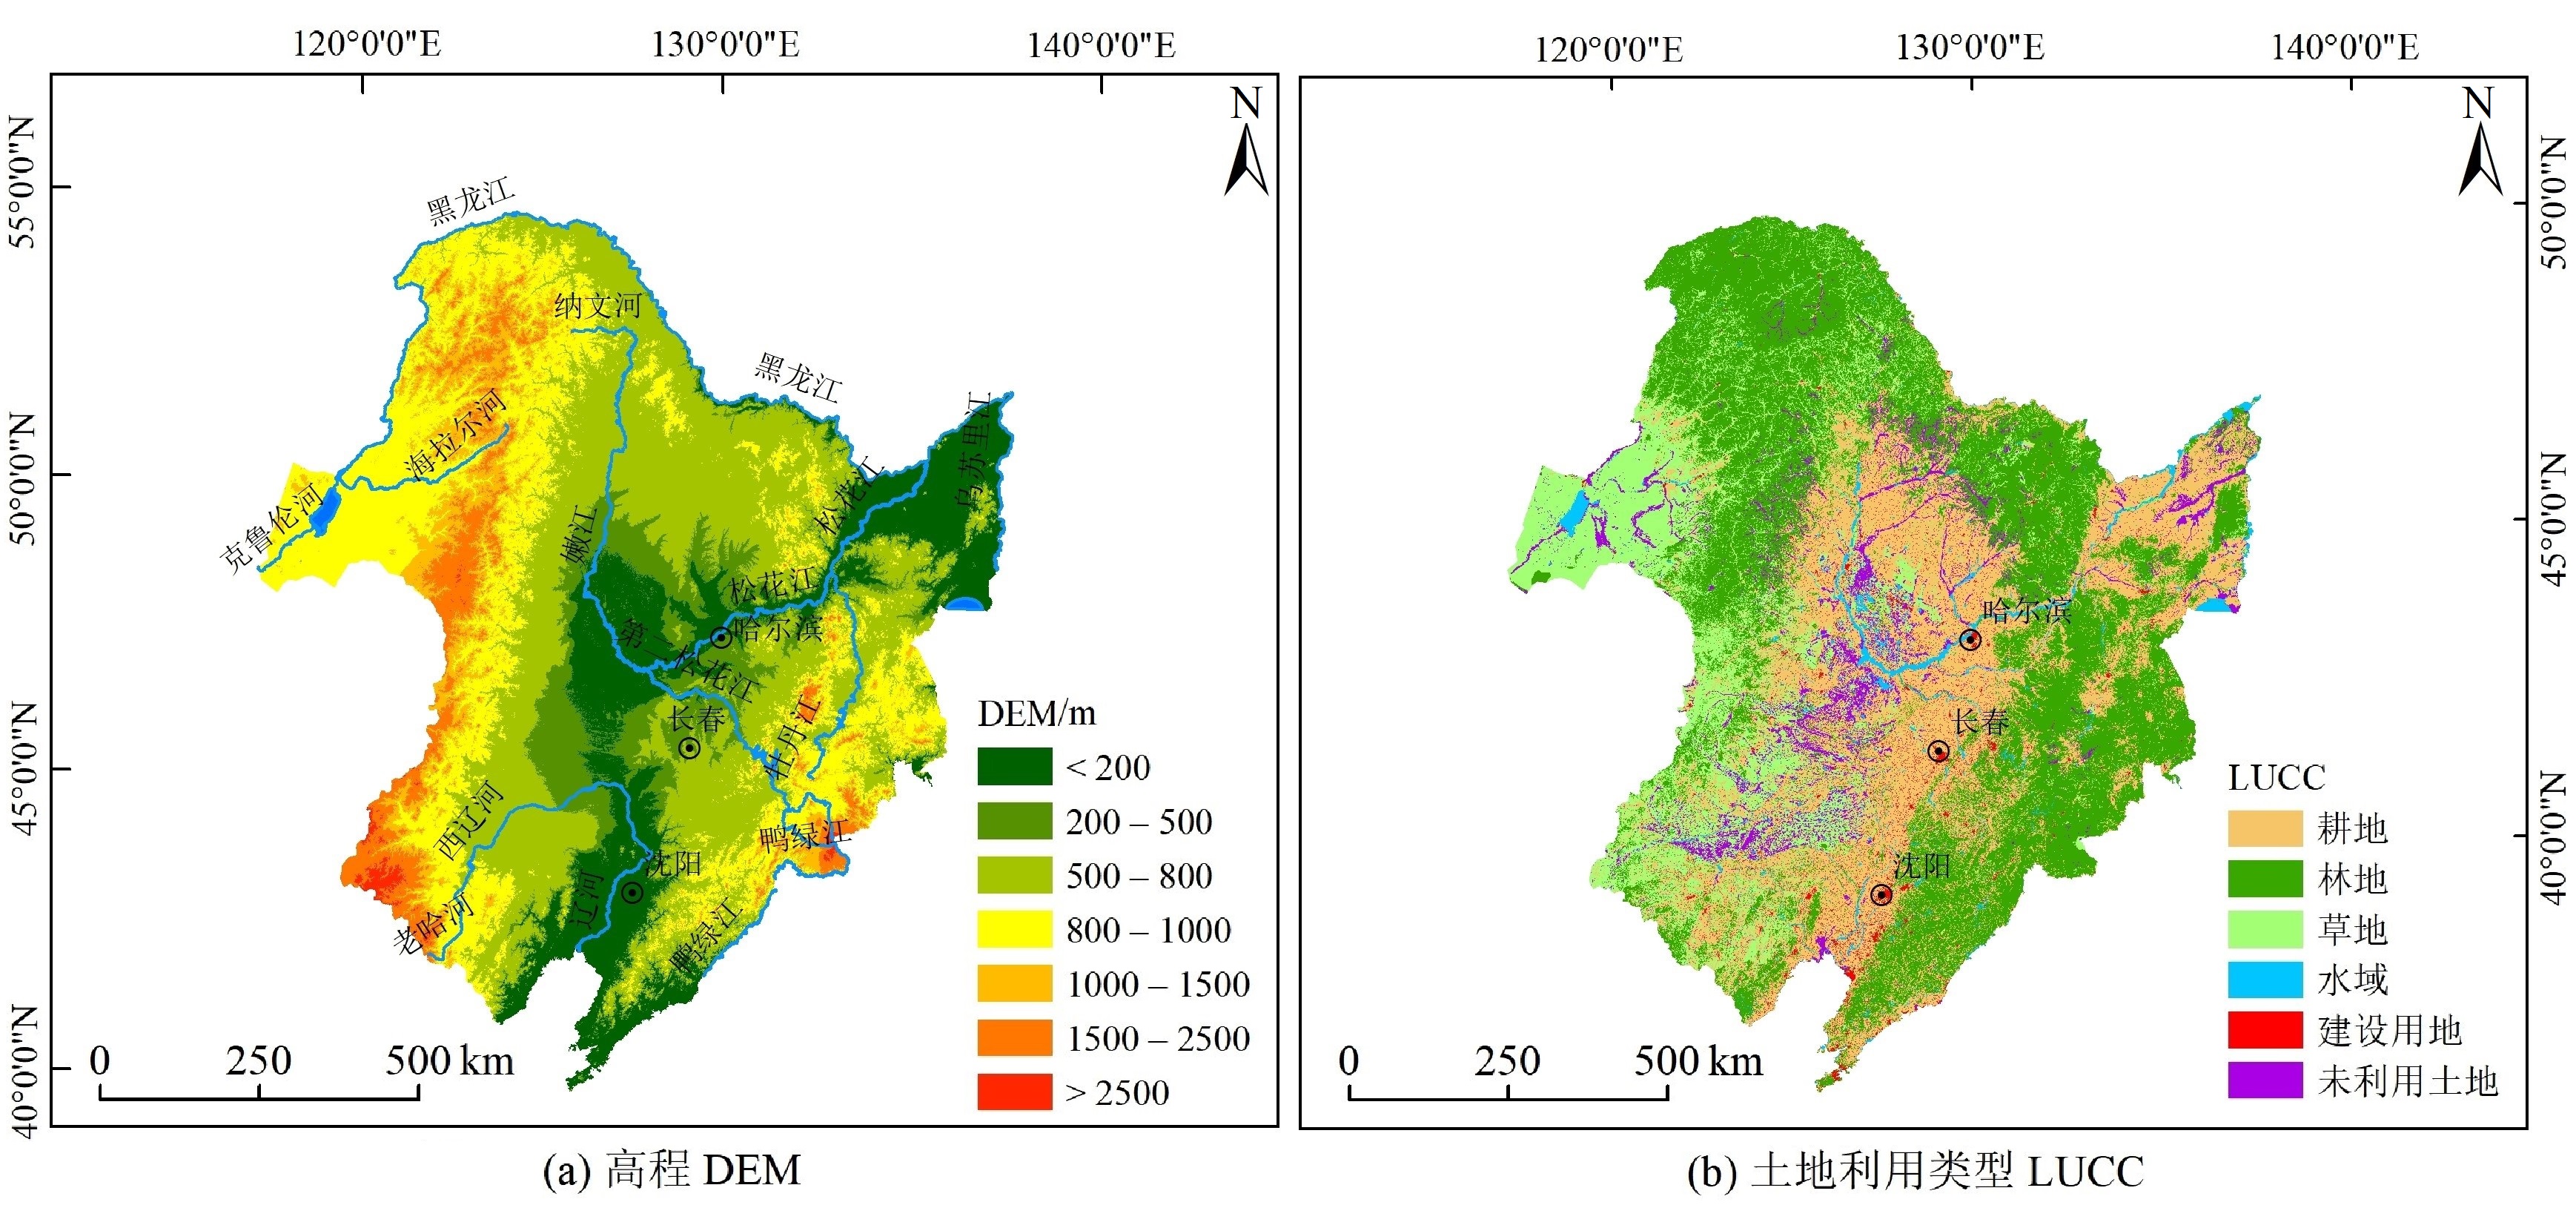
图1 松辽流域地理位置图
Figure 1 Location of Songliao River Basin
| 数据类型 | 等级 | 描述 | S | |Z| |
|---|---|---|---|---|
| NDVI/SPEI/ 降水/气温 | 1 | 极显著提升/极显著 湿润化/极显著上升 | >0 | [2.58, ∞) |
| 2 | 显著提升/显著 湿润化/显著上升 | [1.96, 2.58) | ||
| 3 | 弱显著提升/弱显著 湿润化/弱显著上升 | [1.64, 1.96) | ||
| 4 | 不显著提升/不显著 湿润化/不显著上升 | [0, 1.64) | ||
| 5 | 极显著退化/极显著 干旱化/极显著下降 | <0 | [2.58, ∞) | |
| 6 | 显著退化/显著 干旱化/显著下降 | [1.96, 2.58) | ||
| 7 | 弱显著退化/弱显著 干旱化/弱显著下降 | [1.64, 1.96) | ||
| 8 | 不显著退化/不显著 干旱化/不显著下降 | [0, 1.64) | ||
| 9 | 无变化 | =0 | — |
表1 NDVI/SPEI/降水/气温变化趋势的分类标准
Table 1 Classification of NDVI/SPEI/Precipitation/Air temperature trend
| 数据类型 | 等级 | 描述 | S | |Z| |
|---|---|---|---|---|
| NDVI/SPEI/ 降水/气温 | 1 | 极显著提升/极显著 湿润化/极显著上升 | >0 | [2.58, ∞) |
| 2 | 显著提升/显著 湿润化/显著上升 | [1.96, 2.58) | ||
| 3 | 弱显著提升/弱显著 湿润化/弱显著上升 | [1.64, 1.96) | ||
| 4 | 不显著提升/不显著 湿润化/不显著上升 | [0, 1.64) | ||
| 5 | 极显著退化/极显著 干旱化/极显著下降 | <0 | [2.58, ∞) | |
| 6 | 显著退化/显著 干旱化/显著下降 | [1.96, 2.58) | ||
| 7 | 弱显著退化/弱显著 干旱化/弱显著下降 | [1.64, 1.96) | ||
| 8 | 不显著退化/不显著 干旱化/不显著下降 | [0, 1.64) | ||
| 9 | 无变化 | =0 | — |
| KH | KE | KF | 贡献率/% | |
|---|---|---|---|---|
| 气候变化 | 人类活动 | |||
| >0 | <0 | >0 | 0 | 100 |
| >0 | <0 | 100 | 0 | |
| >0 | >0 | |||
| <0 | <0 | >0 | 100 | 0 |
| >0 | <0 | 0 | 100 | |
| <0 | <0 | |||
表2 植被NDVI变化的驱动因素判定标准及贡献率计算方法
Table 2 Identification criterion and contribution calculation of the drivers of NDVI change
| KH | KE | KF | 贡献率/% | |
|---|---|---|---|---|
| 气候变化 | 人类活动 | |||
| >0 | <0 | >0 | 0 | 100 |
| >0 | <0 | 100 | 0 | |
| >0 | >0 | |||
| <0 | <0 | >0 | 100 | 0 |
| >0 | <0 | 0 | 100 | |
| <0 | <0 | |||

图2 松辽流域1998—2018年NDVI/SPEI/降水/气温年际变化
Figure 2 Interannual variation of NDVI/SPEI/Precipitation/Air temperature in Songliao River Basin from 1998 to 2018

图3 松辽流域1998—2018年NDVI/SPEI/降水/气温变化趋势及显著性空间分布
Figure 3 Spatial distribution of change trend and significance of NDVI/SPEI/Precipitation/Air temperature in Songliao River Basin from 1998 to 2018

图4 1998—2018年植被NDVI预测值和实测值变化速率的空间分布
Figure 4 Spatial distribution of NDVI predicted value and measured value change rate from 1998 to 2018
| 类别 | 极显著改善 | 显著改善 | 弱显著改善 | 不显著改善 | 极显著退化 | 显著退化 | 弱显著退化 | 不显著退化 |
|---|---|---|---|---|---|---|---|---|
| 气候变化 | 3.77 | 10.57 | 10.25 | 57.97 | 0.07 | 0.51 | 0.72 | 16.15 |
| 人类活动 | 62.84 | 13.13 | 4.03 | 13.63 | 0.69 | 0.56 | 0.35 | 4.76 |
表3 不同显著性区域面积占比
Table 3 Percentage of area in different significance zones %
| 类别 | 极显著改善 | 显著改善 | 弱显著改善 | 不显著改善 | 极显著退化 | 显著退化 | 弱显著退化 | 不显著退化 |
|---|---|---|---|---|---|---|---|---|
| 气候变化 | 3.77 | 10.57 | 10.25 | 57.97 | 0.07 | 0.51 | 0.72 | 16.15 |
| 人类活动 | 62.84 | 13.13 | 4.03 | 13.63 | 0.69 | 0.56 | 0.35 | 4.76 |

图5 气候变化和人类活动对松辽流域植被变化的贡献率空间分布
Figure 5 Spatial distribution of contribution rates of climate change and human activities to vegetation change in Songliao River Basin
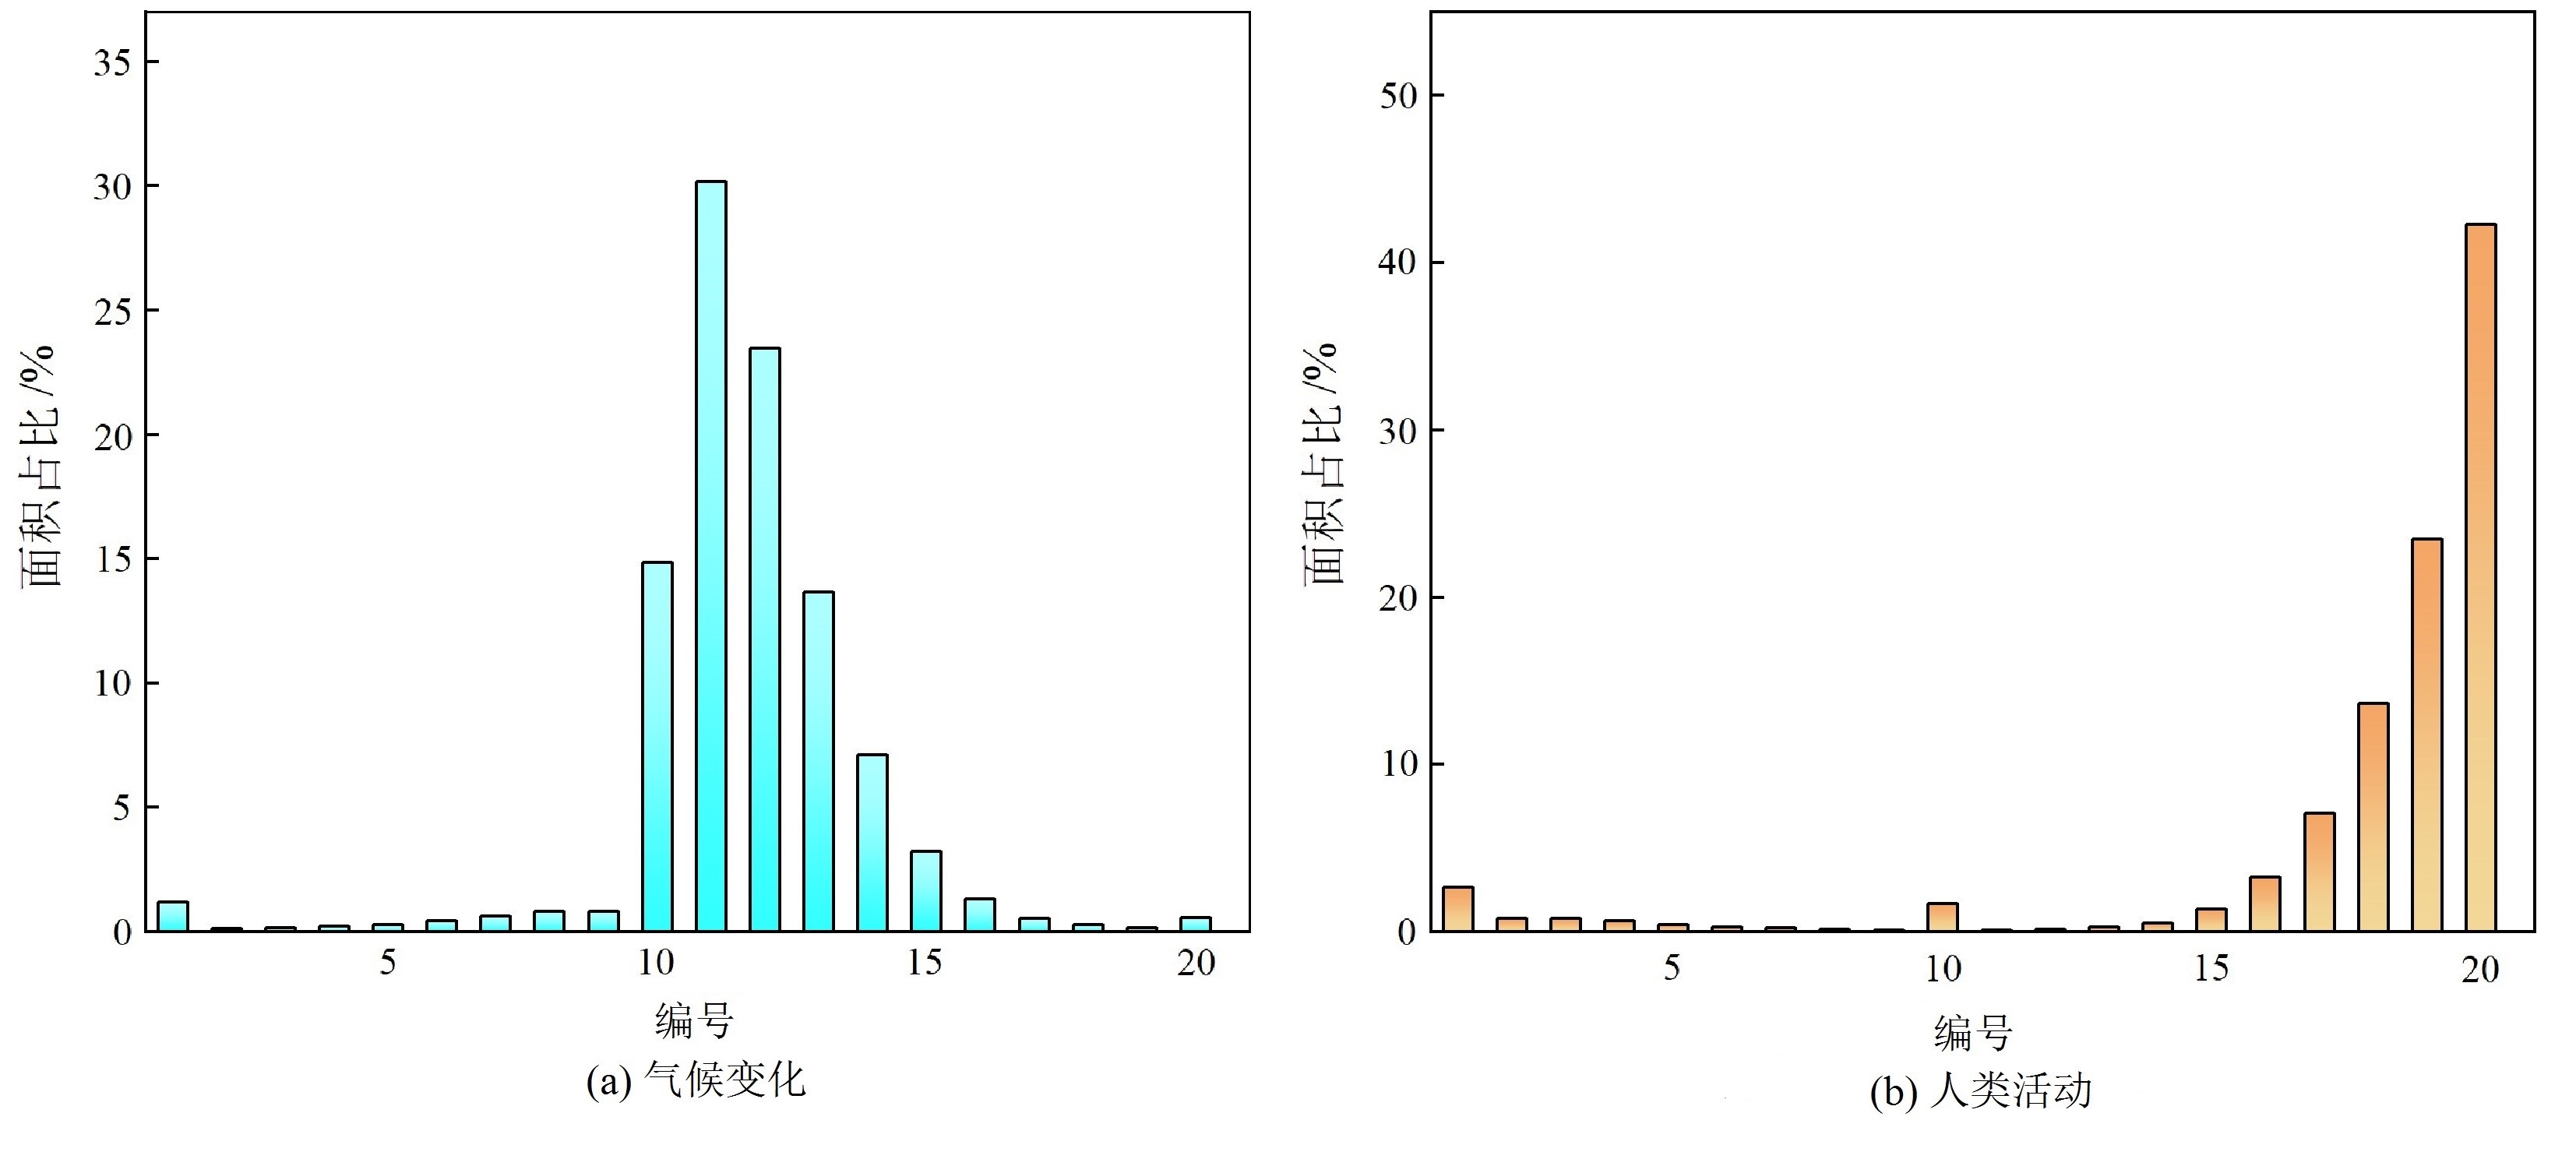
图6 1998—2018年气候变化和人类活动贡献率分级面积统计 图中横轴的编号1—20分别代表贡献率-100%— -90%、-90%— -80%、……、90%—100%
Figure 6 Graded area statistics on the contribution rates of climate change and human activities from 1998 to 2018
| 类别 | 驱动因素 | 耕地 | 林地 | 草地 | 未利用土地 |
|---|---|---|---|---|---|
| 植被改善区 | 气候变化 | 17.31 | 12.55 | 24.31 | 18.08 |
| 人类活动 | 82.69 | 87.45 | 75.69 | 81.92 | |
| 植被退化区 | 气候变化 | 25.67 | 24.2 | 19.08 | 22.09 |
| 人类活动 | 74.33 | 75.8 | 80.92 | 77.91 |
表4 不同LUCC类型下气候变化和人类活动对松辽流域植被变化的贡献率
Table 4 Contribution rate of climate change and human activities to vegetation change in Songliao River Basin under different LUCC types %
| 类别 | 驱动因素 | 耕地 | 林地 | 草地 | 未利用土地 |
|---|---|---|---|---|---|
| 植被改善区 | 气候变化 | 17.31 | 12.55 | 24.31 | 18.08 |
| 人类活动 | 82.69 | 87.45 | 75.69 | 81.92 | |
| 植被退化区 | 气候变化 | 25.67 | 24.2 | 19.08 | 22.09 |
| 人类活动 | 74.33 | 75.8 | 80.92 | 77.91 |
| 2005年 | 2018年 | ||||||
|---|---|---|---|---|---|---|---|
| 草地 | 耕地 | 建设用地 | 林地 | 水体 | 未利用土地 | 转出合计 | |
| 草地 | 110033 | 30690 | 2579 | 52927 | 2245 | 34554 | 233028 |
| 耕地 | 21897 | 271762 | 20700 | 41557 | 5297 | 12441 | 373654 |
| 建设用地 | 1640 | 16376 | 8604 | 2484 | 770 | 716 | 30590 |
| 林地 | 24328 | 44137 | 3184 | 392475 | 2755 | 29408 | 496287 |
| 水域 | 1543 | 6522 | 733 | 2008 | 11762 | 5672 | 28240 |
| 未利用土地 | 11379 | 15684 | 1101 | 6471 | 2237 | 29869 | 66741 |
表5 2005—2018年LUCC类型转移矩阵
Table 5 LUCC transfer matrix from 2005 to 2018 km2
| 2005年 | 2018年 | ||||||
|---|---|---|---|---|---|---|---|
| 草地 | 耕地 | 建设用地 | 林地 | 水体 | 未利用土地 | 转出合计 | |
| 草地 | 110033 | 30690 | 2579 | 52927 | 2245 | 34554 | 233028 |
| 耕地 | 21897 | 271762 | 20700 | 41557 | 5297 | 12441 | 373654 |
| 建设用地 | 1640 | 16376 | 8604 | 2484 | 770 | 716 | 30590 |
| 林地 | 24328 | 44137 | 3184 | 392475 | 2755 | 29408 | 496287 |
| 水域 | 1543 | 6522 | 733 | 2008 | 11762 | 5672 | 28240 |
| 未利用土地 | 11379 | 15684 | 1101 | 6471 | 2237 | 29869 | 66741 |
| [1] |
BAI X, ZHANG L H, HE C S, et al., 2020. Estimating regional soil moisture distribution based on NDVI and land surface temperature time series data in the upstream of the Heihe River Watershed, northwest China[J]. Remote Sensing, 12(15): 2414.
DOI URL |
| [2] |
CAO S P, ZHANG L F, HE Y, et al., 2022. Effects and contributions of meteorological drought on agricultural drought under different climatic zones and vegetation types in Northwest China[J]. Science of The Total Environment, 821: 153270.
DOI URL |
| [3] |
EVANS J G R, 2004. Discrimination between climate and human-induced dryland degradation[J]. Journal of arid environments, 57(4): 535-554.
DOI URL |
| [4] | LI C, LI X M, 2021. Characteristics of Spatiotemporal Variation of Ecological Quality for Vegetation in China from 2000-2018[J]. Resources and Environment in the Yangtze Basin, 30(9): 2154-2165. |
| [5] |
LIU B, XU M, HENDERSON M, et al., 2004. Taking China’s temperature: Daily range, warming trends, and regional variations, 1955-2000[J]. Journal of Climate, 17(22): 4453-4462.
DOI URL |
| [6] |
MA Y J, ZUO L Y, GAO B J, et al., 2021. The karst NDVI correlation with climate and its BAS-BP prediction based on multiple factors[J]. Ecological Indicators, 132: 108254.
DOI URL |
| [7] | NING T T, LIU W Z, LIN W, et al., 2015. NDVI variation and its responses to climate change on the northern Loess Plateau of China from 1998 to 2012[J]. Advances in Meteorology, 2015: 725427. |
| [8] |
PEI F S, ZHOU Y, XIA Y, 2021. Application of normalized difference vegetation index (NDVI) for the detection of extreme precipitation change[J]. Forests, 12(5): 594.
DOI URL |
| [9] |
QI G Z, BAI H Y, ZHAO T, et al., 2021. Sensitivity and areal differentiation of vegetation responses to hydrothermal dynamics on the northern and southern slopes of the Qinling Mountains in Shaanxi province[J]. Journal of Geographical Sciences, 31(6): 785-801.
DOI |
| [10] |
WANG H, LIU G H, LI Z S, et al., 2018. Impacts of drought and human activity on vegetation growth in the grain for green program region, China[J]. Chinese Geographical Science, 28(3): 470-481.
DOI |
| [11] |
WESSELS K J, PRINCE S D, MALHERBE J, et al., 2007. Can human-induced land degradation be distinguished from the effects of rainfall variability? A case study in South Africa[J]. Journal of Arid Environments, 68(2): 271-297.
DOI URL |
| [12] |
YANG L Q, GUAN Q Y, LIN J K, et al., 2021. Evolution of NDVI secular trends and responses to climate change: A perspective from nonlinearity and nonstationarity characteristics[J]. Remote Sensing of Environment, 254: 112247.
DOI URL |
| [13] | ZHANG B W, CUI L L, SHI J, et al., 2017. Vegetation dynamics and their response to climatic variability in China[J]. Advances in Meteorology, 2017: 8282353. |
| [14] |
陈文裕, 夏丽华, 徐国良, 等, 2022. 2000—2020年珠江流域NDVI动态变化及影响因素研究[J]. 生态环境学报, 31(7): 1306-1316.
DOI URL |
| CHEN W Y, XIA L H, XU G L, et al., 2022. Dynamic variation of NDVI and its influencing factors in the Pearl River Basin from 2000 to 2020[J]. Ecology and Environmental Sciences, 31(7): 1306-1316. | |
| [15] |
付乐, 迟妍妍, 于洋, 等, 2022. 2000—2020年黄河流域土地利用变化特征及影响因素分析[J]. 生态环境学报, 31(10): 1927-1938.
DOI URL |
| FU L, CHI Y Y, YU Y, et al., 2022. Characteristics and driving forces of land use change in the Yellow River Basin from 2000 to 2020[J]. Ecology and Environmental Sciences, 31(10): 1927-1938. | |
| [16] | 盖兆雪, 孙萍, 张景奇, 2019. 松花江流域土地利用变化及形成机理——以哈尔滨段为例[J]. 水土保持研究, 26(4): 314-320. |
| GAI Z X, SUN P, ZHANG J Q, 2019. Land use change and formation mechanism in Songhuajiang Basin-Harbin section as an example[J]. Research of soil and Water Conservation, 26(4): 314-320. | |
| [17] |
高江波, 焦珂伟, 吴绍洪, 2019. 1982—2013年中国植被NDVI空间异质性的气候影响分析[J]. 地理学报, 74(3): 534-543.
DOI |
| GAO J B, JIAO K W, WU S H, 2019. Revealing the climatic on spatial heterogeneity of NDVI in China during 1982-2013[J]. Acta Geographica Sinica, 74(3): 534-543. | |
| [18] | 耿庆玲, 陈晓青, 赫晓慧, 等, 2022. 中国不同植被类型归一化植被指数对气候变化和人类活动的响应[J]. 生态学报, 42(9): 3557-3568. |
| GENG Q L, CHEN X Q, HE X H, et al., 2022. Vegetation dynamics and its response to climate change and human activities based on different vegetation types in China[J]. Acta Ecologica Sinica, 42(9): 3557-3568. | |
| [19] | 何航, 张勃, 侯启, 等, 2020. 1982—2015年中国北方归一化植被指数 (NDVI) 变化特征及对气候变化的响应[J]. 生态与农村环境学报, 36(1): 70-80. |
| HE H, ZHANG B, HOU Q, et al., 2020. Variation characteristic of NDVI and its response to climate change in northern China from 1982 to 2015[J]. Journal of Ecology and Rural Environment, 36(1): 70-80. | |
| [20] | 李继红, 焦裕欣, 2021. 东北地区归一化植被指数与环境因子间的尺度依存关系[J]. 东北林业大学学报, 49(2): 70-77. |
| LI J H, JIAO Y Q, 2021. Dependence between NDVI and environmental factors in northeast China[J]. Journal of Northeast Forestry University, 49(2): 70-77. | |
| [21] | 李原园, 2014. 中国水资源及其开发利用调查评价[M]. 北京: 中国水利水电出版社:27-28. |
| LI Y Y, 2014. Survey and evaluation of water resources and their development and utilization in China[M]. Beijing: China Water Conservancy and Hydropower Press:27-28. | |
| [22] | 梁守真, 隋学艳, 王猛, 等, 2022. 基于SPEI的黄河流域多时间尺度干湿变化分析[J]. 水土保持研究, 29(1): 231-241. |
| LIANG S Z, SUI X Y, WANG M, et al., 2022. Multiple time scales analysis of dryness changes of the Yellow River basin in the past 50 years based on SPEI data[J]. Research of soil and Water Conservation, 29(1): 231-241. | |
| [23] |
刘纪远, 宁佳, 匡文慧, 等, 2018. 2010—2015年中国土地利用变化的时空格局与新特征[J]. 地理学报, 73(5): 789-802.
DOI |
| LIU J Y, NING J, KUANG W H, et al., 2018. Spatiotemporal patterns and characteristics of land-use change in China during 2010-2015[J]. Acta Geographica Sinica, 73(5): 789-802. | |
| [24] | 刘杨奕, 毛文静, 李思琦, 等, 2022. 中国西北地区气象干旱时空演变特征[J]. 水资源与水工程学报, 33(1): 86-92. |
| LIU Y Y, MAO W J, LI S Q, et al., 2022. Spatiotemporal evolution characteristics of meteorological droughts in northwest China[J]. Journal of Water Resources and Water Engineering, 33(1): 86-92. | |
| [25] | 刘宇, 李雯晴, 刘招, 等, 2021. 基于SPEI渭北黄土台塬区干旱时空演变特征[J]. 水土保持研究, 28(1): 109-117. |
| LIU Y, LI W Q, LIU Z, et al., 2021. Spatial and Temporal Evolution Characteristics of the Drought in Weibei Loess Tableland Area Based on SPEI[J]. Research of soil and Water Conservation, 28(1): 109-117. | |
| [26] | 罗爽, 刘会玉, 龚海波, 2022. 1982—2018年中国植被覆盖变化非线性趋势及其格局分析[J]. 生态学报, 42(20): 8331-8342. |
| LUO S, LIU H Y, GONG H B, 2022. Nonlinear trends and spatial pattern analysis of vegetation cover change in China from 1998 to 2018[J]. Acta Ecologica Sinica, 42(20): 8331-8342. | |
| [27] |
秦大河, 2014. 气候变化科学与人类可持续发展[J]. 地理科学进展, 33(7): 874-883.
DOI |
|
QIN D H, 2014. Climate change science and sustainable development[J]. Progress in Geography, 33(7): 874-883.
DOI |
|
| [28] |
阮惠华, 许剑辉, 张菲菲, 2022. 2001—2020年粤港澳大湾区植被和地表温度时空变化研究[J]. 生态环境学报, 31(8): 1510-1520.
DOI URL |
| RUAN H H, XU J H, ZHANG F F, 2022. Spatiotemporal changes of vegetation and land surface temperature during 2001 and 2020 in the Guangdong-Hong Kong-Macao Greater Bay Area of China[J]. Ecology and Environmental Sciences, 31(8): 1510-1520. | |
| [29] | 涂又, 姜亮亮, 刘睿, 等, 2021. 1982—2015年中国植被NDVI时空变化特征及其驱动分析[J]. 农业工程学报, 37(22): 75-84. |
| TU Y, JIANG L L, LIU R, et al., 2021. Spatiotemporal changes of vegetation NDVI and its driving forces in China during 1982-2015[J]. Transactions of the Chinese Society of Agricultural Engineering, 37(22): 75-84. | |
| [30] | 王鸽, 韩琳, 张昱, 2012. 东北地区地表NDVI的时空变化规律[J]. 北京林业大学学报, 34(6): 86-91. |
| WANG G, HAN L, ZHANG Y, 2012. Temporal variation and spatial distribution of NDVI in northeastern China[J]. Journal of Beijing Forestry University, 34(6): 86-91. | |
| [31] | 王兆礼, 黄泽勤, 李军, 等, 2016. 基于SPEI和NDVI的中国流域尺度气象干旱及植被分布时空演变[J]. 农业工程学报, 32(14): 177-186. |
| WANG Z L, HUANG Z Q, LI J, et al., 2016. Assessing impacts of meteorological drought on vegetation at catchment scale in China based on SPEI and NDVI[J]. Transactions of the Chinese Society of Agricultural Engineering, 32(14): 177-186. | |
| [32] | 袭祝香, 杨雪艳, 刘玉汐, 等, 2019. 松辽流域1961—2017年极端降水变化特征[J]. 水土保持研究, 26(3): 199-203, 212. |
| XI Z X, YANG X Y, LIU Y X, et al., 2019. Characteristics of extreme precipitation change from 1961 to 2017 in Songliao Basin[J]. Research of soil and Water Conservation, 26(3): 199-203, 212. | |
| [33] | 张华, 李明, 宋金岳, 等, 2021. 基于地理探测器的祁连山国家公园植被NDVI变化驱动因素分析[J]. 生态学杂志, 40(8): 2530-2540. |
| ZHANG H, LI M, SONG J Y, et al., 2021. Analysis of driving factors of vegetation NDVI change in Qilian Mountain National Park based on geographic detector[J]. Chinese Journal of Ecology, 40(8): 2530-2540. | |
| [34] |
张雄一, 邵全琴, 宁佳, 等, 2022. 三北工程区植被恢复对土壤风蚀的影响及植被恢复潜力研究[J]. 地球信息科学学报, 24(11): 2153-2170.
DOI |
| ZHANG X Y, SHAO Q X, NING J, et al., 2022. Effect of Vegetation Restoration on Soil Wind Erosion and Vegetation Restoration Potential in The Three-North Afforestation Program[J]. Journal of Geo-information Science, 24(11): 2153-2170. |
| [1] | 郝蕾, 翟涌光, 戚文超, 兰穹穹. 2001-2020年内蒙古植被碳源/碳汇时空动态及对气候因子的响应[J]. 生态环境学报, 2023, 32(5): 825-834. |
| [2] | 巫晨煜, 许帆帆, 魏士博, 樊晶晶, 刘观鹏, 王坤. 渭河流域地表植被覆盖对气候变化的响应研究[J]. 生态环境学报, 2023, 32(5): 835-844. |
| [3] | 陈俊芳, 吴宪, 刘啸林, 刘娟, 杨佳绒, 刘宇. 不同土壤水分下元素化学计量对微生物多样性的塑造特征[J]. 生态环境学报, 2023, 32(5): 898-909. |
| [4] | 李晖, 李必龙, 葛黎黎, 韩琛惠, 杨倩, 张岳军. 2000-2021年汾河流域植被时空演变特征及地形效应[J]. 生态环境学报, 2023, 32(3): 439-449. |
| [5] | 张鐥文, 杨冉, 侯文星, 王丽丽, 刘爽, 宋汉扬, 赵文吉, 李令军. 生态补水前后永定河两岸植被覆盖度变化及驱动力分析[J]. 生态环境学报, 2023, 32(2): 264-273. |
| [6] | 齐月, 张强, 胡淑娟, 蔡迪花, 赵福年, 陈斐, 张凯, 王鹤龄, 王润元. 黄土高原地区气候变化及其对冬小麦生产潜力的影响[J]. 生态环境学报, 2022, 31(8): 1521-1529. |
| [7] | 邓天乐, 谢立勇, 张凤哲, 赵洪亮, 蒋语童. CO2浓度升高条件下稗草与水稻生长空间竞争关系研究[J]. 生态环境学报, 2022, 31(8): 1566-1572. |
| [8] | 苏泳松, 宋松, 陈叶, 叶子强, 钟润菲, 王昭尧. 珠江三角洲人类活动净氮输入时空特征及其影响因素[J]. 生态环境学报, 2022, 31(8): 1599-1609. |
| [9] | 卢燕宇, 孙维, 方砚秋, 唐为安, 邓汗青, 何冬燕. 基于种植结构的安徽省气候生产潜力估算及粮食安全气候承载力分析[J]. 生态环境学报, 2022, 31(7): 1293-1305. |
| [10] | 陈文裕, 夏丽华, 徐国良, 余世钦, 陈行, 陈金凤. 2000—2020年珠江流域NDVI动态变化及影响因素研究[J]. 生态环境学报, 2022, 31(7): 1306-1316. |
| [11] | 孙梦鑫, 张岳, 辛宇, 钟鼎杰, 杨存建. 川西高原近20 a植被物候变化及其对气候变化的响应[J]. 生态环境学报, 2022, 31(7): 1326-1339. |
| [12] | 李登科, 王钊. 气候变化和人类活动对陕西省植被NPP影响的定量分析[J]. 生态环境学报, 2022, 31(6): 1071-1079. |
| [13] | 曹晓云, 祝存兄, 陈国茜, 孙树娇, 赵慧芳, 朱文彬, 周秉荣. 2000—2021年柴达木盆地地表绿度变化及地形分异研究[J]. 生态环境学报, 2022, 31(6): 1080-1090. |
| [14] | 高思琦, 董国涛, 蒋晓辉, 聂桐, 郭欣伟, 党素珍, 李心宇, 李昊洋. 黄河源植被覆盖度变化及空间分布自然驱动力分析[J]. 生态环境学报, 2022, 31(3): 429-439. |
| [15] | 杨媛媛, 佘志鹏, 宋进喜, 朱大为. 2000年以来浐灞河流域不同地貌区植被变化特征及影响因素研究[J]. 生态环境学报, 2022, 31(2): 224-230. |
| 阅读次数 | ||||||
|
全文 |
|
|||||
|
摘要 |
|
|||||