生态环境学报 ›› 2025, Vol. 34 ›› Issue (9): 1410-1420.DOI: 10.16258/j.cnki.1674-5906.2025.09.008
王秀玲( ), 金翠(), 王浩然, 候明璇
收稿日期:2025-03-27
出版日期:2025-09-18
发布日期:2025-09-05
通讯作者:
*E-mail: cuijin@lnnu.edu.cn
作者简介:王秀玲(1999年生),女,硕士研究生,研究方向为资源与环境遥感。E-mail: wxl68760315@163.com
基金资助:
WANG Xiuling(), JIN Cui(), WANG Haoran, HOU Mingxuan
Received:2025-03-27
Online:2025-09-18
Published:2025-09-05
摘要:
辽宁省极端气候频发,严重威胁生态系统结构和功能。植被是陆地生态系统的核心要素,探究二者的关系有助于应对气候变化以提高区域生态系统的稳定性。基于月尺度增强型植被指数(EVI)与气象日值数据,分析2000-2020年辽宁省植被与极端气候变化特征,揭示二者的相关性;采用最优参数地理探测器识别植被的主导极端气候事件。结果表明,1)21年来EVI呈显著上升趋势(0.035/10a,p<0.05),86.3%的区域植被改善,其中,辽东林地改善面积最大;城市化进程加速了局地植被退化。2)除极端低温日数外,其余极端气温指数均呈上升趋势,仅冷昼日数和日最低气温极低值变化显著(p<0.05);而极端降水指数均呈显著上升趋势(p<0.05)。3)日最高(低)气温极高(低)值和极端降水与EVI整体呈正相关;气温日较差与EVI则主要呈负相关;暖昼(夜)日数与辽中、辽东EVI呈正相关,与辽西北EVI呈负相关,冷昼(夜)日数与之相反。4)极端降水对EVI的解释力(q)大于极端气温,连续5日最大降水量是EVI空间分异的主导因素(q=0.28);日最低气温极低值与之产生交互作用时,极端降水对EVI的影响增强。研究结果可为辽宁省制定气候适应性管理措施和植被恢复策略提供参考。
中图分类号:
王秀玲, 金翠, 王浩然, 候明璇. 辽宁省植被时空变化特征及其对极端气候的响应[J]. 生态环境学报, 2025, 34(9): 1410-1420.
WANG Xiuling, JIN Cui, WANG Haoran, HOU Mingxuan. Spatial-temporal Variation Characteristics of Vegetation and Its Response to Extreme Climate in Liaoning Province[J]. Ecology and Environmental Sciences, 2025, 34(9): 1410-1420.

图1 研究区气象站点分布、高程(a)及土地利用类型(b) 底图来源于国家地理信息公共服务平台(https://cloudcenter.tianditu.gov.cn/),审图号为GS(2024)0650;底图无修改
Figure 1 Distribution of meteorological stations, elevation (a), and land use types (b) in the studied area
| 指数类型 | 指数 | 符号 | 定义 | 单位 |
|---|---|---|---|---|
| 极端气温 | 冷昼日数 | TX10P | 日最高温<10%分位值的日数 | d |
| 暖昼日数 | TX90P | 日最高温>90%分位值的日数 | d | |
| 冷夜日数 | TN10P | 日最低温<10%分位值的日数 | d | |
| 暖夜日数 | TN90P | 日最低温>90%分位值的日数 | d | |
| 日最低气温极低值 | TNn | 每月内日最低温的最小值 | ℃ | |
| 日最高气温极高值 | TXx | 每月内日最高温的最大值 | ℃ | |
| 气温日较差 | DTR | 日最高温与日最低温的差值 | ℃ | |
| 极端降水 | 单日最大降水量 | RX1day | 每月内最大1日降水量 | mm |
| 连续5日最大降水量 | RX5day | 每月内连续5日最大降水量 | mm |
表1 极端气候指数的定义
Table 1 Definition of extreme climate indices
| 指数类型 | 指数 | 符号 | 定义 | 单位 |
|---|---|---|---|---|
| 极端气温 | 冷昼日数 | TX10P | 日最高温<10%分位值的日数 | d |
| 暖昼日数 | TX90P | 日最高温>90%分位值的日数 | d | |
| 冷夜日数 | TN10P | 日最低温<10%分位值的日数 | d | |
| 暖夜日数 | TN90P | 日最低温>90%分位值的日数 | d | |
| 日最低气温极低值 | TNn | 每月内日最低温的最小值 | ℃ | |
| 日最高气温极高值 | TXx | 每月内日最高温的最大值 | ℃ | |
| 气温日较差 | DTR | 日最高温与日最低温的差值 | ℃ | |
| 极端降水 | 单日最大降水量 | RX1day | 每月内最大1日降水量 | mm |
| 连续5日最大降水量 | RX5day | 每月内连续5日最大降水量 | mm |
| 指数 | 离散方法 | 分层数 | 指数 | 离散方法 | 分层数 |
|---|---|---|---|---|---|
| TX10P | 自然断点分类法 | 9 | TNn | 等间隔分类法 | 9 |
| TN10P | 等间隔分类法 | 7 | DTR | 分位数分类法 | 8 |
| TX90P | 几何间隔分类法 | 10 | RX1day | 分位数分类法 | 10 |
| TN90P | 分位数分类法 | 9 | RX5day | 自然断点分类法 | 10 |
| TXx | 标准差分类法 | 9 |
表2 参数离散化过程
Table 2 Parameter discretization process
| 指数 | 离散方法 | 分层数 | 指数 | 离散方法 | 分层数 |
|---|---|---|---|---|---|
| TX10P | 自然断点分类法 | 9 | TNn | 等间隔分类法 | 9 |
| TN10P | 等间隔分类法 | 7 | DTR | 分位数分类法 | 8 |
| TX90P | 几何间隔分类法 | 10 | RX1day | 分位数分类法 | 10 |
| TN90P | 分位数分类法 | 9 | RX5day | 自然断点分类法 | 10 |
| TXx | 标准差分类法 | 9 |
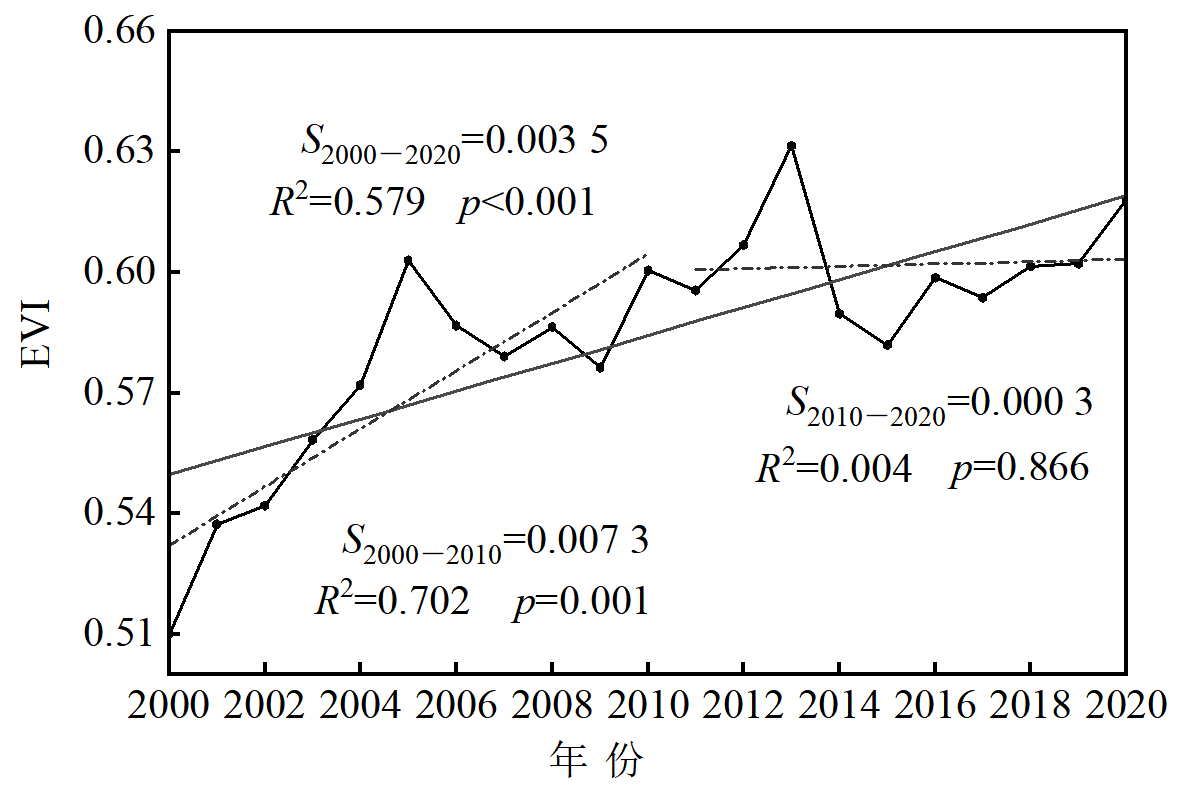
图2 2000-2020年辽宁省EVI的时间变化特征
Figure 2 Annual variation trend of EVI in Liaoning Province from 2000 to 2020

图3 各相关年份辽宁省EVI空间分布及其面积占比
Figure 3 Spatial distribution of EVI in Liaoning Province and its area proportions in each relevant year
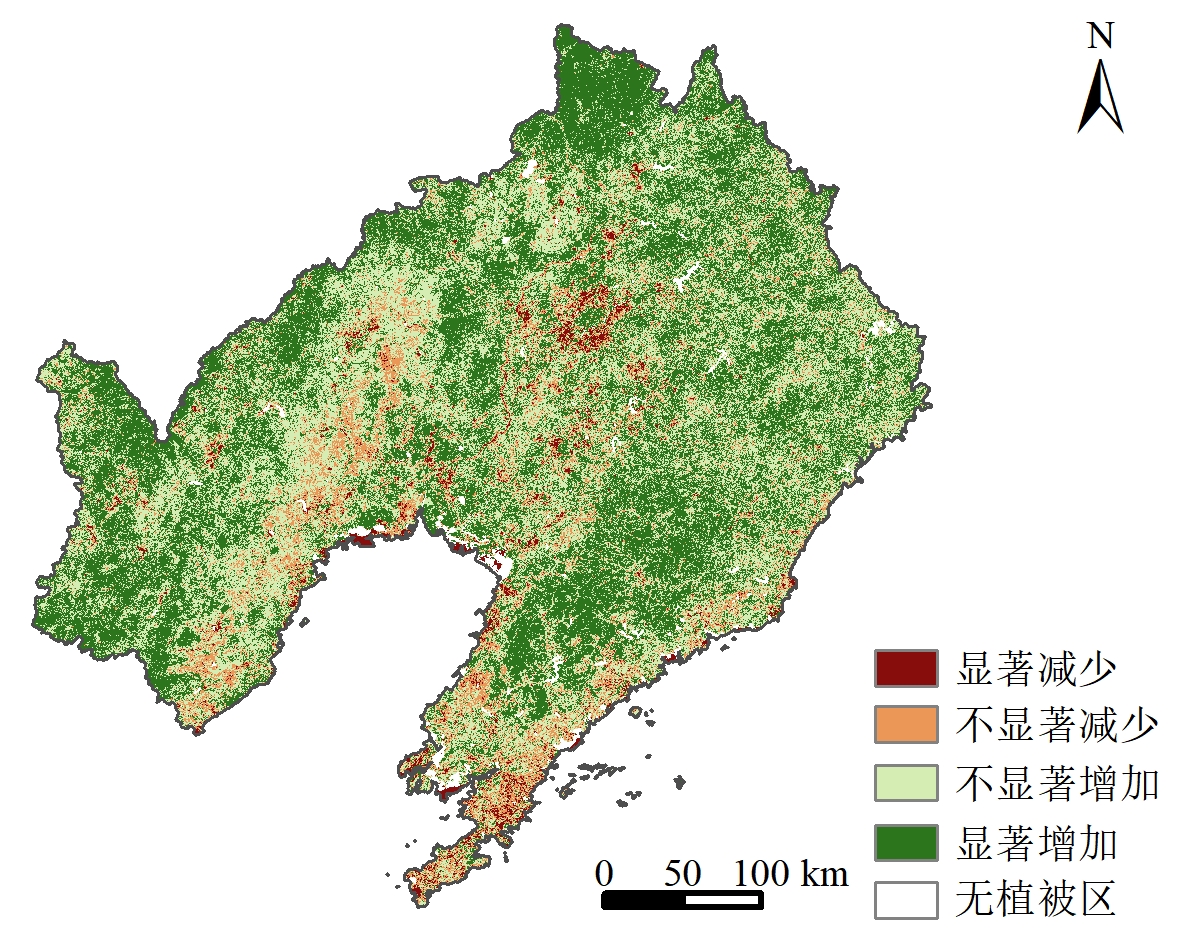
图4 2000-2020年辽宁省EVI的空间变化趋势
Figure 4 Spatial Variation Trend of EVI in Liaoning Province from 2000 to 2020
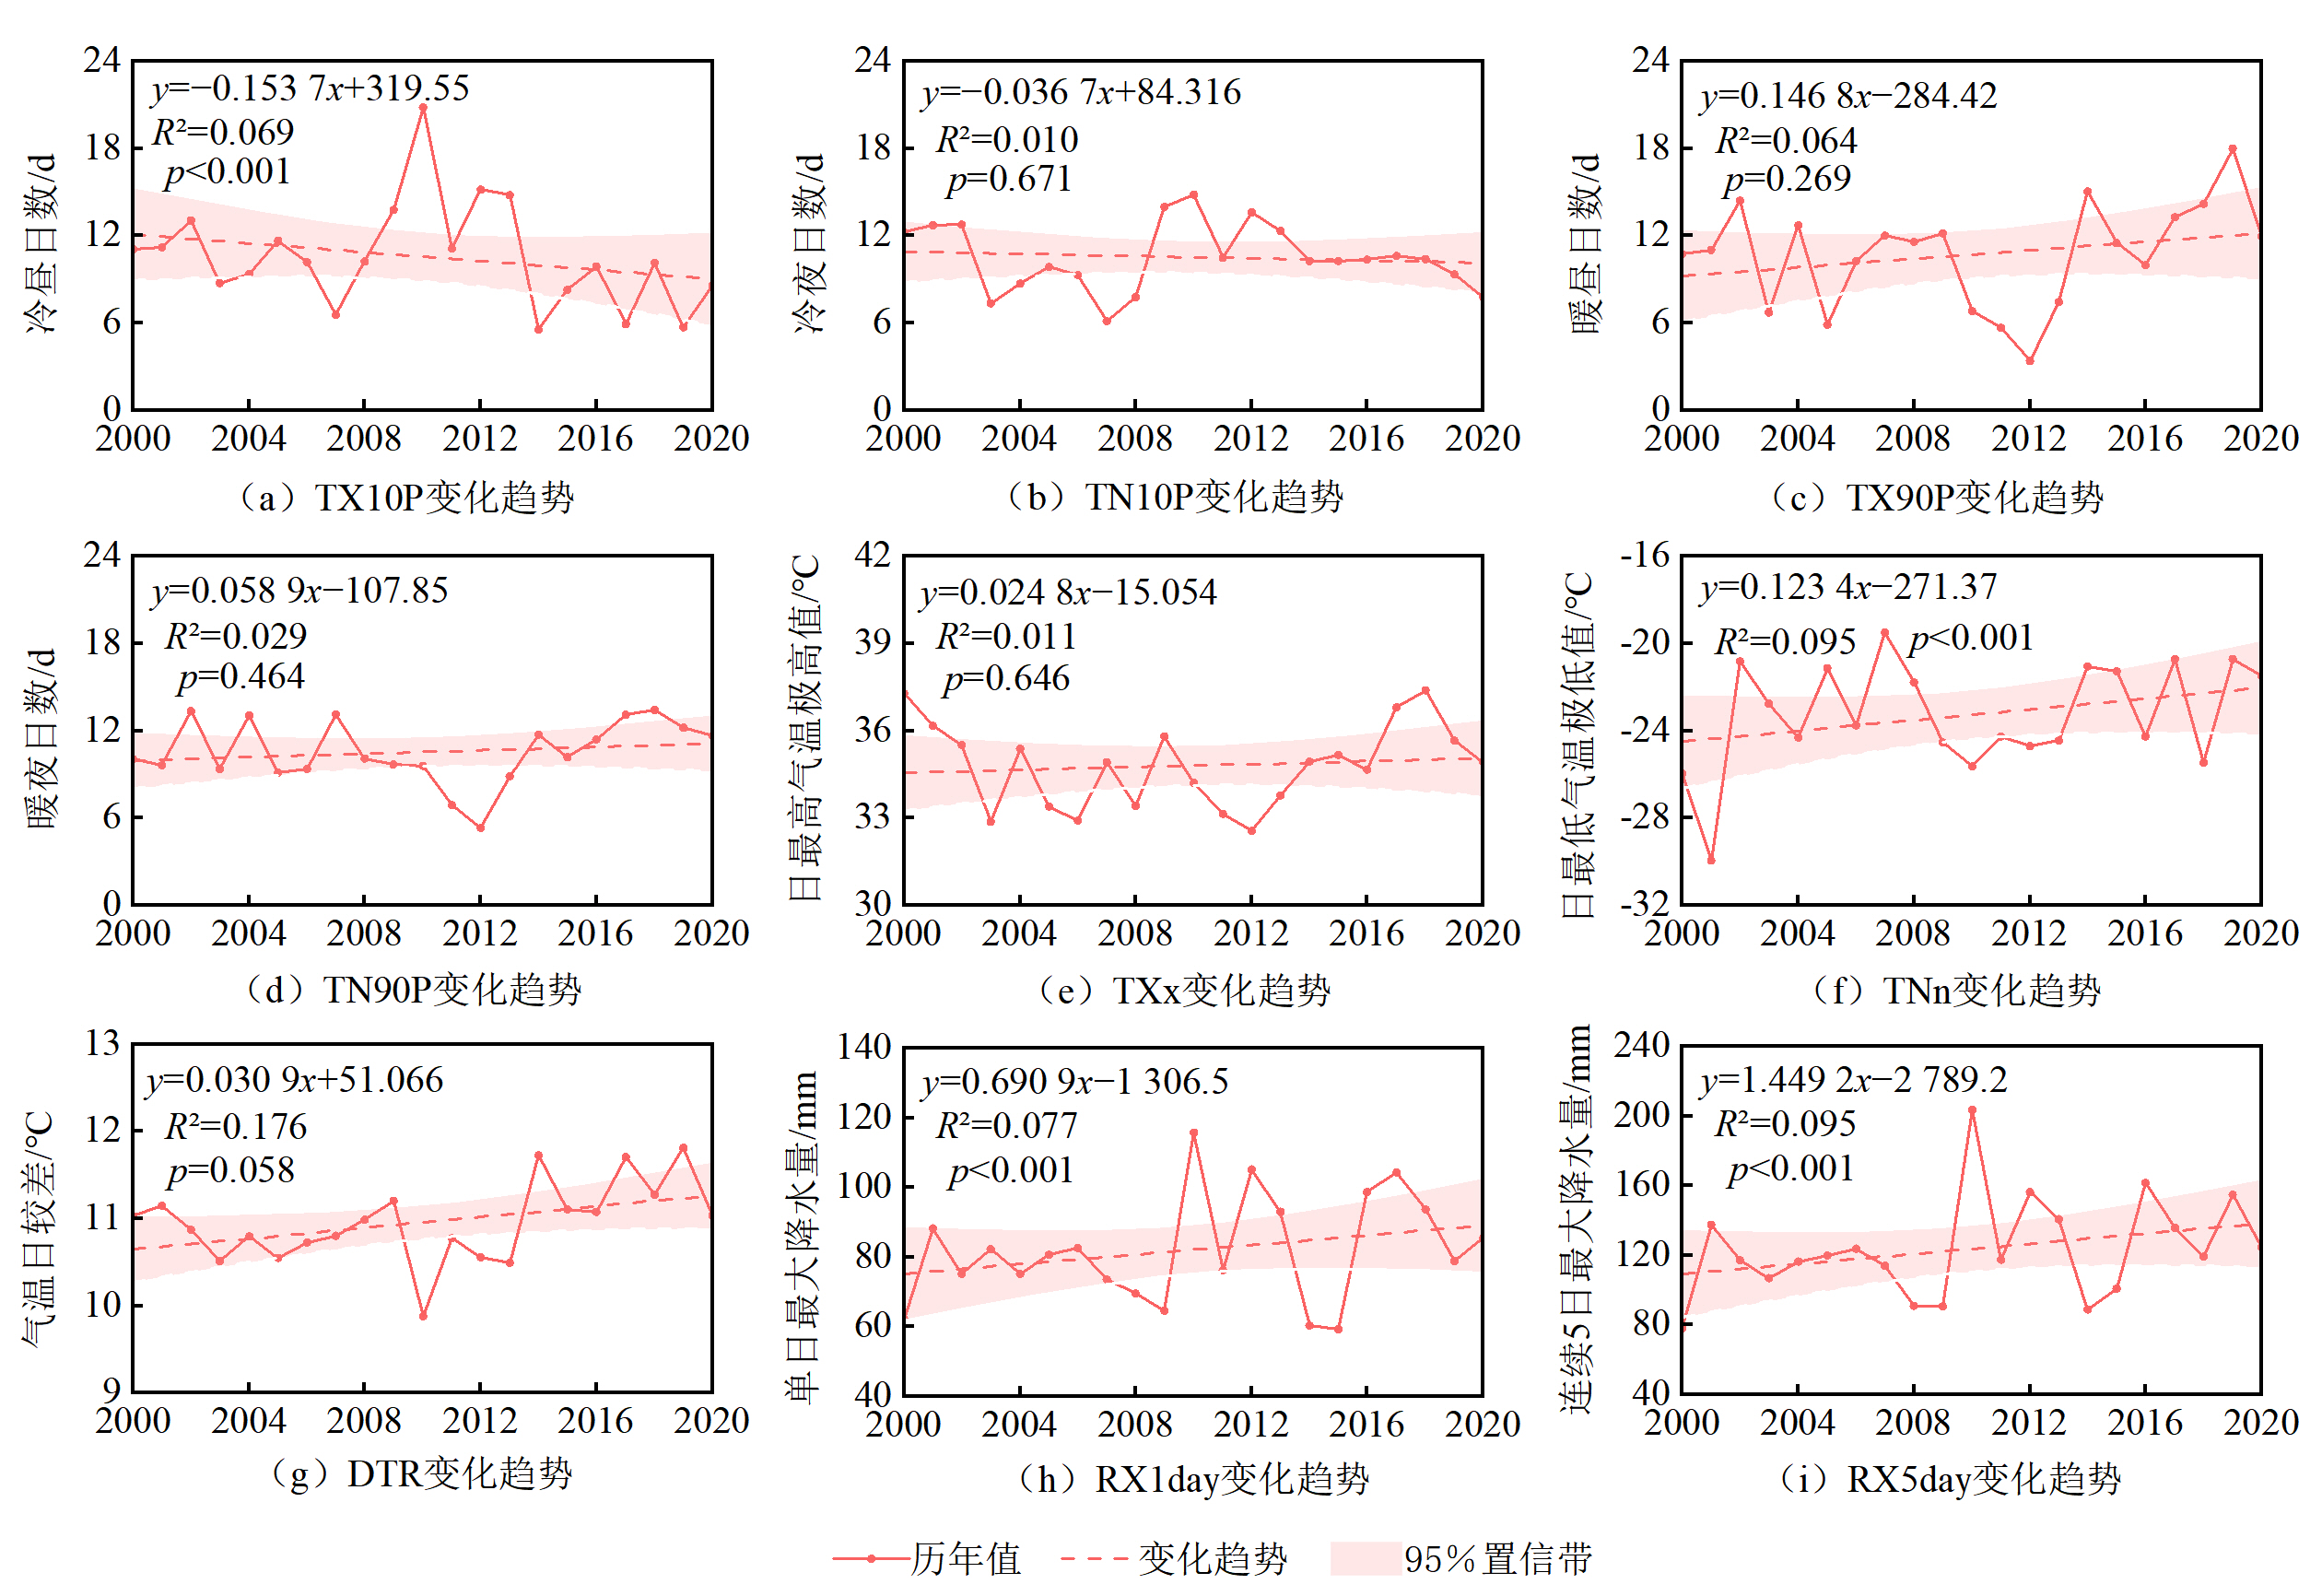
图5 2000-2020年辽宁省极端气候指数的时间变化趋势
Figure 5 Annual variation trend of extreme climate indices in Liaoning Province from 2000 to 2020
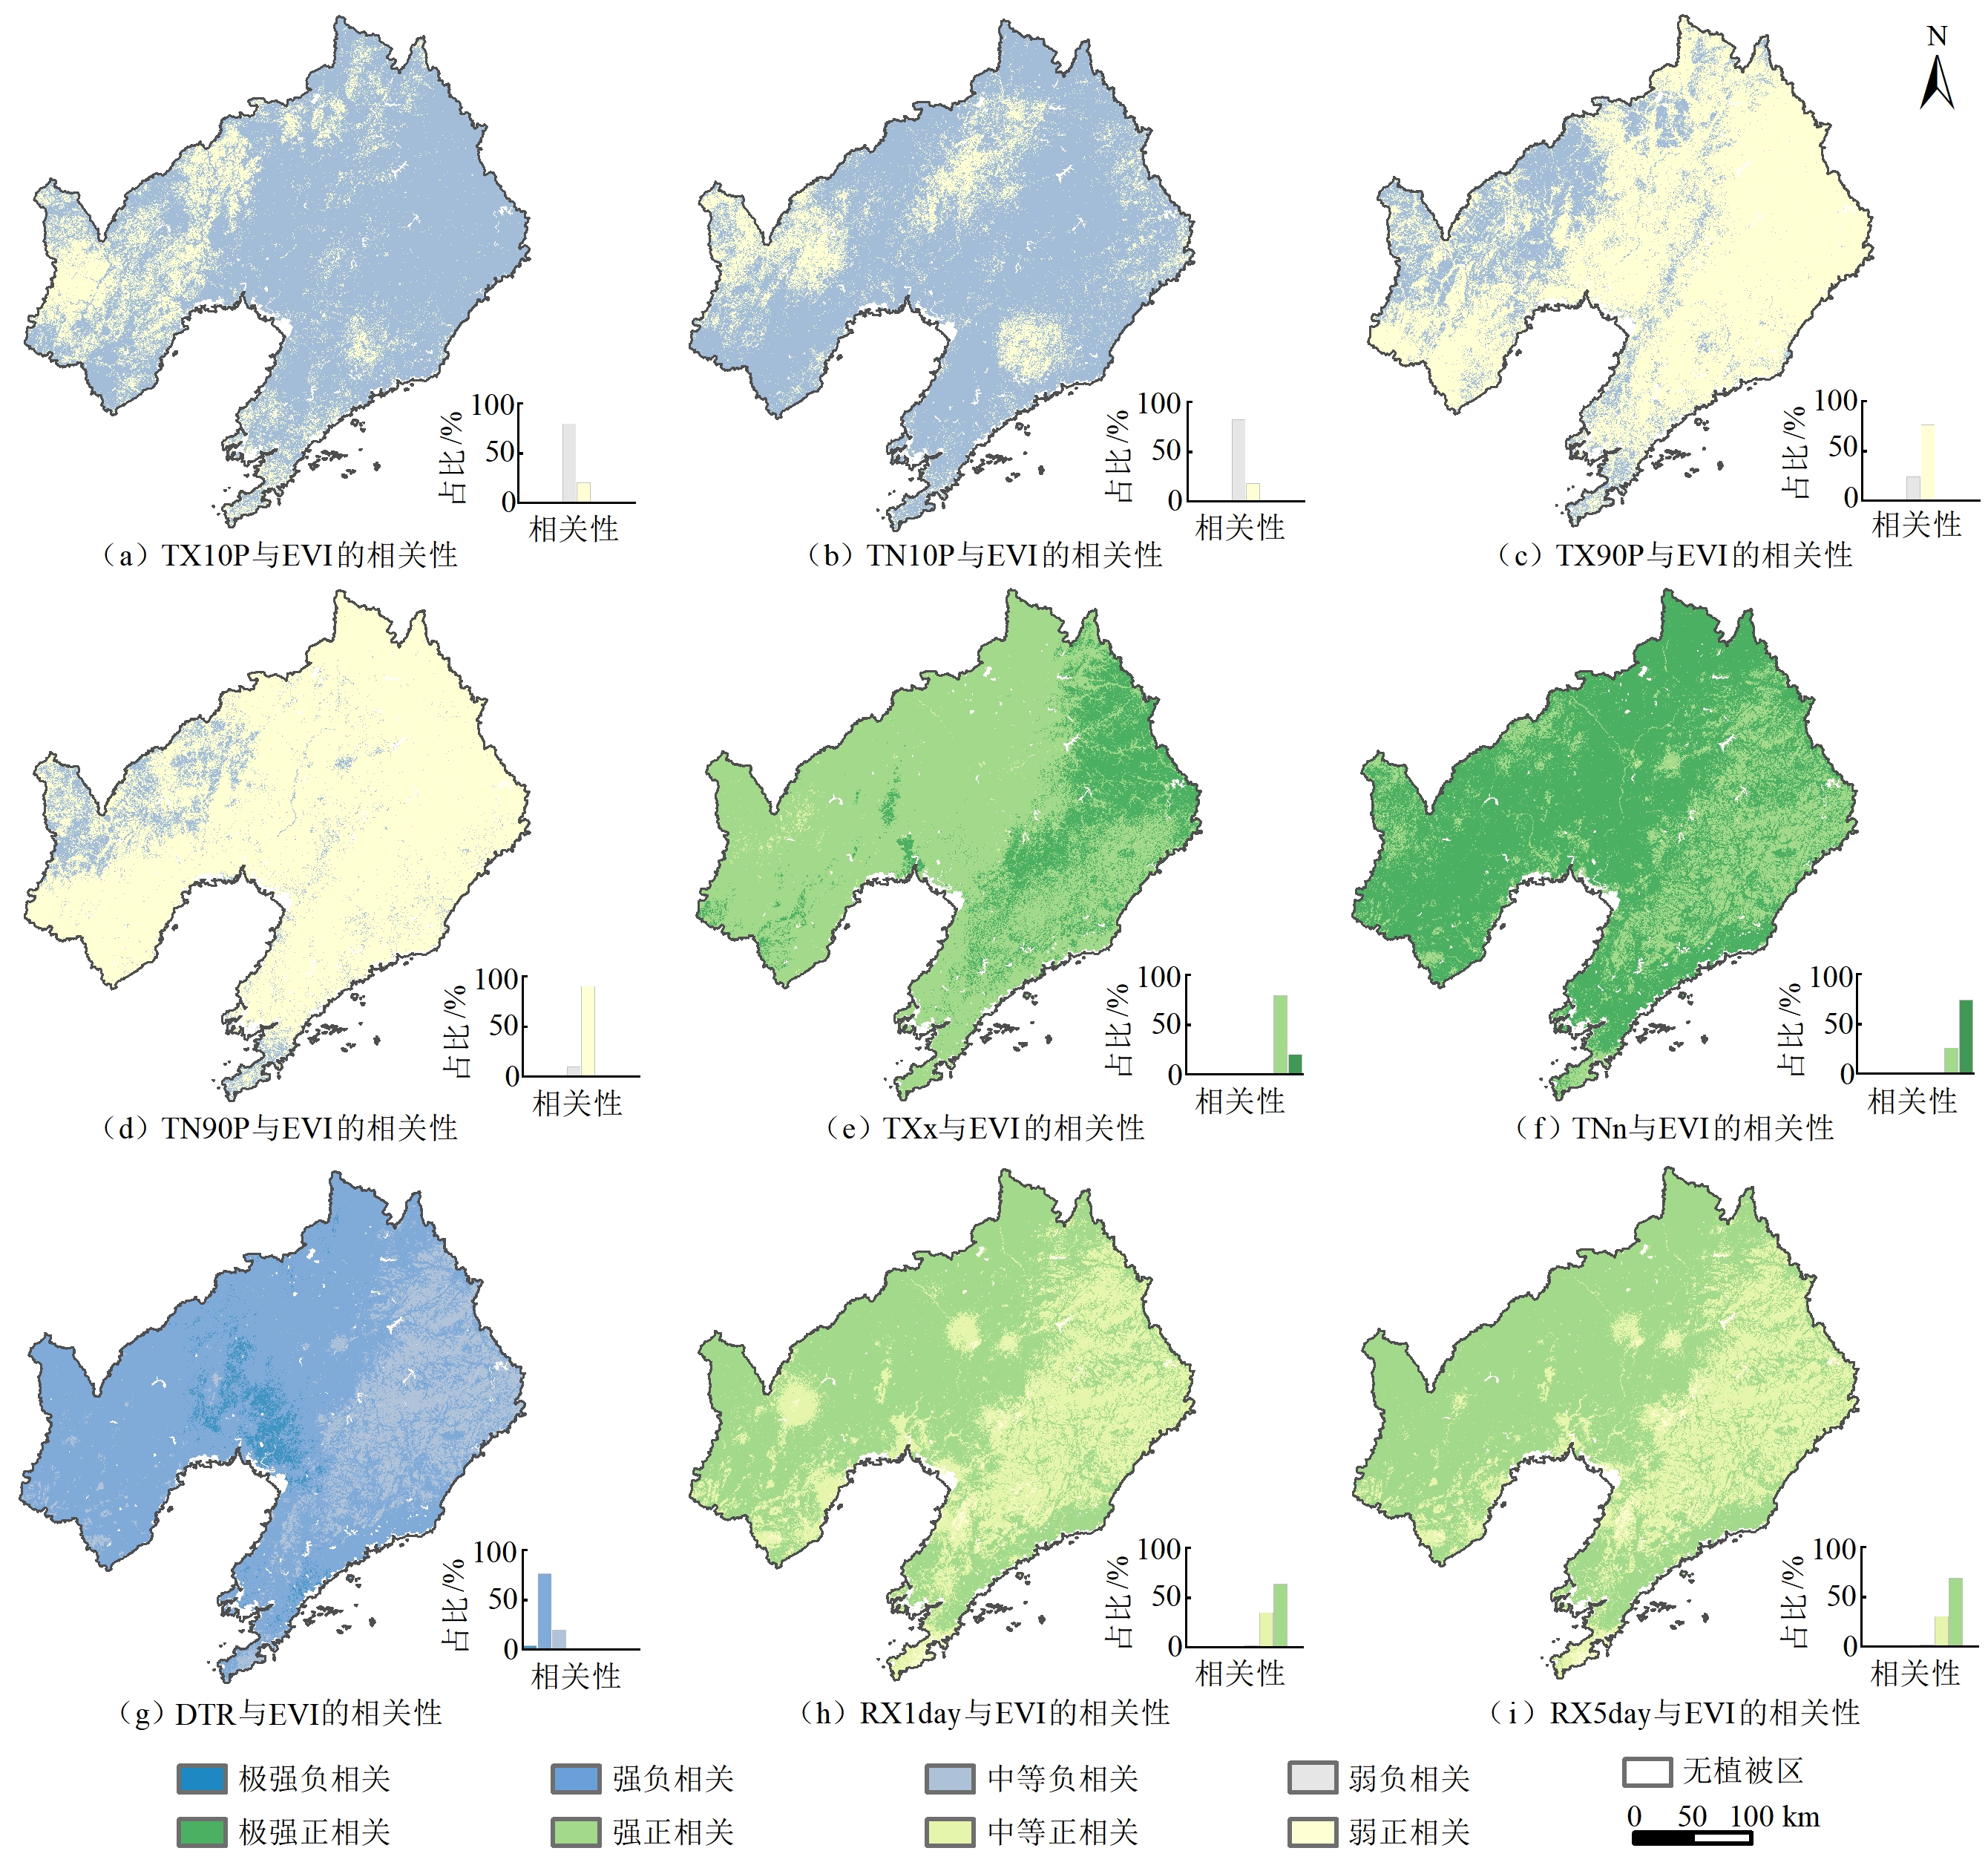
图6 2000-2020年月尺度极端气候指数与EVI相关系数的空间分布
Figure 6 The spatial distribution of the correlation coefficients between the monthly-scale extreme limate indices and EVI
| 指数 | 冷昼日数 (TX10P) | 冷夜日数 (TN10P) | 暖昼日数 (TX90P) | 暖夜日数 (TN90P) | 日最高气温极高值 (TXx) | 日最低气温极低值 (TNn) | 气温日较差 (DTR) | 单日最大降水量 (RX1day) | 连续5日最大降水量(RX5day) |
|---|---|---|---|---|---|---|---|---|---|
| 解释力(q值) | 0.23 | 0.06 | 0.17 | 0.07 | 0.12 | 0.14 | 0.11 | 0.25 | 0.28 |
| 排序 | 3 | 9 | 4 | 8 | 6 | 5 | 7 | 2 | 1 |
表3 单一极端气候指数对EVI的解释力
Table 3 Explaining the variability of EVI by single extreme climate index
| 指数 | 冷昼日数 (TX10P) | 冷夜日数 (TN10P) | 暖昼日数 (TX90P) | 暖夜日数 (TN90P) | 日最高气温极高值 (TXx) | 日最低气温极低值 (TNn) | 气温日较差 (DTR) | 单日最大降水量 (RX1day) | 连续5日最大降水量(RX5day) |
|---|---|---|---|---|---|---|---|---|---|
| 解释力(q值) | 0.23 | 0.06 | 0.17 | 0.07 | 0.12 | 0.14 | 0.11 | 0.25 | 0.28 |
| 排序 | 3 | 9 | 4 | 8 | 6 | 5 | 7 | 2 | 1 |
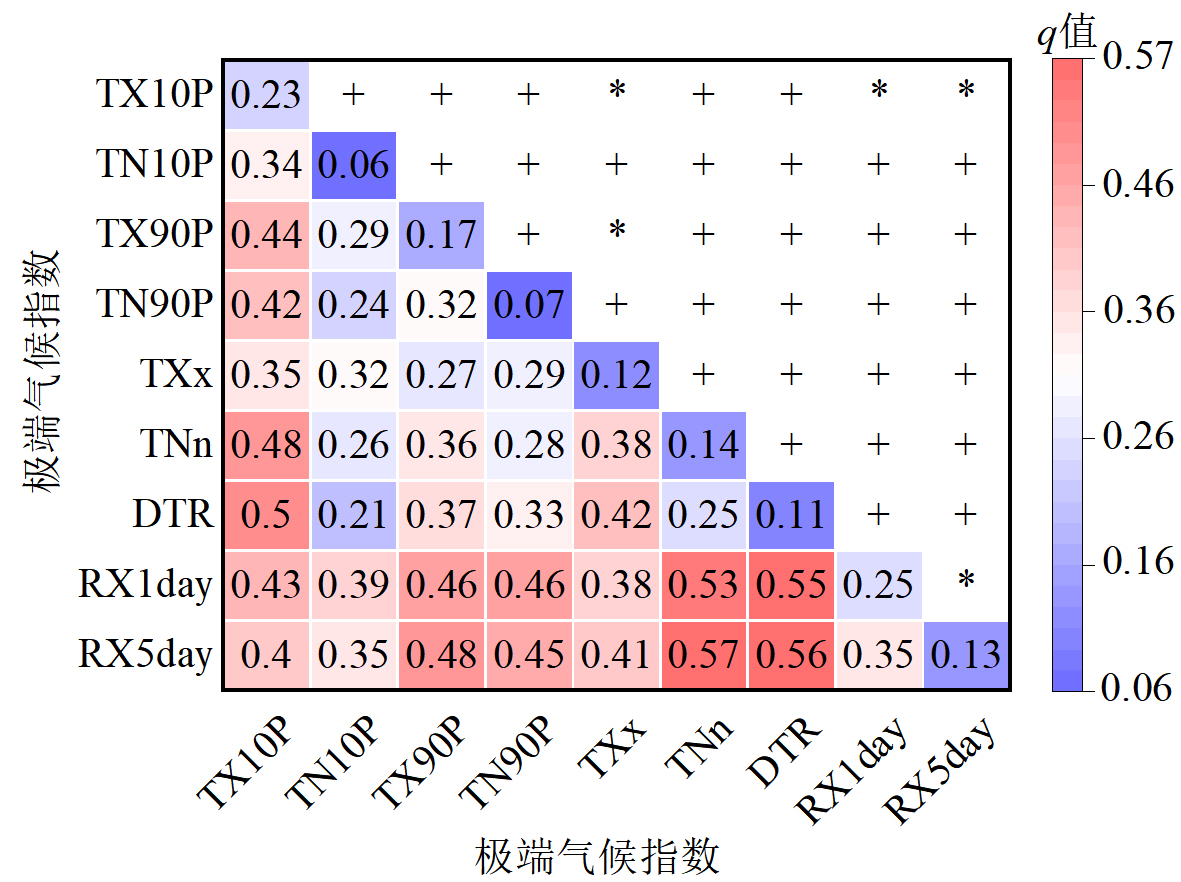
图7 极端气候指数对EVI的交互作用 “+”表示非线性增强;“*”表示双因子增强
Figure 7 The interaction of extreme climate indices on EVI
| [1] | CHENG Q P, ZHONG F L, WANG P, 2021. Potential linkages of extreme climate events with vegetation and large-scale circulation indices in an endorheic river basin in northwest China[J]. Atmospheric Research, 247: 105256. |
| [2] | FRICH P, ALEXANDER L V, DELLA-MARTA P, et al., 2002. Observed coherent changes in climatic extremes during the second half of the twentieth century[J]. Climate research, 19: 193-212. |
| [3] | HE Y L, YAN W B, CAI Y, et al., 2022. How does the Net primary productivity respond to the extreme climate under elevation constraints in mountainous areas of Yunnan, China?[J]. Ecological Indicators, 138: 108817. |
| [4] | JIANG H L, XU X, 2022. Impact of extreme climates on vegetation from multiple scales and perspectives in the Agro-pastural Transitional Zone of Northern China in the past three decades[J]. Journal of Cleaner Production, 372: 133459. |
| [5] | LI C L, WANG J, HU R C, et al., 2018. Relationship between vegetation change and extreme climate indices on the Inner Mongolia Plateau, China, from 1982 to 2013[J]. Ecological Indicators, 89: 101-109. |
| [6] | LI H, HU Y F, BATUNACUN, 2024. Responses of vegetation low-growth to extreme climate events on the Mongolian Plateau[J]. Global Ecology and Conservation, 56: e03292. |
| [7] | LI J G, WANG Y, LIU L L, et al., 2022. Characteristics and trends of rainstorm activities and their impacts on seasonal vegetation variations in coastal China[J]. Ecological Indicators, 138: 108851. |
| [8] | LIU G, LIU H Y, YIN Y, 2013. Global patterns of NDVI-indicated vegetation extremes and their sensitivity to climate extremes[J]. Environmental Research Letters, 8(2): 025009. |
| [9] | PEARSON R G, PHILLIPS S J, LORANTY M M, et al., 2013. Shifts in Arctic vegetation and associated feedbacks under climate change[J]. Nature Climate Change, 3: 673-677. |
| [10] | PIAO S L, ZHANG X P, CHEN A P, et al., 2019. The impacts of climate extremes on the terrestrial carbon cycle: A review[J]. Science China Earth Sciences, 62(10): 1551-1563. |
| [11] | PIAO S L, WANG X H, PARK T, et al., 2020. Characteristics, drivers and feedbacks of global greening[J]. Nature Reviews Earth & Environment, 1: 14-27. |
| [12] | SOLOMON S, QIN D, MANNING M, et al., 2007. Climate Change 2007: The Physical Science Basis. Contribution of Working Group I to the Fourth Assessment Report of the Intergovernmental Panel on Climate Change[M]. Cambridge: Cambridge University Press: 299-316. |
| [13] | SONG Y Z, WANG J F, GE Y, et al., 2020. An optimal parameters-based geographical detector model enhances geographic characteristics of explanatory variables for spatial heterogeneity analysis: Cases with different types of spatial data[J]. GIScience & Remote Sensing, 57: 593-610. |
| [14] |
WAN S Q, XIA J Y, LIU W X, et al., 2009. Photosynthetic overcompensation under nocturnal warming enhances grassland carbon sequestration[J]. Ecology, 90(10): 2700-2710.
PMID |
| [15] | WANG J F, ZHANG T L, FU B J, 2016. A measure of spatial stratified heterogeneity[J]. Ecological Indicators, 67: 250-256. |
| [16] | WANG X Y, LI Y Q, WANG M M, et al., 2021. Changes in daily extreme temperature and precipitation events in mainland China from 1960 to 2016 under global warming[J]. International Journal of Climatology, 41(2): 1465-1483. |
| [17] | XU X, JIANG H L, GUAN M X, et al., 2020. Vegetation responses to extreme climatic indices in coastal China from 1986 to 2015[J]. Science of The Total Environment, 744: 140784. |
| [18] | YAMAMOTO Y, ICHII K, RYU Y, et al., 2023. Detection of vegetation drying signals using diurnal variation of land surface temperature: Application to the 2018 East Asia heatwave[J]. Remote Sensing of Environment, 291: 113572. |
| [19] | YAN W B, HE Y L, CAI Y, et al., 2021. Relationship between extreme climate indices and spatiotemporal changes of vegetation on Yunnan Plateau from 1982 to 2019[J]. Global Ecology and Conservation, 31: e01813. |
| [20] | YANG H J, TAO W J, MA Q M, et al., 2023. Compound hot extremes exacerbate forest growth decline in dry areas but not in humid areas in the Northern Hemisphere[J]. Agricultural and Forest Meteorology, 341: 109663. |
| [21] | YIN J B, GENTINE P, SLATER L, et al., 2023. Future socio-ecosystem productivity threatened by compound drought-heatwave events[J]. Nature Sustainability, 6: 259-272. |
| [22] | ZHAO X Y, TAN S C, LI Y P, et al., 2024. Quantitative analysis of fractional vegetation cover in southern Sichuan urban agglomeration using optimal parameter geographic detector model, China[J]. Ecological Indicators, 158: 111529. |
| [23] | ZHENG L, LU J Z, LIU H, et al., 2023. Evidence of vegetation greening benefitting from the afforestation initiatives in China[J]. Geo-spatial Information Science, 27(3): 683-702. |
| [24] | ZI S S, LI Y, ZHANG J W, et al., 2025. The biophysical and crop yield effects of irrigation and their changes in China’s drylands[J]. Agricultural Water Management, 313: 109471. |
| [25] | 蔡博峰, 于嵘, 2009. 基于遥感的植被长时序趋势特征研究进展及评价[J]. 遥感学报, 13(6): 1170-1186. |
| CAI B F, YU R, 2009. Advance and evaluation in the long time series vegetation trends research based on remote sensing[J]. Journal of Remote Sensing, 13(6): 1170-1186. | |
| [26] | 曹永强, 李可欣, 任博, 等, 2022. 基于SPEI的辽宁省气象干旱特征及驱动因素分析[J]. 水利水电科技进展, 42(5): 28-36. |
| CAO Y Q, LI K X, REN B, et al., 2022. Characteristics and driving factors analysis of meteorological drought in Liaoning Province based on SPEI[J]. Advances in Science and Technology of Water Resources, 42(5): 28-36. | |
| [27] | 高滢, 孙虎, 徐崟尧, 等, 2022. 陕西省植被覆盖时空变化及其对极端气候的响应[J]. 生态学报, 42(3): 1022-1033. |
| GAO Y, SUN H, XU Y Y, et al., 2022. Temporal and spatial variation of vegetation cover and its response to extreme climate in Shaanxi Province[J]. Acta Ecologica Sinica, 42(3): 1022-1033. | |
| [28] |
龚郑洁, 雷勇, 钟露露, 等, 2024. 干旱胁迫下珠江流域植被响应的滞后效应及损失概率评估[J]. 应用生态学报, 35(4): 1083-1091.
DOI |
| GONG Z J, LEI Y, ZHONG L L, et al., 2024. Assessment of the lagging effect of vegetation response and loss probability in the Pearl River basin under drought stress[J]. The Journal of Applied Ecology, 35(4): 1083-1091. | |
| [29] |
胡宜昌, 董文杰, 何勇, 2007. 21世纪初极端天气气候事件研究进展[J]. 地球科学进展, 22(10): 1066-1075.
DOI |
|
HU Y C, DONG W J, HE Y, 2007. Progress of the study of extreme weather and climate events at the beginning of the twenty first century[J]. Advances in Earth Science, 22(10): 1066-1075.
DOI |
|
| [30] |
李霞, 陈永昊, 陈喆, 等, 2024. 中国沿海地区植被NDVI时空变化及驱动力分析[J]. 生态环境学报, 33(2): 180-191.
DOI |
|
LI X, CHEN Y H, CHEN Z, et al., 2024. Analysis of spatio-temporal changes and driving vegetation NDVI in coastal areas of China[J]. Ecology and Environment Sciences, 33(2): 180-191.
DOI |
|
| [31] | 李颖, 任家璇, 冯玉, 等, 2017. 近60年辽宁省极端气候事件趋势时空变化特征分析[J]. 灾害学, 32(1): 96-105. |
| LI Y, REN J X, FENG Y, et al., 2017. Spatial and temporal characteristics of trends in extreme weather events in Liaoning Province during 1957-2014[J]. Journal of Catastrophology, 32(1): 96-105. | |
| [32] | 刘艳伟, 王淑莹, 焦忠帅, 2021. 2000-2016年辽宁省NDVI时空变化及其与降水量的关系[J]. 排灌机械工程学报, 39(10): 1040-1045. |
| LIU Y W, WANG S Y, JIAO Z S, 2021. Spatial and temporal variations of normalized differential vegetation index and its relationship with precipitation in Liaoning Province from 2000 to 2016[J]. Journal of Drainage and Irrigation Machinery Engineering, 39(10): 1040-1045. | |
| [33] | 苏日罕, 郭恩亮, 王永芳, 等, 2023. 1982-2020年内蒙古地区极端气候变化及其对植被的影响[J]. 生态学报, 43(1): 419-431. |
| SU R H, GUO E L, WANG Y F, et al., 2023. Extreme climate changes in the Inner Mongolia and their impacts on vegetation dynamics during 1982-2020[J]. Acta Ecologica Sinica, 43(1): 419-431. | |
| [34] |
唐吉喆, 徐梦冉, 莫宇, 等, 2023. 生态地理分区视角下的辽宁省植被归一化植被指数的时空变化[J]. 应用生态学报, 34(12): 3271-3278.
DOI |
|
TANG J Z, XU M R, MO Y, et al., 2023. Spatial and temporal variation in normalized difference vegetation index of vegetation in Liaoning Province from the perspective of ecogeographic zoning[J]. Chinese Journal of Applied Ecology, 34(12): 3271-3278.
DOI |
|
| [35] |
王劲峰, 徐成东, 2017. 地理探测器: 原理与展望[J]. 地理学报, 72(1): 116-134.
DOI |
|
WANG J F, XU C D, 2017. Geodetector: Principle and prospective[J]. Acta Geographica Sinica, 72(1): 116-134.
DOI |
|
| [36] |
王晓利, 侯西勇, 2019. 1982-2014年中国沿海地区归一化植被指数(NDVI) 变化及其对极端气候的响应[J]. 地理研究, 38(4): 807-821.
DOI |
| WANG X L, HOU X Y, 2019. Variation of normalized difference vegetation index and its response to extreme climate in coastal China during 1982-2014[J]. Geographical Research, 38(4): 807-821. | |
| [37] | 王正兴, 刘闯, HUETE A, 2003. 植被指数研究进展: 从AVHRR-NDVI到MODIS-EVI[J]. 生态学报, 23(5): 979-987. |
| WANG Z X, LIU C, HUETE A, 2003. From AVHRR-NDVI to MODIS-EVI: Advances in vegetation index research[J]. Acta Ecologica Sinica, 23(5): 979-987. | |
| [38] | 吴欣宇, 朱秀芳, 2023. 中国不同植被区对极端气候的响应差异[J]. 生态学报, 43(24): 10202-10215. |
| WU X Y, ZHU X F, 2023. Differential analysis of vegetation response to extreme climate in different vegetation regions of China[J]. Acta Ecologica Sinica, 43(24): 10202-10215. | |
| [39] |
徐佳乐, 杨兴川, 赵文吉, 等, 2024. 气候变化背景下内蒙古中西部植被覆盖度演变特征研究[J]. 生态环境学报, 33(7): 1008-1018.
DOI |
|
XU J L, YANG X C, ZHAO W J, et al., 2024. Evolution characteristics of vegetation coverage in central and western inner mongolia under the background of climate change[J]. Ecology and Environment Sciences, 33(7): 1008-1018.
DOI |
|
| [40] |
张晶, 郝芳华, 吴兆飞, 等, 2023. 植被物候对极端气候响应及机制[J]. 地理学报, 78(9): 2241-2255.
DOI |
|
ZHANG J, HAO F H, WU Z F, et al., 2023. Response of vegetation phenology to extreme climate and its mechanism[J]. Acta Geographica Sinica, 78(9): 2241-2255.
DOI |
|
| [41] |
郑景云, 郝志新, 方修琦, 等, 2014. 中国过去2000年极端气候事件变化的若干特征[J]. 地理科学进展, 33(1): 3-12.
DOI |
|
ZHENG J Y, HAO Z X, FANG X Q, et al., 2014. Changing characteristics of extreme climate events during past 2000 years in China[J]. Progress in Geography, 33(1): 3-12.
DOI |
| [1] | 于倩茹, 裴厦, 刘春兰, 乔青, 郑方钰, 朱林红. 基于多维视角的北京市生态系统调节服务稀缺性评估及其空间聚集特征研究[J]. 生态环境学报, 2025, 34(7): 1133-1146. |
| [2] | 石镕瑞, 杨小雄, 马骥, 黄珊珊, 杨玥, 卢盛权, 吴广. 滇桂黔石漠化片区生态环境质量时空演变及驱动力分析[J]. 生态环境学报, 2025, 34(7): 1147-1162. |
| [3] | 杨昊彧, 黄康江, 陈晓东, 赵劼, 熊军, 田康. 贵州省生态空间效率演变及景观格局的影响归因[J]. 生态环境学报, 2025, 34(6): 902-913. |
| [4] | 李曼, 吴东丽, 何昊, 余慧婕, 赵琳, 刘聪, 胡正华, 李琪. 1990-2020年黄河流域碳储量时空演变及驱动因素研究[J]. 生态环境学报, 2025, 34(3): 333-344. |
| [5] | 郭昭, 师芸, 刘铁铭, 张雨欣, 闫永智. 2001-2020年秦岭北麓NPP时空格局及驱动因素分析[J]. 生态环境学报, 2025, 34(3): 401-410. |
| [6] | 赵乐鋆, 王诗瑶, 赵子渝, 洪星, 李夫星, 吴佳仪, 华婧妤. 2008-2022年华北平原七省市AOD时空变化特征及主要影响因素分析[J]. 生态环境学报, 2025, 34(2): 256-267. |
| [7] | 张舒涵, 姜海玲, 于海淋, 冯馨慧. 沈阳现代化都市圈景观生态风险时空演变及驱动力分析[J]. 生态环境学报, 2024, 33(9): 1471-1481. |
| [8] | 徐佳乐, 杨兴川, 赵文吉, 杨志强, 钟一雪, 师乐颜, 马鹏飞. 气候变化背景下内蒙古中西部植被覆盖度演变特征研究[J]. 生态环境学报, 2024, 33(7): 1008-1018. |
| [9] | 李霞, 陈永昊, 陈喆, 张国壮, 唐梦雅. 中国沿海地区植被NDVI时空变化及驱动力分析[J]. 生态环境学报, 2024, 33(2): 180-191. |
| [10] | 巫晨煜, 许帆帆, 魏士博, 樊晶晶, 刘观鹏, 王坤. 渭河流域地表植被覆盖对气候变化的响应研究[J]. 生态环境学报, 2023, 32(5): 835-844. |
| [11] | 叶深, 王鹏, 黄祎, 折远洋, 丁明军. 长三角城市群城市空间形态对PM2.5与O3污染空间异质性特征的影响研究[J]. 生态环境学报, 2023, 32(10): 1771-1784. |
| [12] | 阮惠华, 许剑辉, 张菲菲. 2001—2020年粤港澳大湾区植被和地表温度时空变化研究[J]. 生态环境学报, 2022, 31(8): 1510-1520. |
| [13] | 陈文裕, 夏丽华, 徐国良, 余世钦, 陈行, 陈金凤. 2000—2020年珠江流域NDVI动态变化及影响因素研究[J]. 生态环境学报, 2022, 31(7): 1306-1316. |
| [14] | 王静, 方锋, 王莺. 中国西南和华南粮食作物播种面积时序变化特征及其影响因素分析[J]. 生态环境学报, 2021, 30(10): 2010-2025. |
| 阅读次数 | ||||||
|
全文 |
|
|||||
|
摘要 |
|
|||||