生态环境学报 ›› 2023, Vol. 32 ›› Issue (10): 1771-1784.DOI: 10.16258/j.cnki.1674-5906.2023.10.006
叶深1( ), 王鹏1,2,*(), 黄祎1, 折远洋1, 丁明军1,2
收稿日期:2023-09-06
出版日期:2023-10-18
发布日期:2024-01-16
通讯作者:
*王鹏。E-mail: wangpengjlu@jxnu.edu.cn作者简介:叶深(1996年生),男,硕士,主要研究方向为城市生态学。E-mail: ys1996120@outlook.com
基金资助:
YE Shen1(), WANG Peng1,2,*(), HUANG Yi1, SHE Yuanyang1, DING Mingjun1,2
Received:2023-09-06
Online:2023-10-18
Published:2024-01-16
摘要:
城市空间形态作为城市建设用地扩张及社会经济空间结构聚合体反映了城市化进程,探究城市空间形态及PM2.5与O3污染对区域大气环境治理具有重要意义。基于“十三五”规划期间长三角城市群空气质量监测站及气象站观测数据、中国土地覆盖数据(China Land Cover dataset)、人口密度及夜间灯光遥感影像从城市空间格局指数(城市建设用地紧凑度、城市建设用地边缘密度、城市建设用地斑块密度等)及城市空间结构指数(城市夜间平均夜光遥感指数、城市人口密度、城市通勤度等)角度计算城市空间形态指数,并运用地理探测器解析PM2.5与O3污染空间异质性特征。结果表明,1)2020年长三角城市群城市PM2.5年均质量浓度值较2016年下降15.9%,而MDA8 O3年均质量浓度值增长9.94%;PM2.5与O3季节质量浓度时空分异特征显著,其相关性系数体现出“自东南沿海向西北内陆递减”的特征。2)长三角城市群的城市空间形态指数时空分异特征强于气象要素。除2019-2020年交通通勤度和城市建设用地紧凑度分别出现短暂44.8%和5.86%下降外,其余指数均逐年上升;长三角城市群城市空间形态指数受空间异质性影响整体呈“北高、中部次之、南低”的特征。3)城市建设用地紧凑度是长三角城市群城市PM2.5与O3污染的最主要城市空间格局影响因子,对PM2.5质量浓度值、MDA8 O3质量浓度值及PM2.5与O3浓度相关性解释率分别为0.259、0.419和0.258。研究结果揭示长三角城市群城市的主要空间形态指数将增强城市PM2.5与O3污染空间异质性特征,为探明城市化扩张背景下大气污染物的空间演化规律提供了新思路。
中图分类号:
叶深, 王鹏, 黄祎, 折远洋, 丁明军. 长三角城市群城市空间形态对PM2.5与O3污染空间异质性特征的影响研究[J]. 生态环境学报, 2023, 32(10): 1771-1784.
YE Shen, WANG Peng, HUANG Yi, SHE Yuanyang, DING Mingjun. Urban Morphology and the Influence of the Spatial Heterogeneity of PM2.5 and O3 Pollution: The Case of the Yangtze River Delta[J]. Ecology and Environment, 2023, 32(10): 1771-1784.
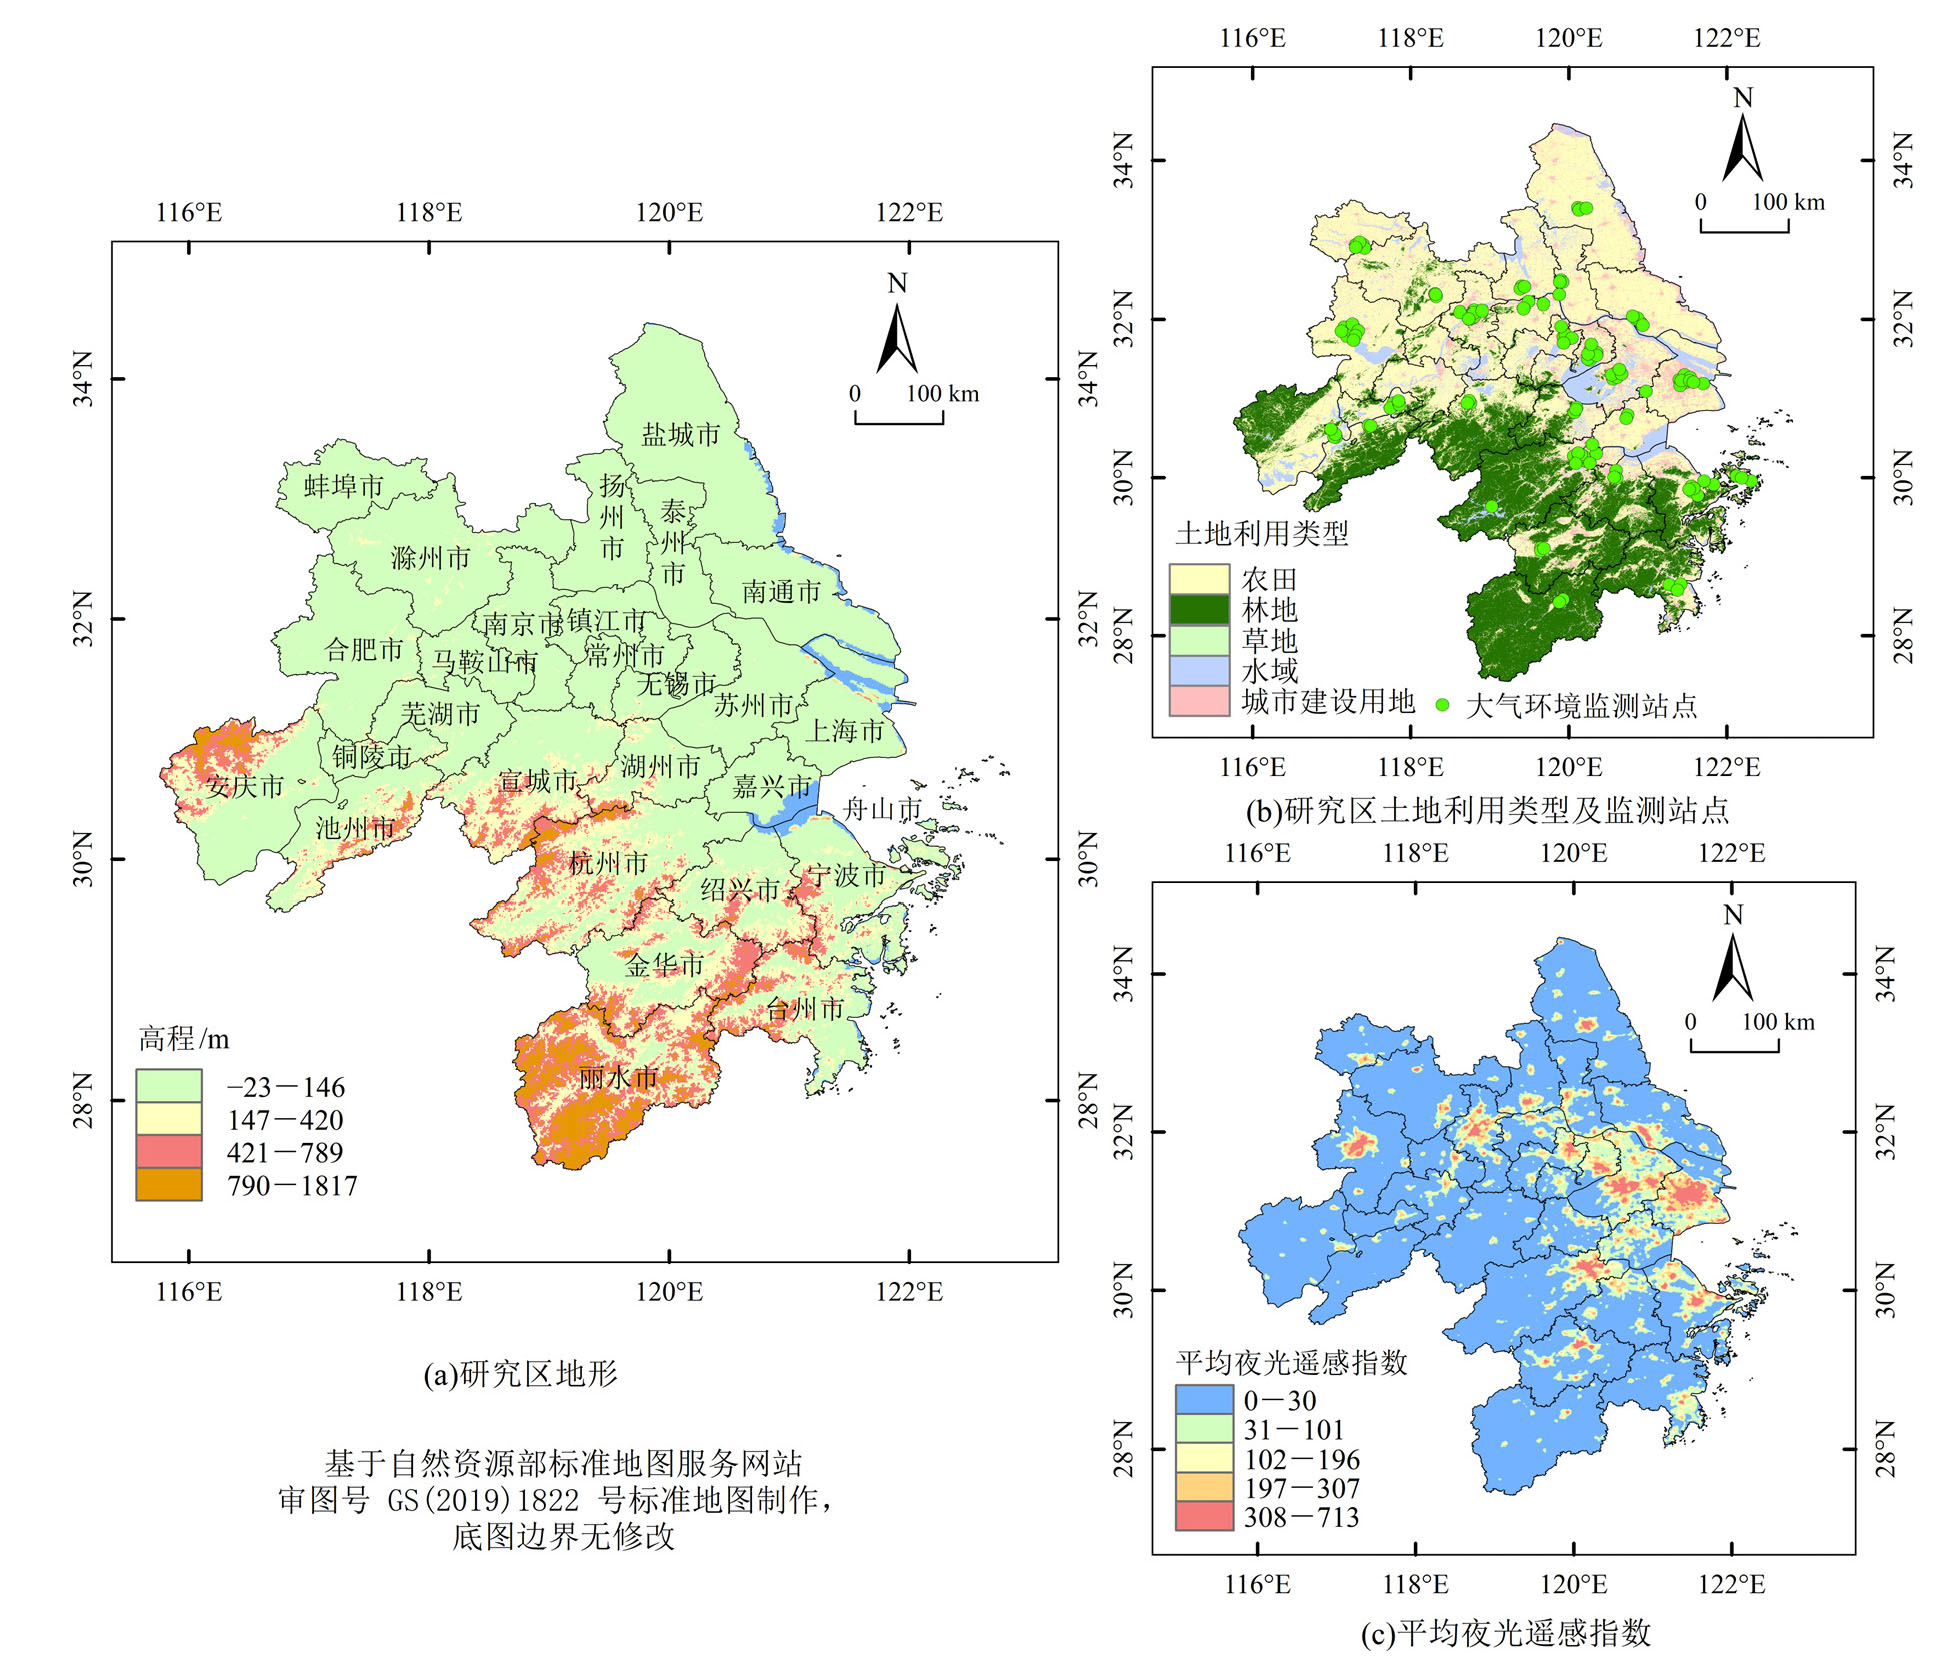
图1 研究区地形、监测站点、土地利用及平均夜光遥感指数的空间分布
Figure 1 Spatial distribution of topography, monitoring stations, land use and mean nighttime light index values in the study area
| 数据类型 | 数据名称 | 数据年份 | 单位 | 数据来源 |
|---|---|---|---|---|
| 大气污染物监测数据 | PM2.5年均质量浓度值 | 2016‒2020 | μg∙m−3 | 全国城市空气质量实时发布平台 ( |
| MDA8 O3年均质量浓度值 | ||||
| 土地利用数据 | 中国土地覆盖数据 (CLCD) | m | | |
| 人口密度数据 | LandScan人口密度数据 | person∙km−2 | | |
| 夜光遥感数据 | DMSP夜间灯光数据集 | ‒ | | |
| 社会经济数据 | 公共汽车保有量 | 2017‒2021 | 辆 | 2017‒2021年《中国城市统计年鉴》 |
| 第三产业结构 | % | |||
| 气象数据 | 温度 | 2016‒2020 | ℃ | 国家气象科学数据中心 ( |
| 降水 | mm | |||
| 相对湿度 | % | |||
| 风速 | m∙s−1 |
表1 各类城市指标汇总
Table 1 Urban spatial morphology index and significance
| 数据类型 | 数据名称 | 数据年份 | 单位 | 数据来源 |
|---|---|---|---|---|
| 大气污染物监测数据 | PM2.5年均质量浓度值 | 2016‒2020 | μg∙m−3 | 全国城市空气质量实时发布平台 ( |
| MDA8 O3年均质量浓度值 | ||||
| 土地利用数据 | 中国土地覆盖数据 (CLCD) | m | | |
| 人口密度数据 | LandScan人口密度数据 | person∙km−2 | | |
| 夜光遥感数据 | DMSP夜间灯光数据集 | ‒ | | |
| 社会经济数据 | 公共汽车保有量 | 2017‒2021 | 辆 | 2017‒2021年《中国城市统计年鉴》 |
| 第三产业结构 | % | |||
| 气象数据 | 温度 | 2016‒2020 | ℃ | 国家气象科学数据中心 ( |
| 降水 | mm | |||
| 相对湿度 | % | |||
| 风速 | m∙s−1 |
| 类型 | 数据名称 | 缩写 | 意义 | 计算公式 |
|---|---|---|---|---|
| 城市空间格局 | 城市建设用地紧凑度 | CI | 表示城市空间形态形状、破碎度 | CI=2 |
| 城市建设用地边缘密度 | ED | 表示城市空间形态复杂性 | ED=E/A×10000 | |
| 城市建设用地斑块密度 | PD | 表示城市空间形态内部连通性 | PD=N/A | |
| 城市建设用地最大斑块占比 | LPI | 表示城市空间形态中心性 | LPI=amax/A×100 | |
| 城市空间结构 | 城市人口密度 | P | 表示城市空间规模 | P=POP/A |
| 城市平均夜光遥感指数 | TNLI | 表示城市空间规模 | ||
| 第三产业结构占比 | Ind | 表示城市功能结构 | Ind=IND/GDP | |
| 交通通勤度 | TC | 表示城市交通可达性 | TC=Bus/A |
表2 城市空间形态指数及意义
Table 2 Urban spatial morphology index and significance
| 类型 | 数据名称 | 缩写 | 意义 | 计算公式 |
|---|---|---|---|---|
| 城市空间格局 | 城市建设用地紧凑度 | CI | 表示城市空间形态形状、破碎度 | CI=2 |
| 城市建设用地边缘密度 | ED | 表示城市空间形态复杂性 | ED=E/A×10000 | |
| 城市建设用地斑块密度 | PD | 表示城市空间形态内部连通性 | PD=N/A | |
| 城市建设用地最大斑块占比 | LPI | 表示城市空间形态中心性 | LPI=amax/A×100 | |
| 城市空间结构 | 城市人口密度 | P | 表示城市空间规模 | P=POP/A |
| 城市平均夜光遥感指数 | TNLI | 表示城市空间规模 | ||
| 第三产业结构占比 | Ind | 表示城市功能结构 | Ind=IND/GDP | |
| 交通通勤度 | TC | 表示城市交通可达性 | TC=Bus/A |
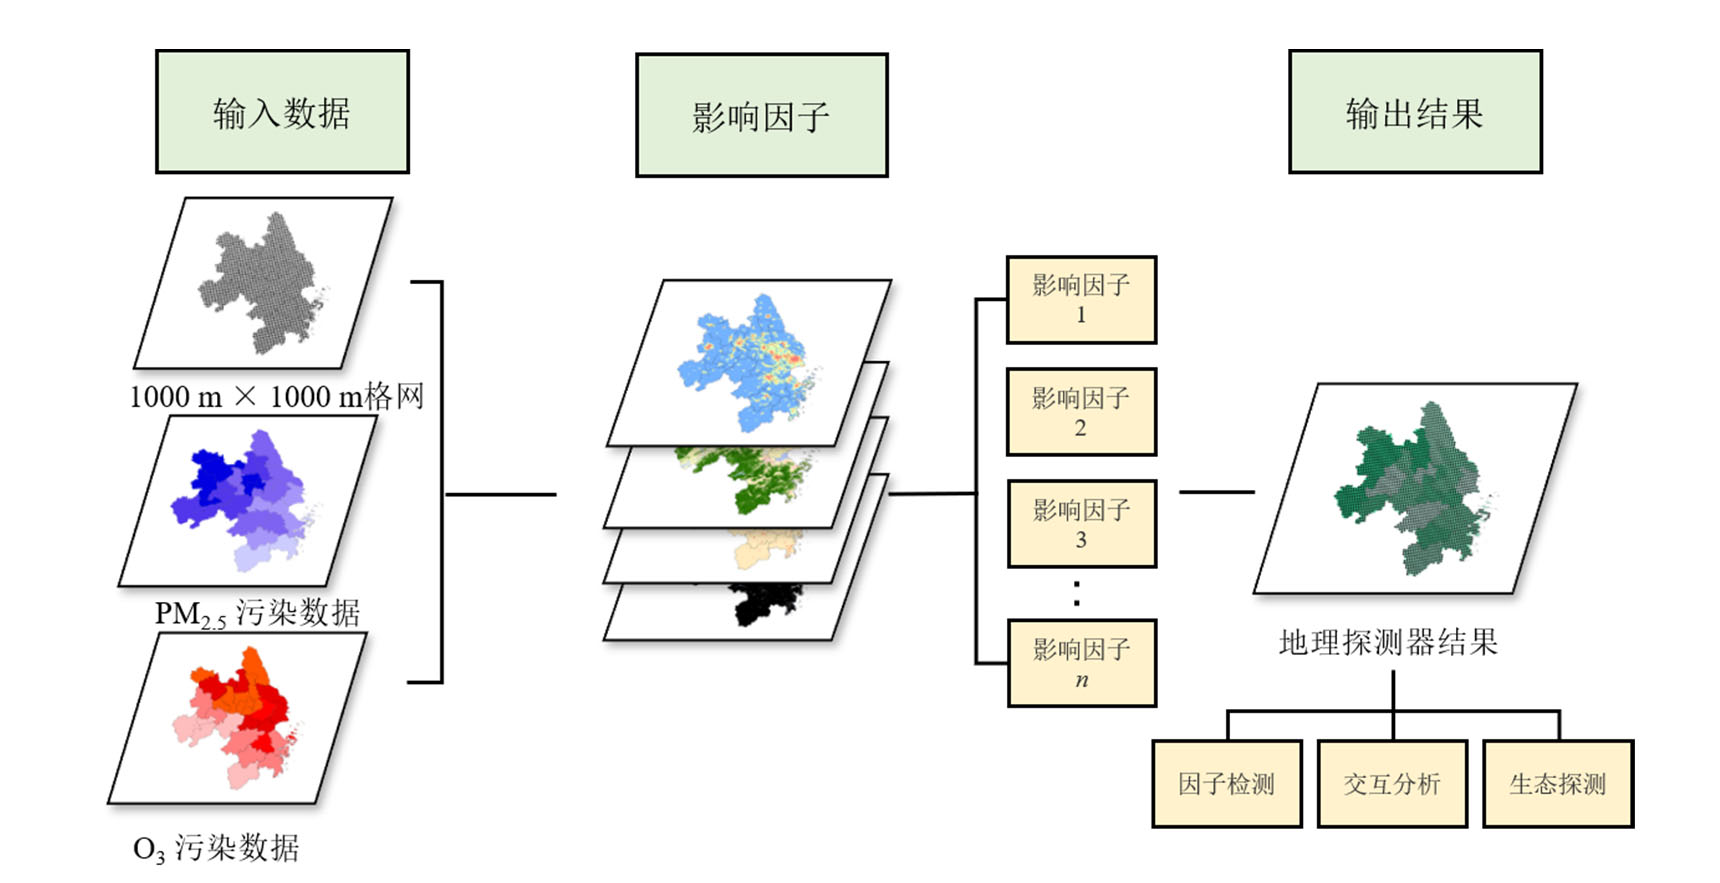
图2 基于地理探测器分析城市空间变量对PM2.5与O3污染空间异质性特征的影响
Figure 2 Geo-detector analysis of the spatial variable on the spatial heterogeneity characteristics of PM2.5 and O3 pollution
| 判断依据 | 交互作用 |
|---|---|
| q(x1∩x2)<Min(q(x1), q(x2)) | 非线性减弱 |
| Min(q(x1), q(x2))<q(x1∩x2)<Max(q(x1), q(x2)) | 单因子非线性减弱 |
| q(x1∩x2)>Max(q(x1), q(x2)) | 双因子增强 |
| q(x1∩x2)=q(x1)+q(x2) | 独立 |
| q(x1∩x2)>q(x1)+q(x2) | 非线性增强 |
表3 地理探测器交互探测
Table 3 Geo-detector interaction detection
| 判断依据 | 交互作用 |
|---|---|
| q(x1∩x2)<Min(q(x1), q(x2)) | 非线性减弱 |
| Min(q(x1), q(x2))<q(x1∩x2)<Max(q(x1), q(x2)) | 单因子非线性减弱 |
| q(x1∩x2)>Max(q(x1), q(x2)) | 双因子增强 |
| q(x1∩x2)=q(x1)+q(x2) | 独立 |
| q(x1∩x2)>q(x1)+q(x2) | 非线性增强 |
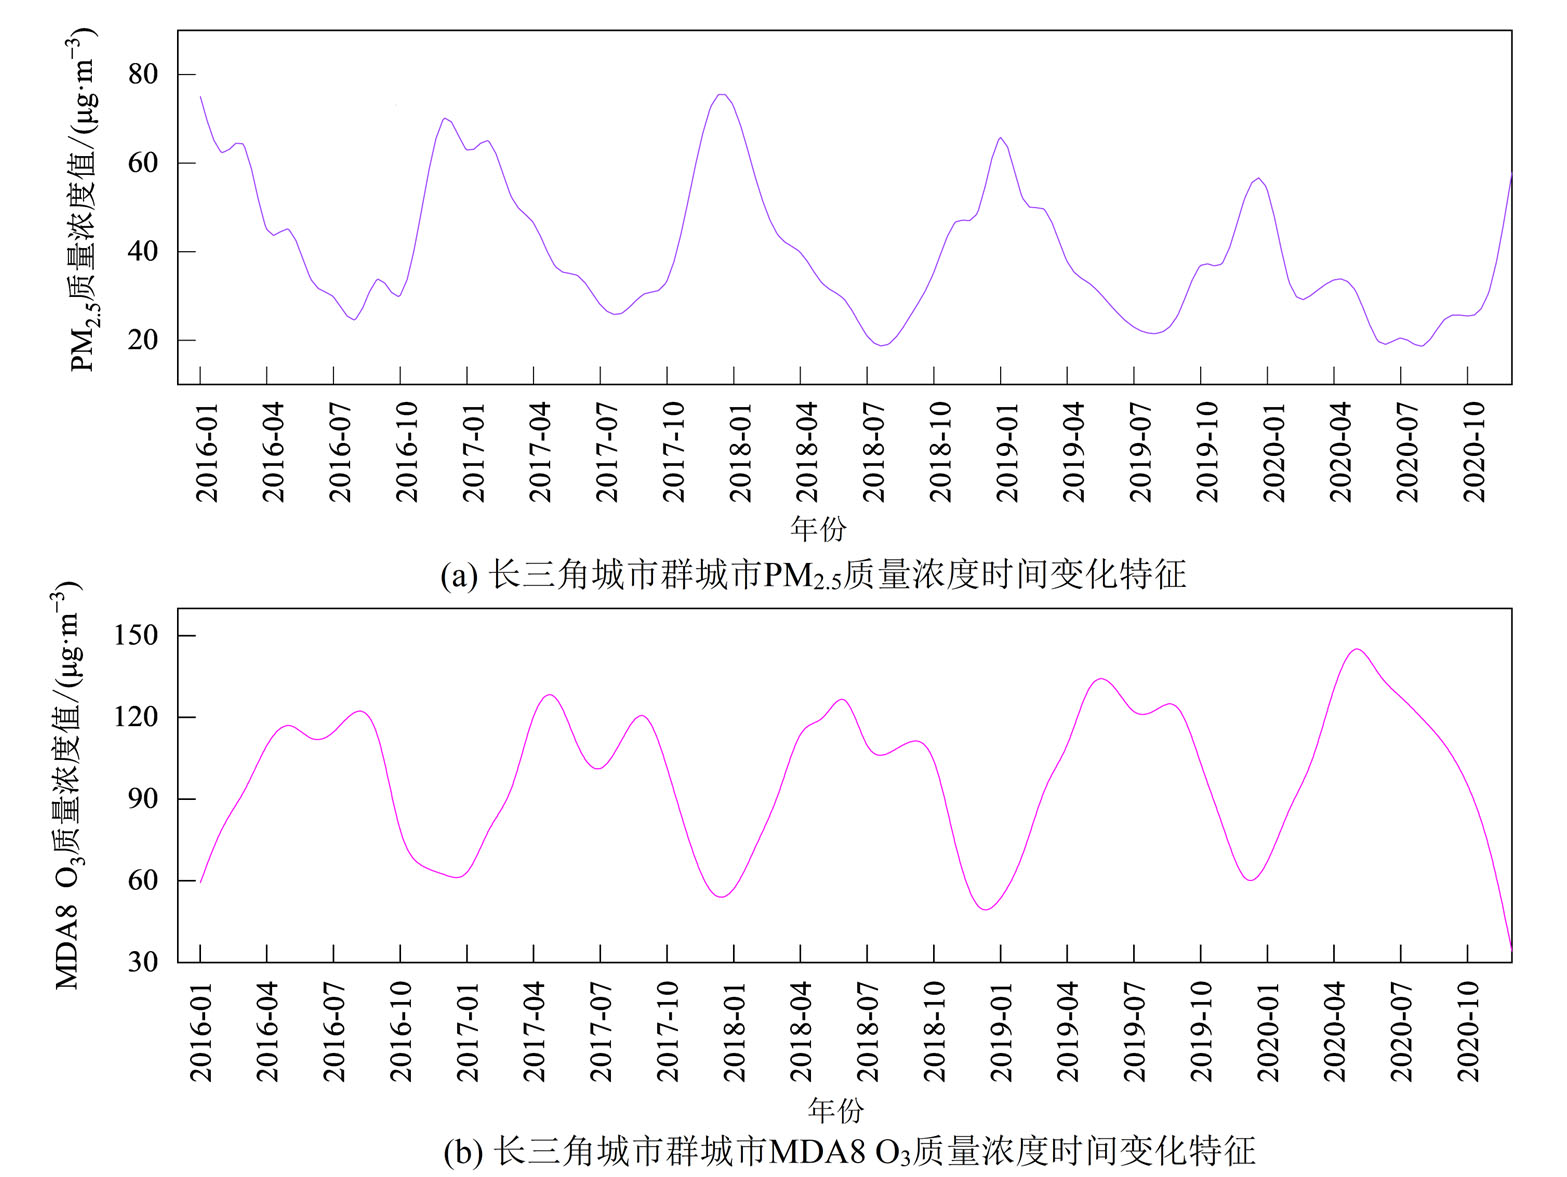
图3 长三角城市群城市PM2.5与MDA8 O3质量浓度时间变化特征
Figure 3 Contrast between temporal changes of PM2.5 and MDA8 O3 in the Yangtze River Delta
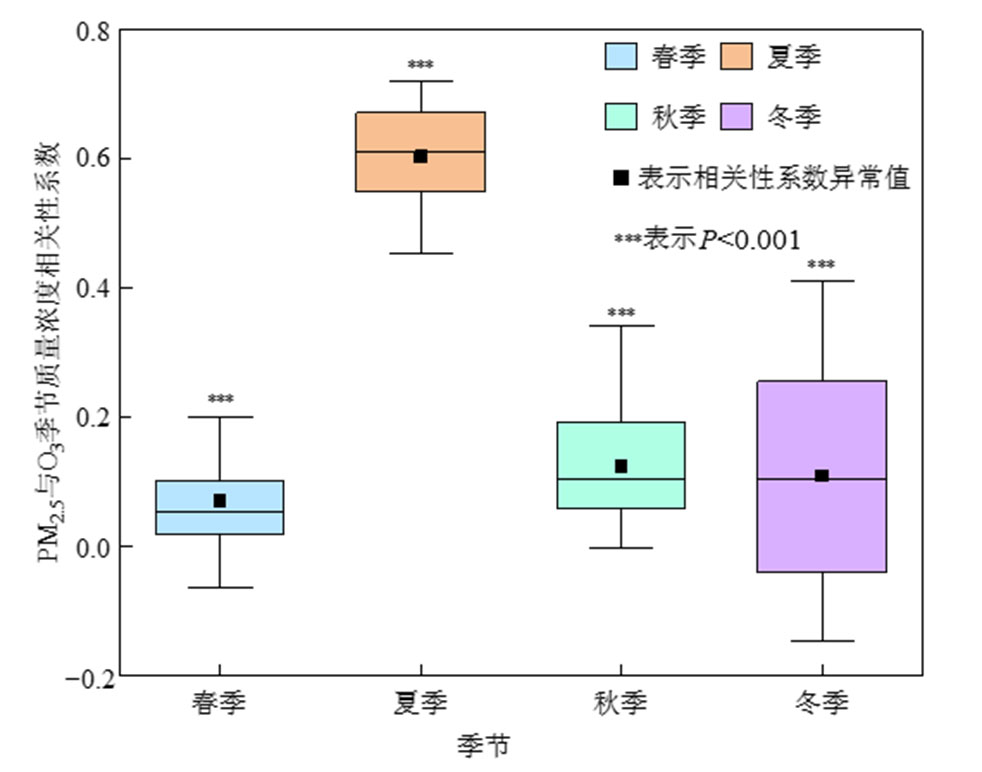
图4 长三角城市群PM2.5与O3季节质量浓度相关性时间变化特征
Figure 4 Seasonal temporal changes of PM2.5 and O3 correlation in Yangtze River Delta
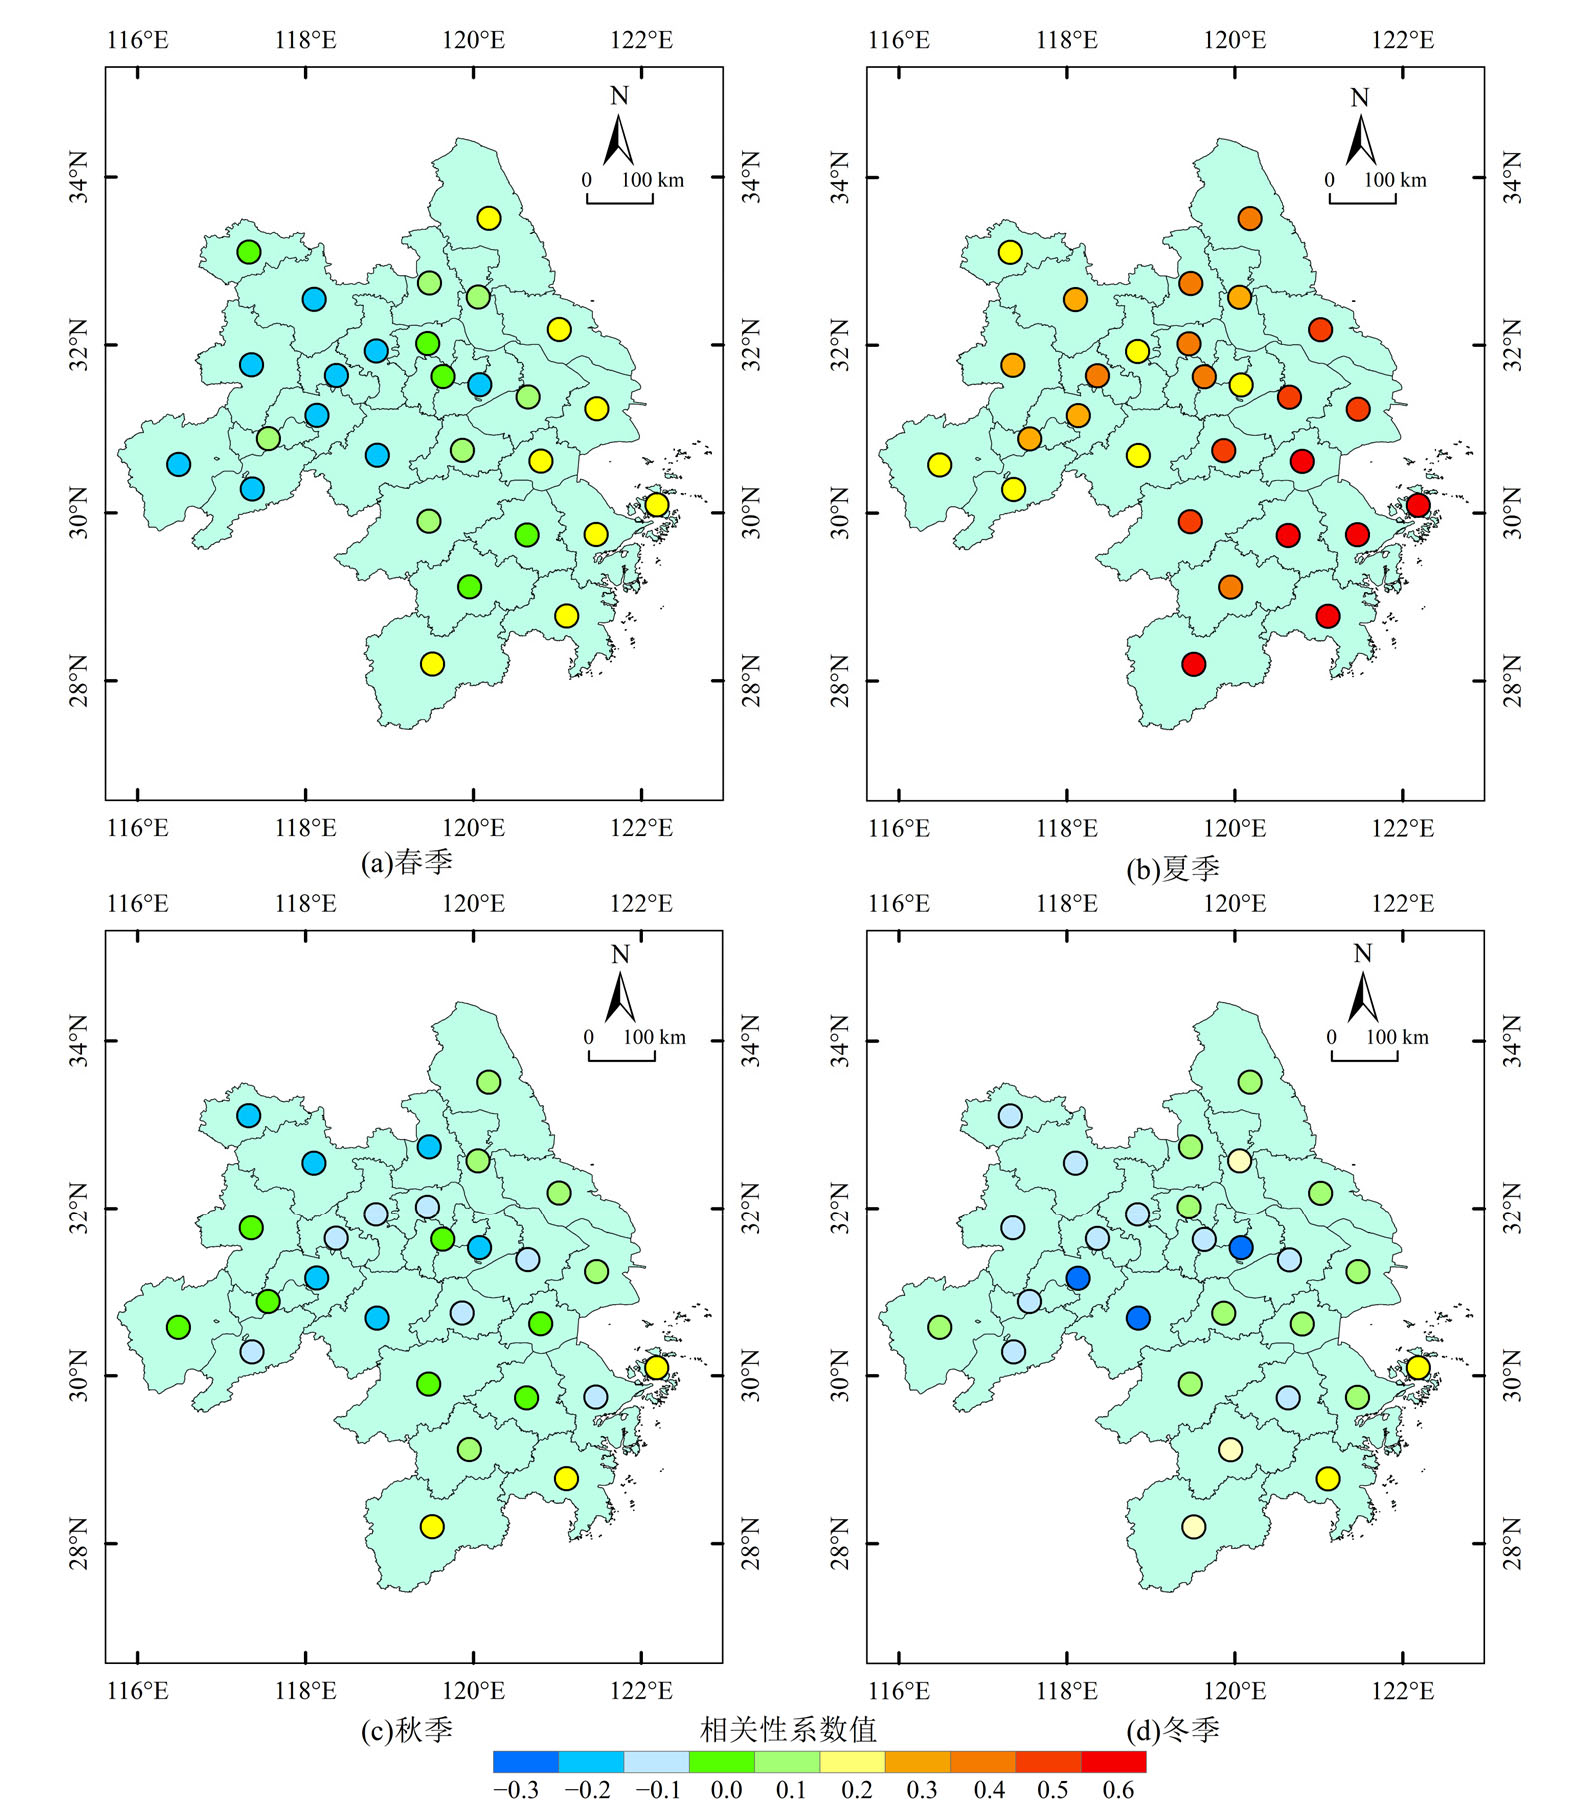
图5 长三角城市群PM2.5与O3季节质量浓度相关性时空分布特征
Figure 5 Spatial temporal changes of PM2.5 and O3 correlation in Yangtze River Delta
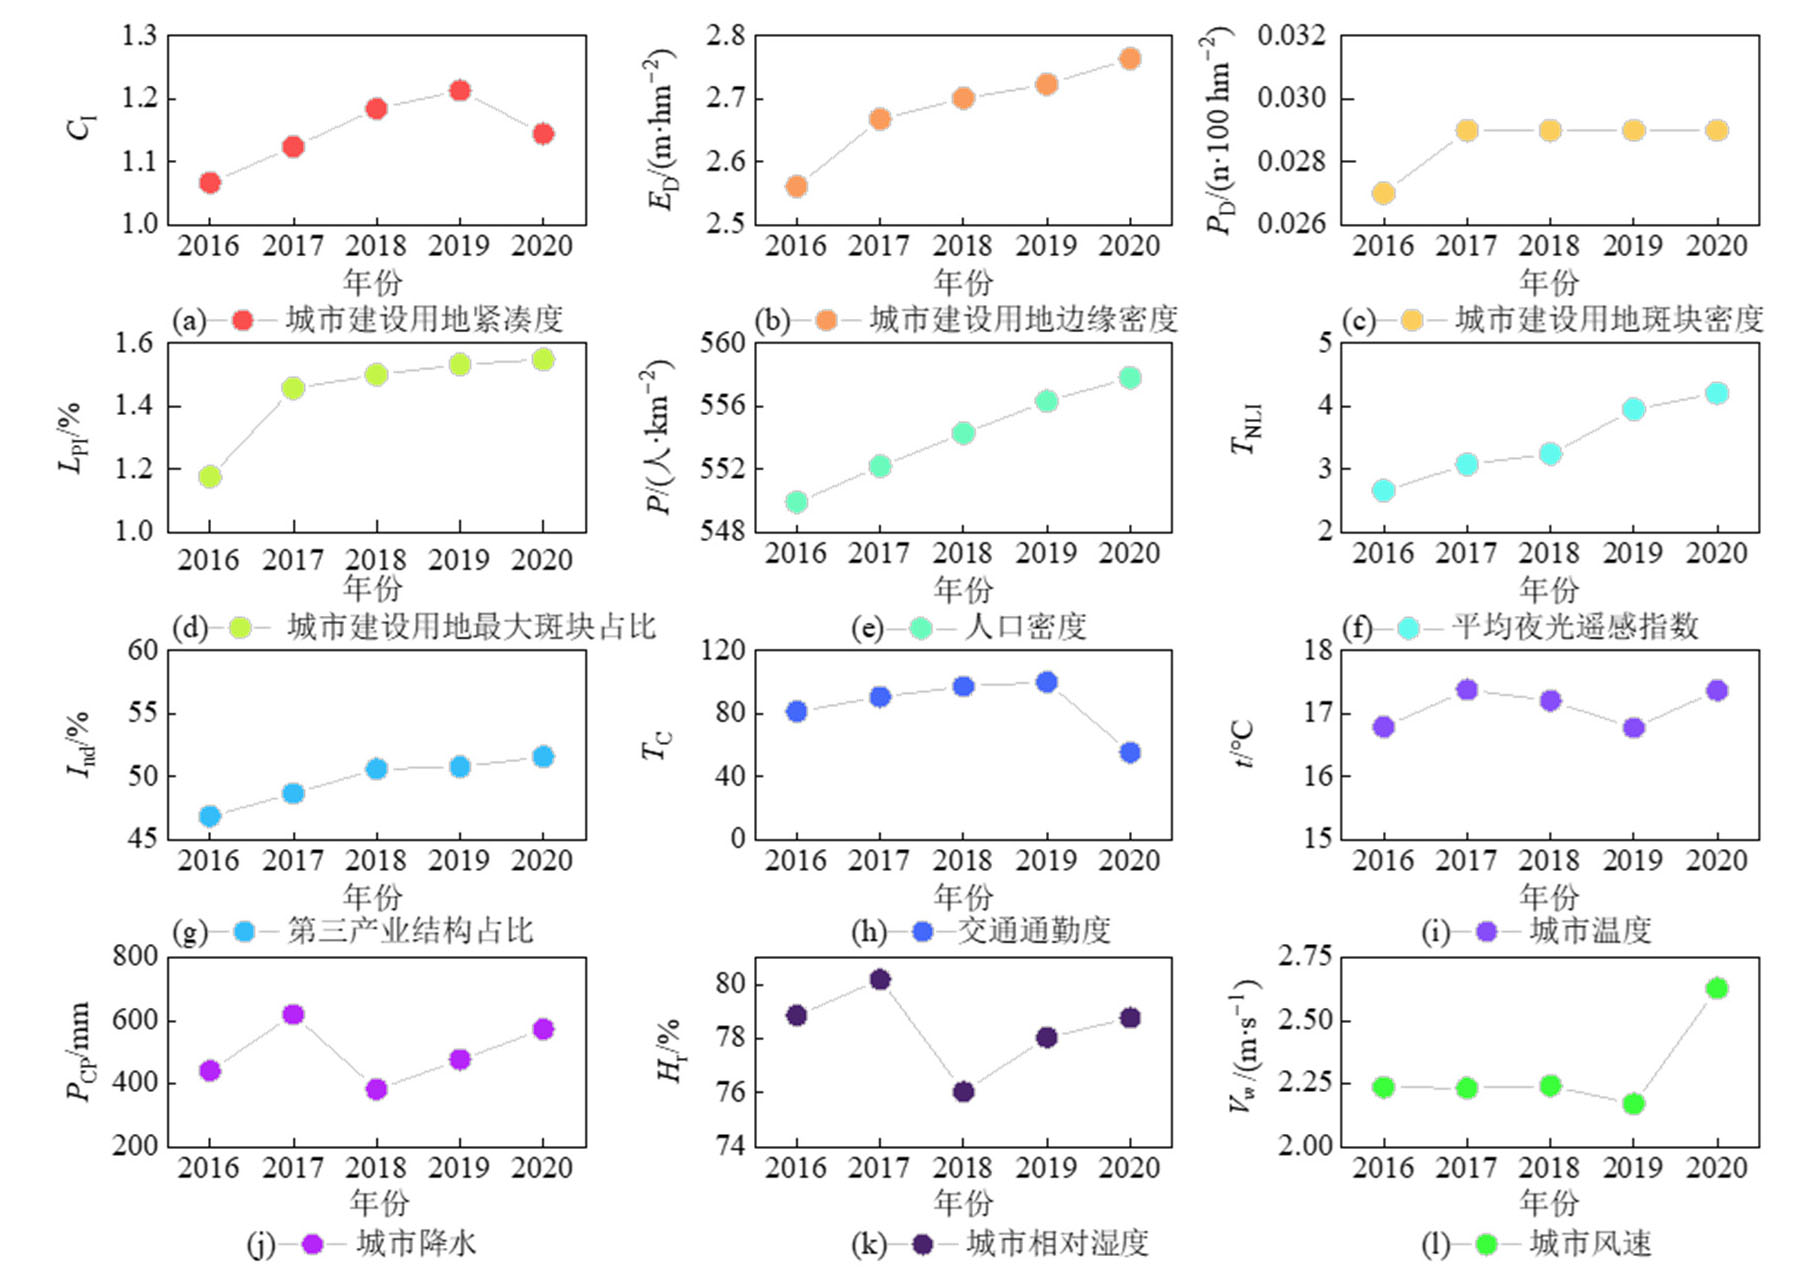
图6 长三角城市群城市空间形态及气象要素时间变化特征
Figure 6 Temporal changes in the urban morphology and meteorological of the Yangtze River Delta

图7 长三角城市群城市空间形态及气象要素时空演变特征
Figure 7 Spatial and temporal changes of the urban morphology and meteorological of the Yangtze River Delta
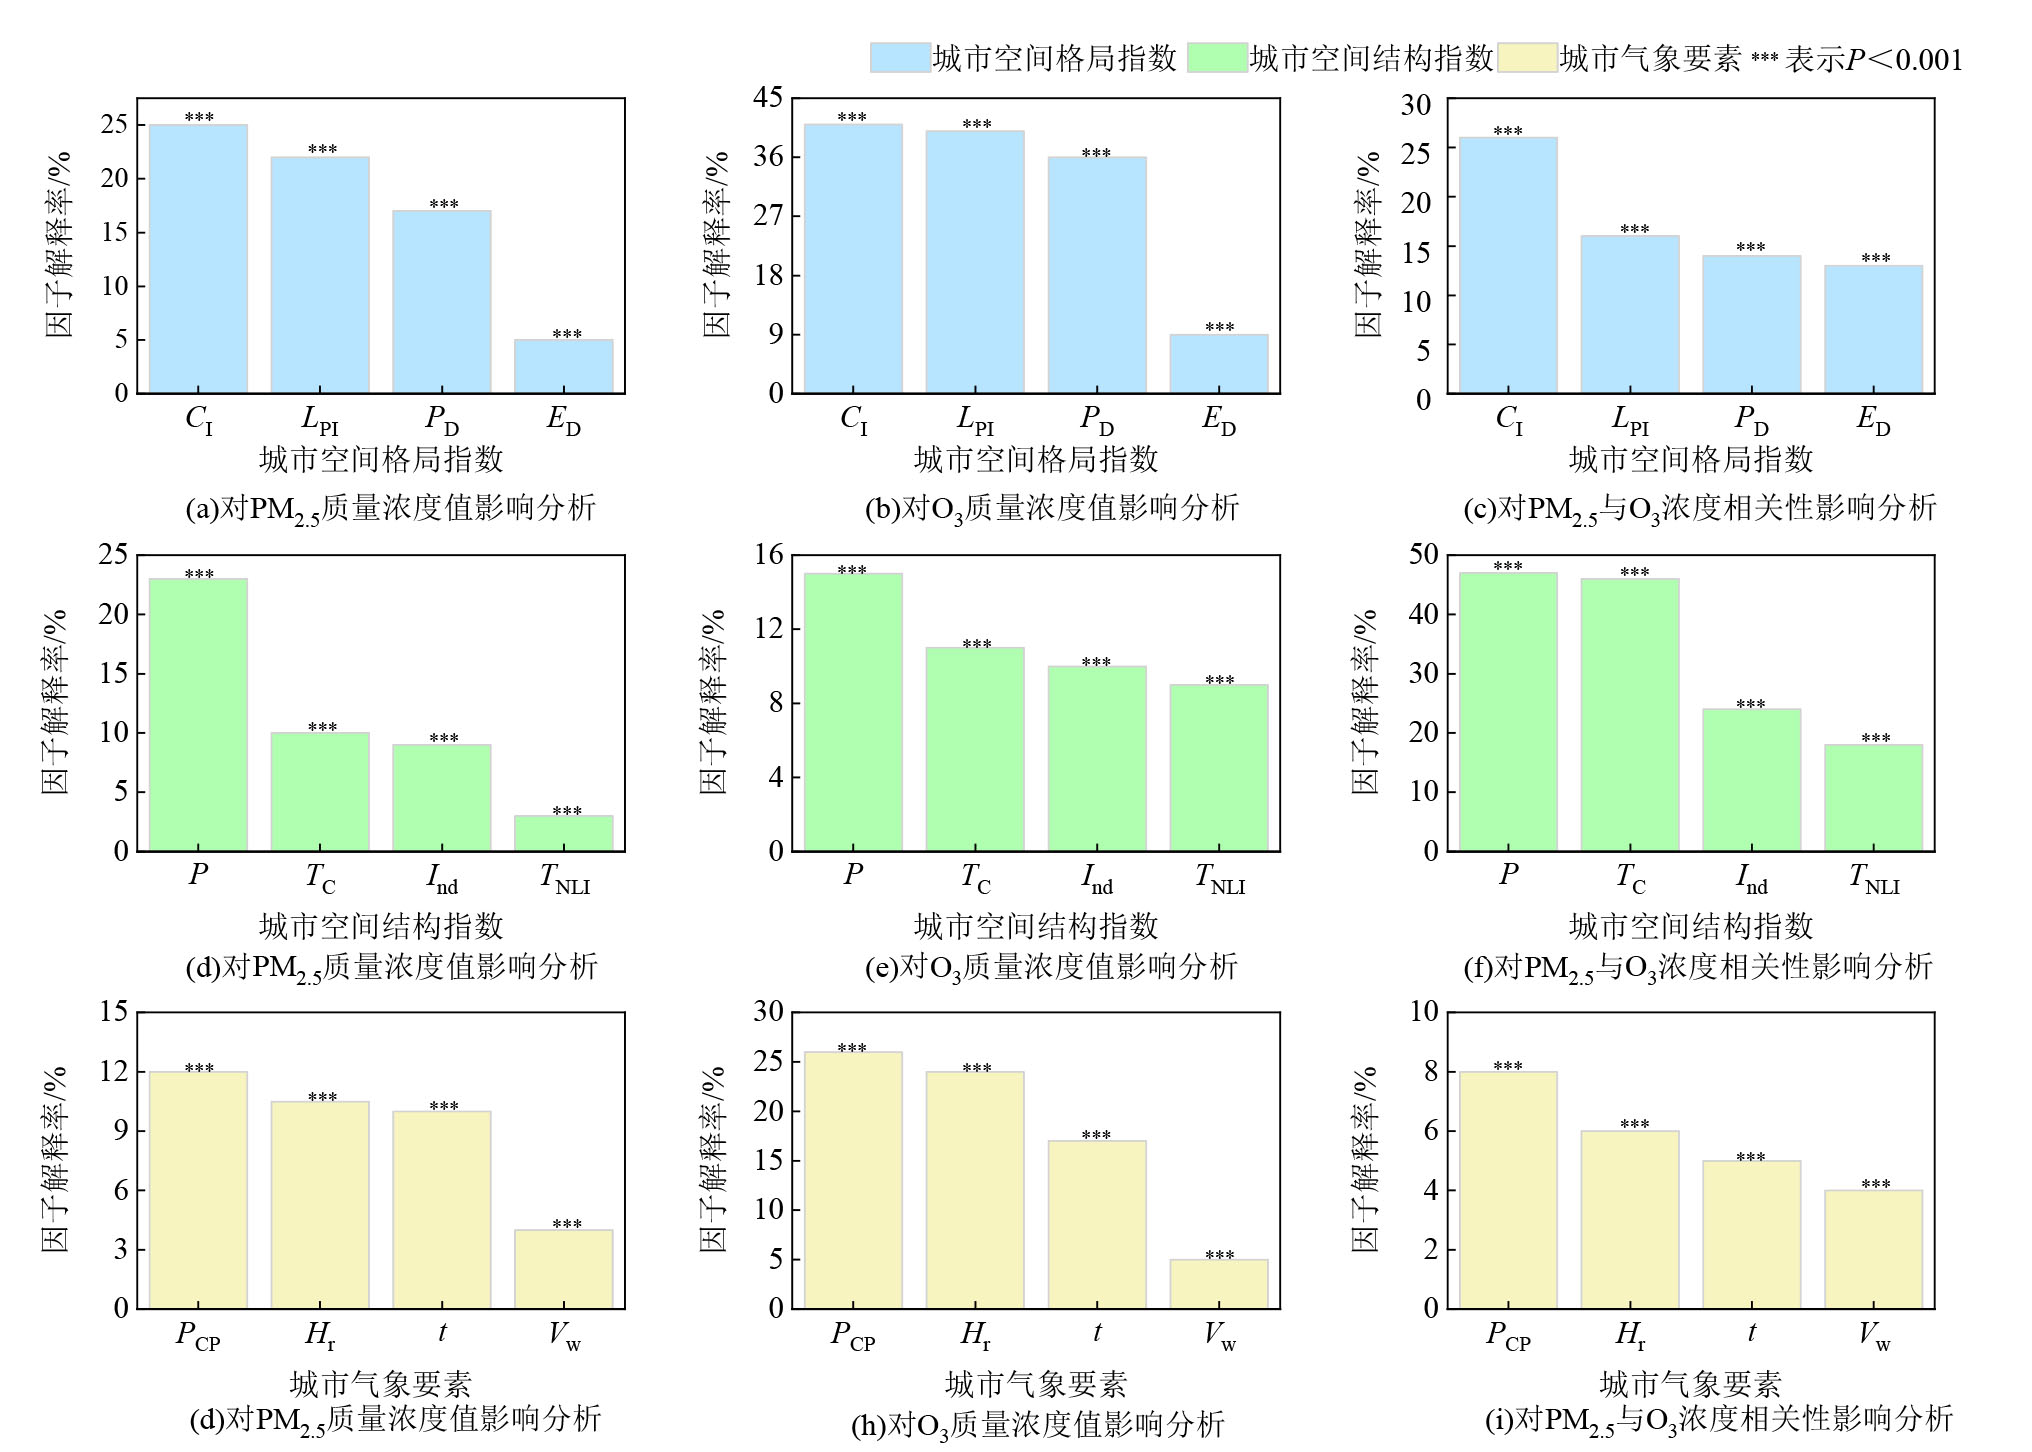
图8 长三角城市群城市PM2.5与O3空间异质性单因子驱动分析
Figure 8 Factor analysis of PM2.5 and O3 spatial heterogeneity in the Yangtze River Delta
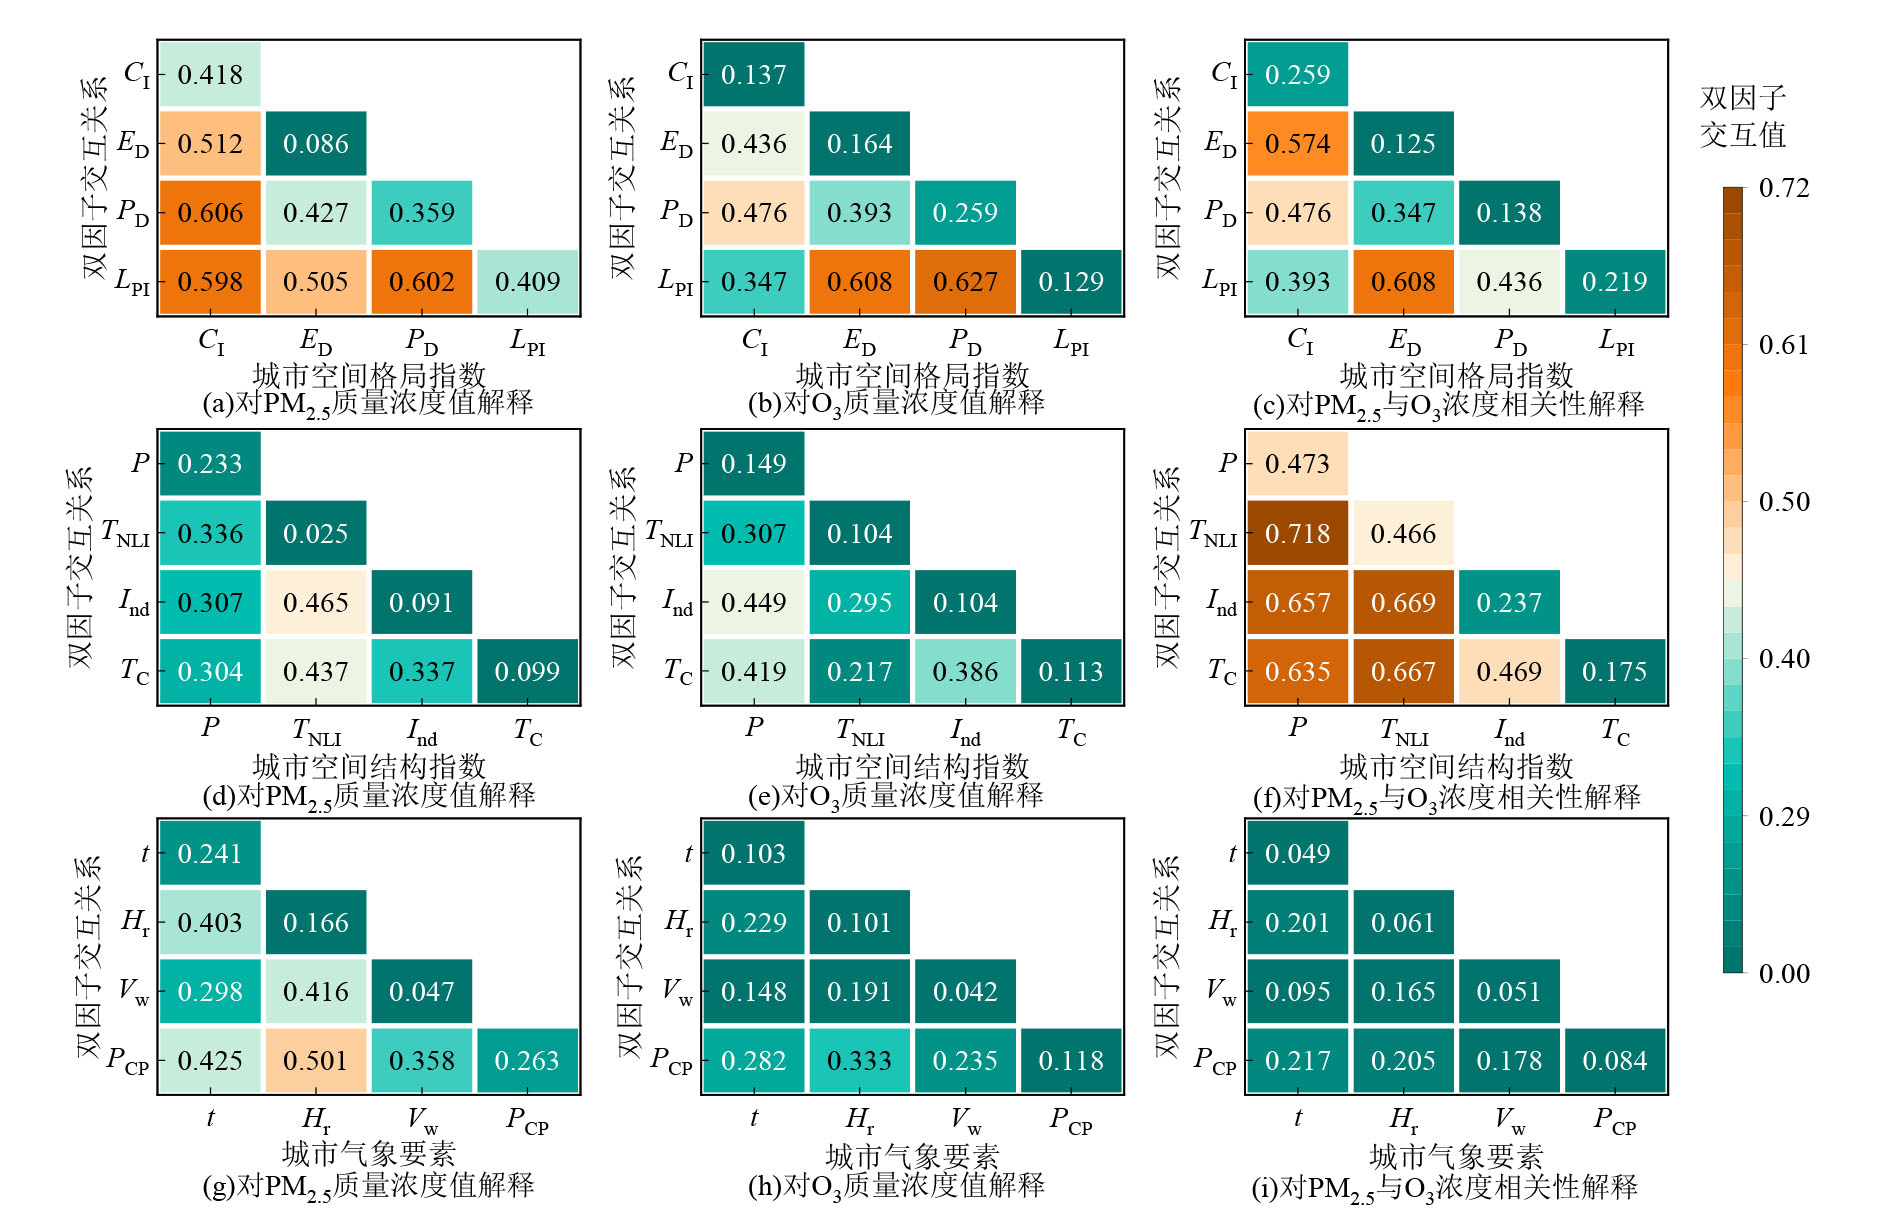
图9 长三角城市群PM2.5与O3交互分析
Figure 9 Analysis of the interaction between PM2.5 and O3 in the Yangtze River Delta
| PM2.5交互 | 交互值 | 驱动机制 | O3交互 | 交互值 | 驱动机制 | 相关性交互 | 交互值 | 驱动机制 |
|---|---|---|---|---|---|---|---|---|
| CI∩ED | 0.512 | 非线性增强 | CI∩ED | 0.436 | 非线性增强 | CI∩ED | 0.574 | 非线性增强 |
| CI ∩PD | 0.606 | 相互增强 | CI∩PD | 0.476 | 相互增强 | CI ∩PD | 0.476 | 非线性增强 |
| CI∩LPI | 0.598 | 相互增强 | CI∩LPI | 0.347 | 相互增强 | CI∩LPI | 0.393 | 相互增强 |
| P∩TNLI | 0.336 | 相互增强 | P∩TNLI | 0.307 | 非线性增强 | P∩TNLI | 0.718 | 相互增强 |
| P∩Ind | 0.307 | 相互增强 | P∩Ind | 0.449 | 非线性增强 | P∩Ind | 0.657 | 相互增强 |
| P∩TC | 0.304 | 非线性增强 | P∩TC | 0.419 | 非线性增强 | P∩TC | 0.635 | 相互增强 |
| PCP∩t | 0.425 | 非线性增强 | PCP∩t | 0.282 | 相互增强 | PCP∩t | 0.217 | 非线性增强 |
| PCP∩Hr | 0.501 | 非线性增强 | PCP∩Hr | 0.333 | 非线性增强 | PCP∩Hr | 0.205 | 相互增强 |
| PCP∩Vw | 0.358 | 非线性增强 | PCP∩Vw | 0.235 | 相互增强 | PCP∩Vw | 0.178 | 非线性增强 |
表4 长三角城市群城市空PM2.5与O3交互驱动机制
Table 4 Interactive driving mechanism between PM2.5 and O3 in the Yangtze River Delta
| PM2.5交互 | 交互值 | 驱动机制 | O3交互 | 交互值 | 驱动机制 | 相关性交互 | 交互值 | 驱动机制 |
|---|---|---|---|---|---|---|---|---|
| CI∩ED | 0.512 | 非线性增强 | CI∩ED | 0.436 | 非线性增强 | CI∩ED | 0.574 | 非线性增强 |
| CI ∩PD | 0.606 | 相互增强 | CI∩PD | 0.476 | 相互增强 | CI ∩PD | 0.476 | 非线性增强 |
| CI∩LPI | 0.598 | 相互增强 | CI∩LPI | 0.347 | 相互增强 | CI∩LPI | 0.393 | 相互增强 |
| P∩TNLI | 0.336 | 相互增强 | P∩TNLI | 0.307 | 非线性增强 | P∩TNLI | 0.718 | 相互增强 |
| P∩Ind | 0.307 | 相互增强 | P∩Ind | 0.449 | 非线性增强 | P∩Ind | 0.657 | 相互增强 |
| P∩TC | 0.304 | 非线性增强 | P∩TC | 0.419 | 非线性增强 | P∩TC | 0.635 | 相互增强 |
| PCP∩t | 0.425 | 非线性增强 | PCP∩t | 0.282 | 相互增强 | PCP∩t | 0.217 | 非线性增强 |
| PCP∩Hr | 0.501 | 非线性增强 | PCP∩Hr | 0.333 | 非线性增强 | PCP∩Hr | 0.205 | 相互增强 |
| PCP∩Vw | 0.358 | 非线性增强 | PCP∩Vw | 0.235 | 相互增强 | PCP∩Vw | 0.178 | 非线性增强 |
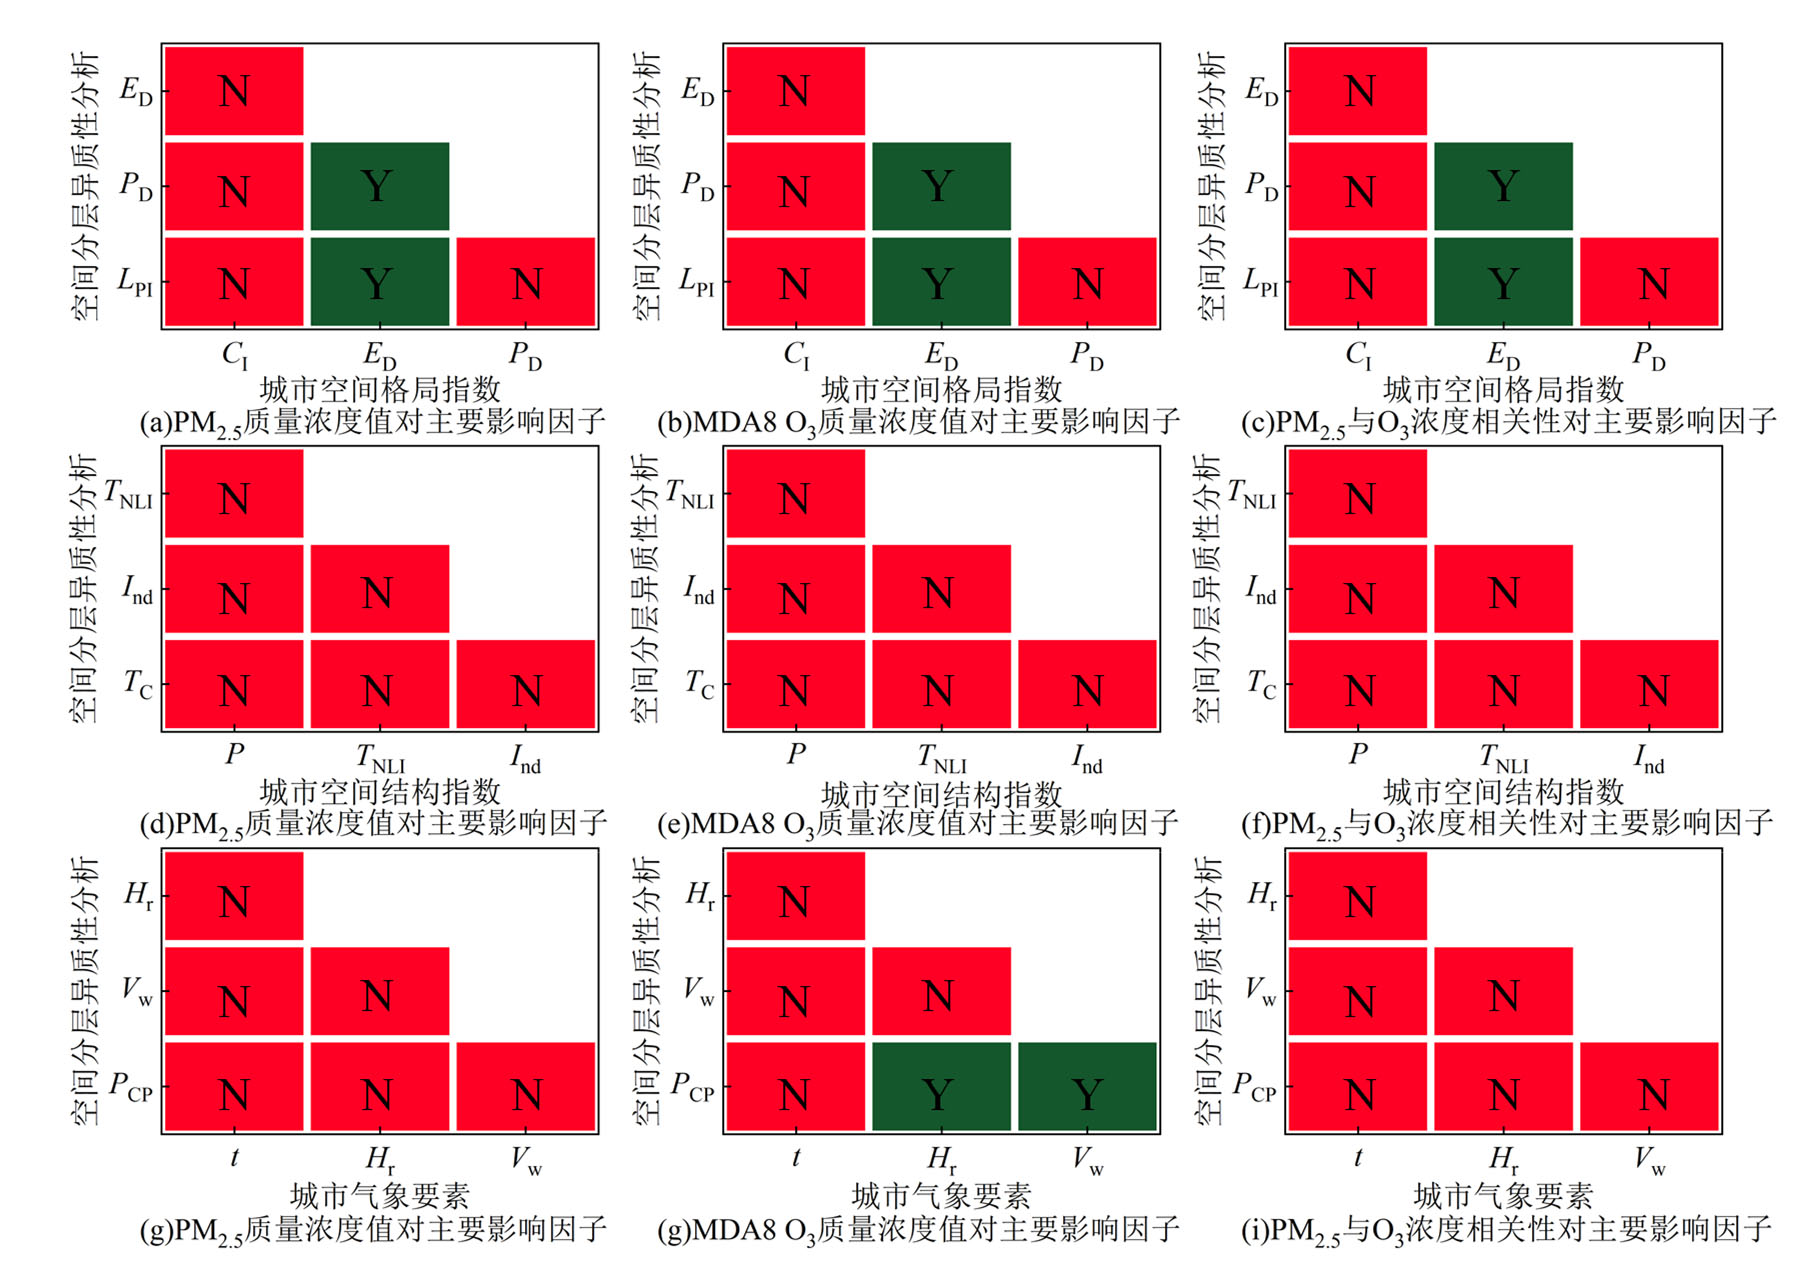
图10 长三角城市群城市PM2.5与O3空间分层异质性分析
Figure 10 Significance analysis of the spatial interaction between PM2.5 and O3 in the Yangtze River Delta
| [1] |
ALONSO W, 1971. The economics of urban size[J]. Papers of the Regional Science Association, 26: 66-83.
DOI URL |
| [2] |
ANSELIN L, GETIS A, 1992. Spatial statistical analysis and geographic information systems[J]. The Annals of Regional Science, 26: 19-33.
DOI URL |
| [3] |
BADACH J, WOJNOWSKI W, GĘBICKI J, 2023. Spatial aspects of urban air quality management: Estimating the impact of micro-scale urban form on pollution dispersion[J]. Computers, Environment and Urban Systems, 99: 101890.
DOI URL |
| [4] |
BECHLE M J, MILLET D B, MARSHALL J D, 2011. Effects of income and urban form on urban NO2: Global evidence from satellites[J]. Environmental science & technology, 45(11): 4914-4919.
DOI URL |
| [5] | CHANG Y, HUANG R J, GE X, et al., 2020. Puzzling haze events in China during the coronavirus (COVID‐19) shutdown[J]. Geophysical Research Letters, 47(12): e2020GL088533. |
| [6] | CHEN H M, ZHUANG B L, LIU J, et al., 2019. Characteristics of ozone and particles in the near-surface atmosphere in the urban area of the Yangtze River Delta, China[J]. Atmospheric Chemistry and Physics, 19(7): 4153-4175. |
| [7] |
CHEN J D, WANG B, HUANG S, et al., 2020. The influence of increased population density in China on air pollution[J]. Science of the Total Environment, 735: 139456.
DOI URL |
| [8] | CHU B W, MA Q X, LIU J, et al., 2020. Air pollutant correlations in China: secondary air pollutant responses to NOx and SO2 control[J]. Environmental Science & Technology Letters, 7(10): 695-700. |
| [9] |
CILEK M U, CILEK A, 2021. Analyses of land surface temperature (LST) variability among local climate zones (LCZs) comparing Landsat-8 and ENVI-met model data[J]. Sustainable Cities and Society, 69: 102877.
DOI URL |
| [10] |
DONG Z X, XING J, ZHANG F F, et al., 2023. Synergetic PM2.5 and O3 control strategy for the Yangtze River Delta, China[J]. Journal of Environmental Sciences, 123: 281-291.
DOI URL |
| [11] |
DUAN W J, WANG X Q, CHENG S Y, et al., 2021. Influencing factors of PM2.5 and O3 from 2016 to 2020 based on DLNM and WRF-CMAQ[J]. Environmental Pollution, 285: 117512.
DOI URL |
| [12] |
GAO J, O’NEILL B C, 2020. Mapping global urban land for the 21st century with data-driven simulations and Shared Socioeconomic Pathways[J]. Nature communications, 11(1): 2302.
DOI PMID |
| [13] |
HAN L J, ZHOU W Q, LI W F, et al., 2018. Urbanization strategy and environmental changes: An insight with relationship between population change and fine particulate pollution[J]. Science of the total environment, 642: 789-799.
DOI URL |
| [14] |
HUANG C Y, HU T T, DUAN Y S, et al., 2022. Effect of urban morphology on air pollution distribution in high-density urban blocks based on mobile monitoring and machine learning[J]. Building and Environment, 219: 109173.
DOI URL |
| [15] |
JIA Y Q, TANG L, XU M, et al., 2019. Landscape pattern indices for evaluating urban spatial morphology: A case study of Chinese cities[J]. Ecological indicators, 99: 27-37.
DOI URL |
| [16] |
LI G D, FANG C L, LI Y J, et al., 2022. Global impacts of future urban expansion on terrestrial vertebrate diversity[J]. Nature communications, 13(1): 1628.
DOI PMID |
| [17] |
LI K, JACOB D J, LIAO H, et al., 2019. A two-pollutant strategy for improving ozone and particulate air quality in China[J]. Nature Geoscience, 12(11): 906-910.
DOI |
| [18] | LI Y, ZHAO X J, DENG X J, et al., 2022. The impact of peripheral circulation characteristics of typhoon on sustained ozone episodes over the Pearl River Delta region, China[J]. Atmospheric Chemistry and Physics, 22(6): 3861-3873. |
| [19] |
LOU S J, LIAO H, ZHU B, 2014. Impacts of aerosols on surface-layer ozone concentrations in China through heterogeneous reactions and changes in photolysis rates[J]. Atmospheric Environment, 85: 123-138.
DOI URL |
| [20] |
LU C, LIU Y, 2016. Effects of China’s urban form on urban air quality[J]. Urban studies, 53(12): 2607-2623.
DOI URL |
| [21] |
MA T, DUAN F K, HE K, et al., 2019. Air pollution characteristics and their relationship with emissions and meteorology in the Yangtze River Delta region during 2014-2016[J]. Journal of Environmental Sciences, 83(6): 8-20.
DOI URL |
| [22] |
MAHADY J A, OCTAVIANO C, ARAIZA BOLANOS O S, et al., 2020. Mapping opportunities for transportation electrification to address social marginalization and air pollution challenges in Greater Mexico City[J]. Environmental science & technology, 54(4): 2103-2111.
DOI URL |
| [23] |
MUÑIZ I, GALINDO A, 2005. Urban form and the ecological footprint of commuting. The case of Barcelona[J]. Ecological Economics, 55(4): 499-514.
DOI URL |
| [24] |
QIN Y, LI J Y, GONG K J, et al., 2021. Double high pollution events in the Yangtze River Delta from 2015 to 2019: Characteristics, trends, and meteorological situations[J]. Science of the Total Environment, 792(12): 148349.
DOI URL |
| [25] | SHI Z H, HUANG L, LI J Y, et al., 2020. Sensitivity analysis of the surface ozone and fine particulate matter to meteorological parameters in China[J]. Atmospheric Chemistry and Physics, 20(21): 13455-13466. |
| [26] |
STONE JR B, 2008. Urban sprawl and air quality in large US cities[J]. Journal of environmental management, 86(4): 688-698.
PMID |
| [27] |
TANG R, ZHAO J, LIU Y F, et al., 2022. Air quality and health co-benefits of China’s carbon dioxide emissions peaking before 2030[J]. Nature communications, 13(1): 1008.
DOI |
| [28] |
WANG J F, ZHANG T L, FU B J, 2016. A measure of spatial stratified heterogeneity[J]. Ecological indicators, 67: 250-256.
DOI URL |
| [29] |
WANG N, HUANG X, XU J W, et al., 2022. Typhoon-boosted biogenic emission aggravates cross-regional ozone pollution in China[J]. Science Advances, 8(2): eabl6166.
DOI URL |
| [30] |
WANG P F, GUO H, HU J L, et al., 2019. Responses of PM2.5 and O3 concentrations to changes of meteorology and emissions in China[J]. Science of the Total Environment, 662: 297-306.
DOI URL |
| [31] |
WU R, DAI H C, GENG Y, et al., 2017. Economic impacts from PM2.5 pollution-related health effects: A case study in Shanghai[J]. Environmental science & technology, 51(9): 5035-5042.
DOI URL |
| [32] |
YANG J, HUANG X, 2021. The 30 m annual land cover dataset and its dynamics in China from 1990 to 2019[J]. Earth System Science Data, 13(8): 3907-3925.
DOI URL |
| [33] | ZHANG L, CHEN B, FU H, 2021. A Prolonged Artificial Nighttime-light Dataset of China (1984-2020) [Z]. National Tibetan Plateau Data Center. |
| [34] | 陈珍启, 林雄斌, 李莉, 等, 2016. 城市空间形态影响碳排放吗?——基于全国110个地级市数据的分析[J]. 生态经济, 32(10): 22-26. |
| CHEN Z Q, LIN X B, LI L, et al., 2016. Does urban spatial morphology affect carbon emission?: A study based on 110 prefectural cities[J]. Ecological Economy, 32(10): 22-26. | |
| [35] |
方创琳, 2014. 中国城市群研究取得的重要进展与未来发展方向[J]. 地理学报, 69(8): 1130-1144.
DOI |
|
FANG C L, 2014. Progress and the future direction of research into urban agglomeration in China[J]. Acta Geographica Sinica, 69(8): 1130-1144.
DOI |
|
| [36] | 郭云, 王建生, 留莹莹, 等, 2021. 空气质量健康指数构建及与现有评价体系的比较: 以丽水市为例[J]. 环境科学研究, 34(10): 2517-2524. |
| GUO Y, WANG J S, LIU Y Y, et al., 2021. Establishment of air quality health index and comparison with existing evaluation system in Lishui[J]. Research of Environmental Sciences, 34(10): 2517-2524. | |
| [37] |
郝永佩, 宋晓伟, 赵文珺, 等, 2022. 汾渭平原大气污染时空分布及相关因子分析[J]. 生态环境学报, 31(3): 512-523.
DOI |
| HAO Y P, SONG X W, ZHAO W J, et al., 2022. Spatiotemporal distribution of air pollution and correlation factors in Fenwei Plain[J]. Ecology and Environment, 31(3): 512-523. | |
| [38] | 环境保护部, 国家质量监督检验检疫总局, 2012. 环境空气质量标准: GB 3095—2012[S]. 北京: 中国环境出版集团: 1-6. |
| Ministry of Environmental Protection, General Administration of Quality Supervision, Inspection and Quarantine, 2012. Ambient Air Qualiy Standards: GB 3095—2012[S]. Beijing: China Environment Publishing Group: 1-6. | |
| [39] | 黎文勇, 2023. 长三角城市群空间功能分工对雾霾污染的影响效应研究[J]. 长江流域资源与环境, 32(1): 40-50. |
| LI W Y, 2023. Research on effects of the spatial function division of Yangtze River Delta urban agglomeration on haze pollution[J]. Resources and Environment in the Yangtze Basin, 32(1): 40-50. | |
| [40] |
林昕, 段焜瑀, 郭弘, 等, 2023. 极端高温形势下福州市臭氧浓度异常升高及影响因素分析[J]. 生态环境学报, 32(2): 320-330.
DOI |
| LIN X, DUAN K Y, GUO H, et al., 2023. The Causes of the abnormal increase of ozone in Fuzhou City under extreme high temperature[J]. Ecology and Environmental Sciences, 32(2): 320-330. | |
| [41] | 宁越敏, 2011. 中国都市区和大城市群的界定——兼论大城市群在区域经济发展中的作用[J]. 地理科学, 31(3): 257-263. |
| NING Y M, 2011. Definition of Chinese metropolitan areas and large urban agglomerations: Role of large urban agglomerations in regional development[J]. Acta Geographica Sinica, 31(3): 257-263. | |
| [42] | 潘竟虎, 戴维丽, 2015. 1990-2010年中国主要城市空间形态变化特征[J]. 经济地理, 35(1): 44-52. |
| PAN J H, DAI W L, 2015. Spatial-temporal characteristics in urban morphology of major cities in China during 1990-2010[J]. Economic Geography, 35(1): 44-52. | |
| [43] | 邵平, 辛金元, 安俊琳, 等, 2017. 长三角工业区夏季近地层臭氧和颗粒物污染相互关系研究[J]. 大气科学, 41(3): 618-628. |
| SHAO P, XIN J Y, AN J L, et al., 2017. An analysis on the relationship between ground-level ozone and particulate matter in an industrial area in the Yangtze River delta during summertime[J]. Chinese Journal of Atmospheric Sciences, 41(3): 618-628. | |
| [44] | 生态环境部, 2021. 2020年中国生态环境状况公报 (摘录)[J]. 环境保护, 49(11): 47-68. |
| Ministry of Ecology and Environment, 2021. China ecological environment status bulletin 2021 (Excerpt)[J]. Environmental Protection, 49(11): 47-68. | |
| [45] | 孙金金, 谢晓栋, 秦墨梅, 等, 2022. 不同时间尺度上PM2.5与臭氧协同关系及其影响因素分析[J]. 科学通报, 67(18): 2018-2028. |
| SUN J J, XIE X D, QIN M M, et al., 2022. Analysis of coordinated relationship between PM2.5 and ozone and its affecting factors on different timescales[J]. Chinese Science Bulletin, 67(18): 2018-2028. | |
| [46] | 王国爱, 李同升, 2009. “新城市主义” 与 “精明增长” 理论进展与评述[J]. 规划师, 25(4): 67-71. |
| WANG A G, LI T S, 2009. A review on the study of new urbanism and smart growth theories[J]. Planners, 25(4): 67-71. | |
| [47] |
王劲峰, 徐成东, 2017. 地理探测器: 原理与展望[J]. 地理学报, 72(1): 116-134.
DOI |
|
WANG J F, XU C D, 2017. Geodetector: Principle and prospective[J]. Acta Geographica Sinica, 72(1): 116-134.
DOI |
|
| [48] |
王薇, 程歆玥, 2022. 合肥市不同功能街道峡谷PM2.5和PM10时空分布特征及影响因素分析[J]. 生态环境学报, 31(3): 524-534.
DOI |
| WANG W, CHENG X Y, 2022. Analysis of temporal and spatial distribution characteristics and influencing factors of PM2.5 and PM10 in different functional street canyons in Hefei City[J]. Ecology and Environment, 31(3): 524-534. | |
| [49] | 王新生, 刘纪远, 庄大方, 等, 2005. 中国特大城市空间形态变化的时空特征[J]. 地理学报, 60(3): 392-400. |
|
WANG X S, LIU J Y, ZHUANG D F, et al., 2005. Spatial-temporal changes of urban spatial morphology in China[J]. Acta Geographica Sinica, 60(3): 392-400.
DOI |
|
| [50] | 吴文坤, 曾惠娴, 郭春华, 等, 2023. 城市形态对广州市生境质量的影响[J]. 生态科学, 42(5): 203-212. |
| WU W K, CENG H X, GUO C H, et al., 2023. The impact of urban morphology on habitat quality in Guangzhou[J]. Ecological Science, 42(5): 203-212. | |
| [51] |
吴雅睿, 王美景, 王涛, 等, 2023. 新冠疫情下NO2时空变化特征——以陕西省为例[J]. 生态环境学报, 32(3): 514-524.
DOI |
| WU Y R, WANG M J, WANG T, et al., 2023. Effect of COVID-19 on temporal and spatial distribution of NO2 concentration and socio-economic life: A case study of Shaanxi Province[J]. Ecology and Environment, 32(3): 514-524. | |
| [52] |
易嘉慧, 何超, 杨璐, 等, 2022. COVID-19疫情期间全球气温和主要大气污染物浓度变化的空间关联[J]. 生态环境学报, 31(4): 740-749.
DOI |
| YI J H, HE C, YANG L, et al., 2022. Spatial correlation between changes in global temperature and major air pollutants during the COVID-19 pandemic[J]. Ecology and Environment, 31(4): 740-749. | |
| [53] | 张涵, 姜华, 高健, 等, 2022. PM2.5与臭氧污染形成机制及协同防控思路[J]. 环境科学研究, 35(3): 611-620. |
| ZHANG H, JIANG H, GAO J, et al., 2022. Formation mechanism and management strategy of cooperative control of PM2.5 and O3[J]. Research of Environmental Sciences, 35(3): 611-620. |
| [1] | 田成诗, 孙瑞欣. 长江经济带市域生态环境质量空间分异与影响因素分析——基于三生空间的土地利用转型[J]. 生态环境学报, 2023, 32(7): 1173-1184. |
| [2] | 王琳, 卫伟. 黄土高原典型县域生态系统服务变化特征及驱动因素[J]. 生态环境学报, 2023, 32(6): 1140-1148. |
| [3] | 李建辉, 党争, 陈琳. 黄河几字弯都市圈PM2.5时空特征及影响因素分析[J]. 生态环境学报, 2023, 32(4): 697-705. |
| [4] | 王成武, 罗俊杰, 唐鸿湖. 基于InVEST模型的太行山沿线地区生态系统碳储量时空分异驱动力分析[J]. 生态环境学报, 2023, 32(2): 215-225. |
| [5] | 肖成志, 计扬, 李建忠, 张志, 巴仁基, 曹亚廷. 岷江上游生态脆弱性时空分异及驱动因子交互效应分析——以杂谷脑河流域为例[J]. 生态环境学报, 2023, 32(10): 1760-1770. |
| [6] | 付蓉, 武新梅, 陈斌. 城市地表温度空间分异及驱动因子差异性分析——以合肥市为例[J]. 生态环境学报, 2023, 32(1): 110-122. |
| [7] | 陈文裕, 夏丽华, 徐国良, 余世钦, 陈行, 陈金凤. 2000—2020年珠江流域NDVI动态变化及影响因素研究[J]. 生态环境学报, 2022, 31(7): 1306-1316. |
| [8] | 李梦华, 韩颖娟, 赵慧, 王云霞. 基于地理探测器的宁夏植被覆盖度时空变化特征及其驱动因子分析[J]. 生态环境学报, 2022, 31(7): 1317-1325. |
| [9] | 高思琦, 董国涛, 蒋晓辉, 聂桐, 郭欣伟, 党素珍, 李心宇, 李昊洋. 黄河源植被覆盖度变化及空间分布自然驱动力分析[J]. 生态环境学报, 2022, 31(3): 429-439. |
| [10] | 赵锐, 詹梨苹, 周亮, 张军科. 地理探测联合地理加权岭回归的PM2.5驱动因素分析[J]. 生态环境学报, 2022, 31(2): 307-317. |
| [11] | 杨艳, 周德成, 宫兆宁, 刘子源, 张良侠. 基于植被生产力的黄土高原地区生态脆弱性及其控制因子分析[J]. 生态环境学报, 2022, 31(10): 1951-1958. |
| [12] | 聂桐, 董国涛, 蒋晓辉, 郭欣伟, 党素珍, 郑嘉昊, 李立缠, 王江. 榆林地区植被时空分异特征及其影响因素研究[J]. 生态环境学报, 2022, 31(1): 26-36. |
| [13] | 王金杰, 赵安周, 胡小枫. 京津冀植被净初级生产力时空分布及自然驱动因子分析[J]. 生态环境学报, 2021, 30(6): 1158-1167. |
| [14] | 张军, 高煜, 王国兰, 金梓函, 杨明航. 典型河谷城市土壤重金属含量空间分异及其影响因素[J]. 生态环境学报, 2021, 30(6): 1276-1285. |
| 阅读次数 | ||||||
|
全文 |
|
|||||
|
摘要 |
|
|||||