生态环境学报 ›› 2025, Vol. 34 ›› Issue (3): 333-344.DOI: 10.16258/j.cnki.1674-5906.2025.03.001
• 碳循环与碳减排专栏 •
下一篇
李曼1( ), 吴东丽2, 何昊1, 余慧婕1, 赵琳1, 刘聪2, 胡正华1,*(), 李琪1,*()
收稿日期:2024-06-17
出版日期:2025-03-18
发布日期:2025-03-24
通讯作者:
李琪。E-mail: liqix123@sina.com作者简介:李曼(1999年生),女,硕士研究生,研究方向为碳汇与生态遥感。E-mail: liman66622@163.com
基金资助:
LI Man1(), WU Dongli2, HE Hao1, YU Huijie1, ZHAO Lin1, LIU Cong2, HU Zhenghua1,*(), LI Qi1,*()
Received:2024-06-17
Online:2025-03-18
Published:2025-03-24
摘要:
准确估算区域尺度的陆地生态系统碳储量及其驱动因素,对于制定科学合理的土地利用政策具有重要意义。基于土地利用/覆被数据和气象站点数据,运用InVEST(Integrated Valuation of Ecosystem Services and Tradeoffs)模型定量估算了1990-2020年黄河流域碳储量的时空分布。通过土地利用转移矩阵和碳储量贡献率分析土地利用变化对碳储量的影响,并采用最优参数地理探测器(OPGD)识别碳储量空间分异性的主要驱动因素。结果表明,1990-2020年间,黄河流域耕地面积减少,而林地、草地、建设用地面积增加,碳储量值呈现波动上升趋势,增加了0.549×10⁸ t,增幅为0.37%,经历了1990-1995年和2005-2010年两个增加阶段,以及1995-2005年和2010-2020年两个减少阶段。碳储量的空间分布具有明显的异质性,碳储量变化呈现零散分布,增减不一的特点。极显著热点区集中在青海、陕西、内蒙古等森林覆盖较广泛的山区,冷点分布在经济发达地区。草地是主要碳储存类型,未利用地转为草地对碳储量贡献最大(73.3%),耕地转为建设用地对碳储量产生最大负效应(−20.8%)。在5 km最优空间尺度和因子最佳空间离散化参数下,单因子和交互探测分别显示,归一化植被指数(NDVI)是碳储量空间分异性的主要驱动因素(20.7%),坡度、降水和日照等因素也具有显著影响;归一化植被指数与高程的组合解释力最强,达到29.0%。综合考虑自然地理和气候因素,因地制宜地制定土地利用政策,平衡城市扩张、农业发展与生态保护,是实现区域碳储量增加的关键。
中图分类号:
李曼, 吴东丽, 何昊, 余慧婕, 赵琳, 刘聪, 胡正华, 李琪. 1990-2020年黄河流域碳储量时空演变及驱动因素研究[J]. 生态环境学报, 2025, 34(3): 333-344.
LI Man, WU Dongli, HE Hao, YU Huijie, ZHAO Lin, LIU Cong, HU Zhenghua, LI Qi. Spatio-temporal Evolution and Driving Factors of Carbon Storage in the Yellow River Basin from 1990 to 2020[J]. Ecology and Environment, 2025, 34(3): 333-344.
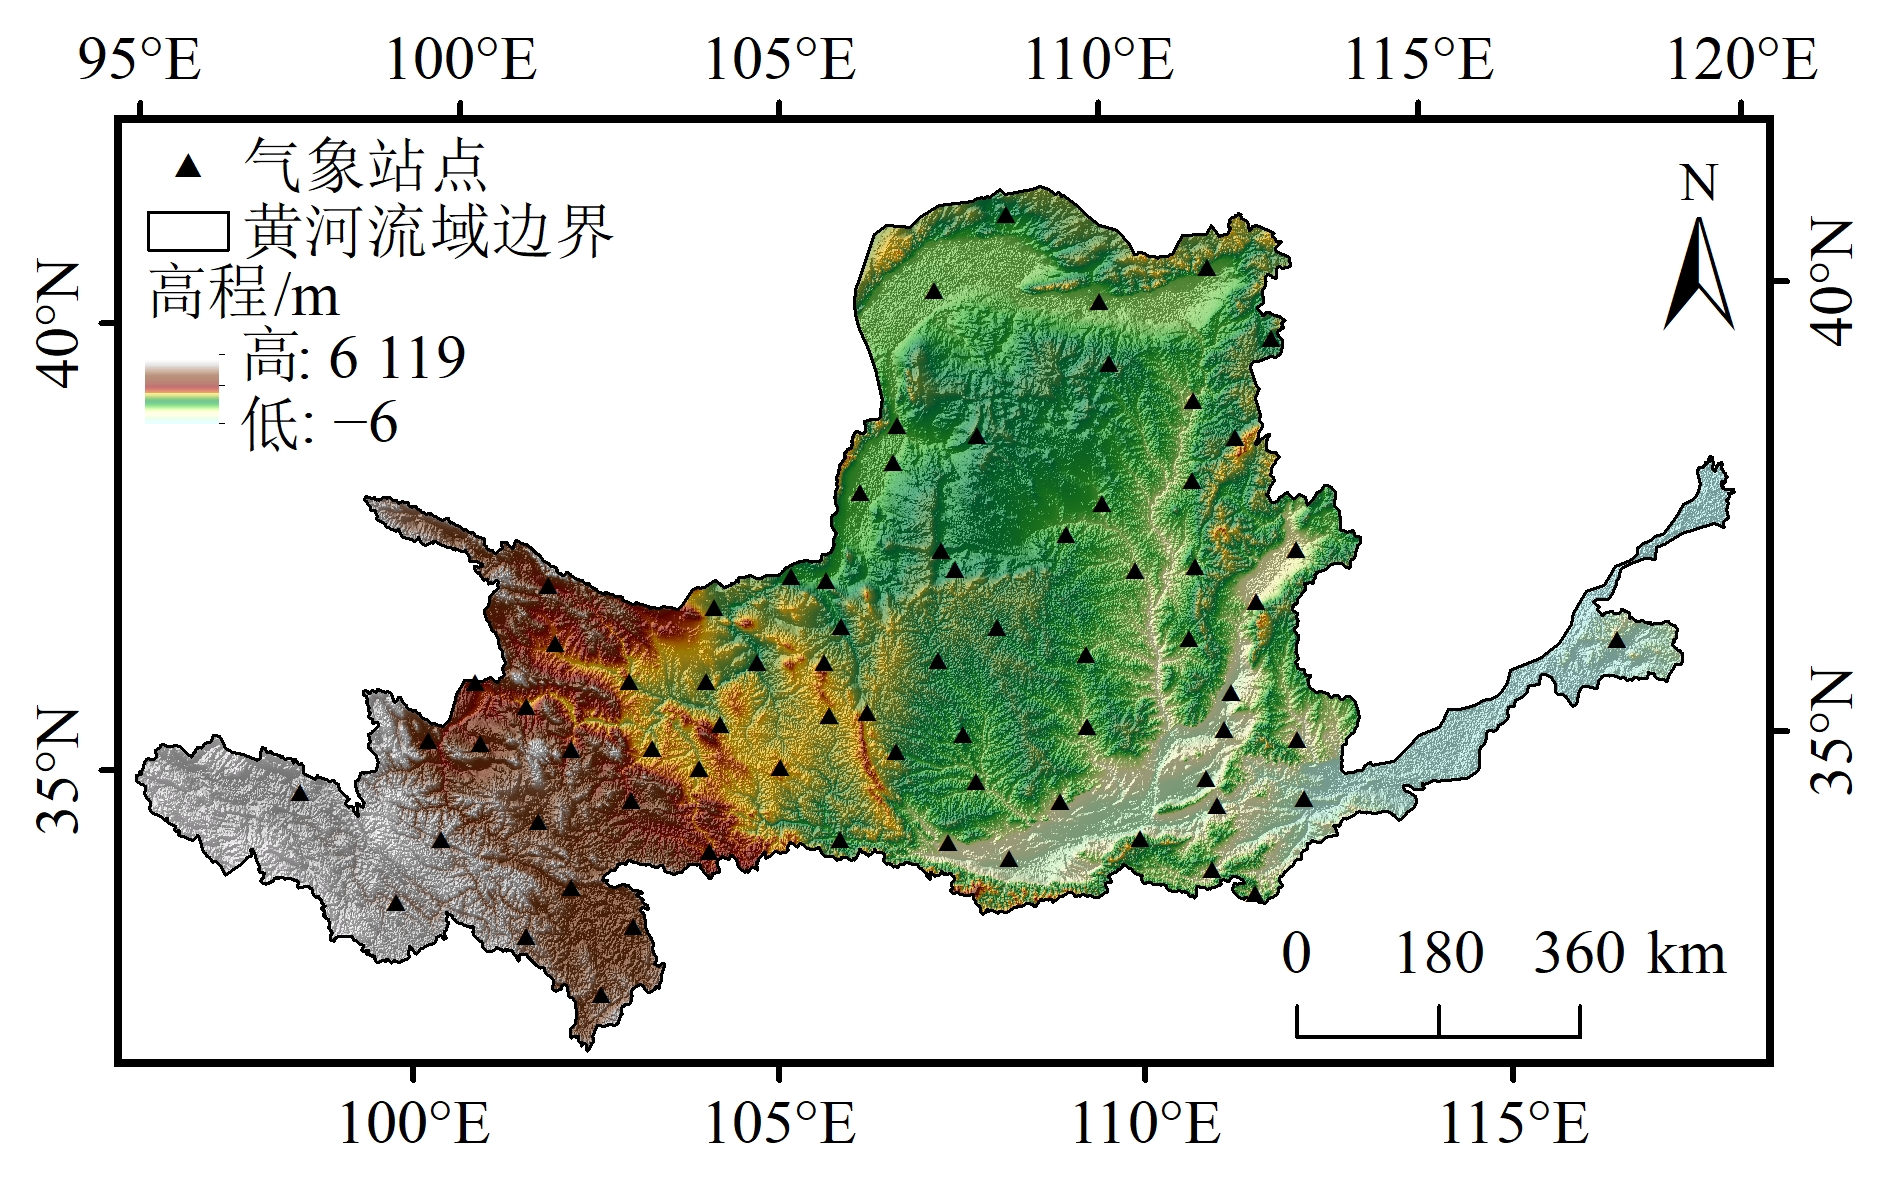
图1 研究区概况图
Figure 1 Overview of the study area
| 土地利用类型 | 地上碳密度 | 地下碳密度 | 土壤碳密度 |
|---|---|---|---|
| 耕地 | 17.0 | 80.7 | 108 |
| 林地 | 42.4 | 116 | 159 |
| 草地 | 35.3 | 86.5 | 99.9 |
| 水域 | 0.30 | 0 | 0 |
| 建设用地 | 2.50 | 27.5 | 78.0 |
| 未利用地 | 1.30 | 0 | 21.6 |
表1 中国不同土地利用类型碳密度
Table 1 Carbon density of different land use types in China t?hm?2
| 土地利用类型 | 地上碳密度 | 地下碳密度 | 土壤碳密度 |
|---|---|---|---|
| 耕地 | 17.0 | 80.7 | 108 |
| 林地 | 42.4 | 116 | 159 |
| 草地 | 35.3 | 86.5 | 99.9 |
| 水域 | 0.30 | 0 | 0 |
| 建设用地 | 2.50 | 27.5 | 78.0 |
| 未利用地 | 1.30 | 0 | 21.6 |
| 土地利用类型 | 地上碳密度 | 地下碳密度 | 土壤碳密度 |
|---|---|---|---|
| 耕地 | 14.5 | 68.7 | 99.7 |
| 林地 | 36.1 | 98.7 | 147 |
| 草地 | 30.0 | 73.6 | 92.2 |
| 水域 | 0.26 | 0 | 0 |
| 建设用地 | 2.13 | 23.4 | 72.0 |
| 未利用地 | 1.11 | 0 | 19.9 |
表2 黄河流域不同土地利用类型碳密度
Table 2 Carbon density of different land use types in the Yellow River Basin t?hm?2
| 土地利用类型 | 地上碳密度 | 地下碳密度 | 土壤碳密度 |
|---|---|---|---|
| 耕地 | 14.5 | 68.7 | 99.7 |
| 林地 | 36.1 | 98.7 | 147 |
| 草地 | 30.0 | 73.6 | 92.2 |
| 水域 | 0.26 | 0 | 0 |
| 建设用地 | 2.13 | 23.4 | 72.0 |
| 未利用地 | 1.11 | 0 | 19.9 |
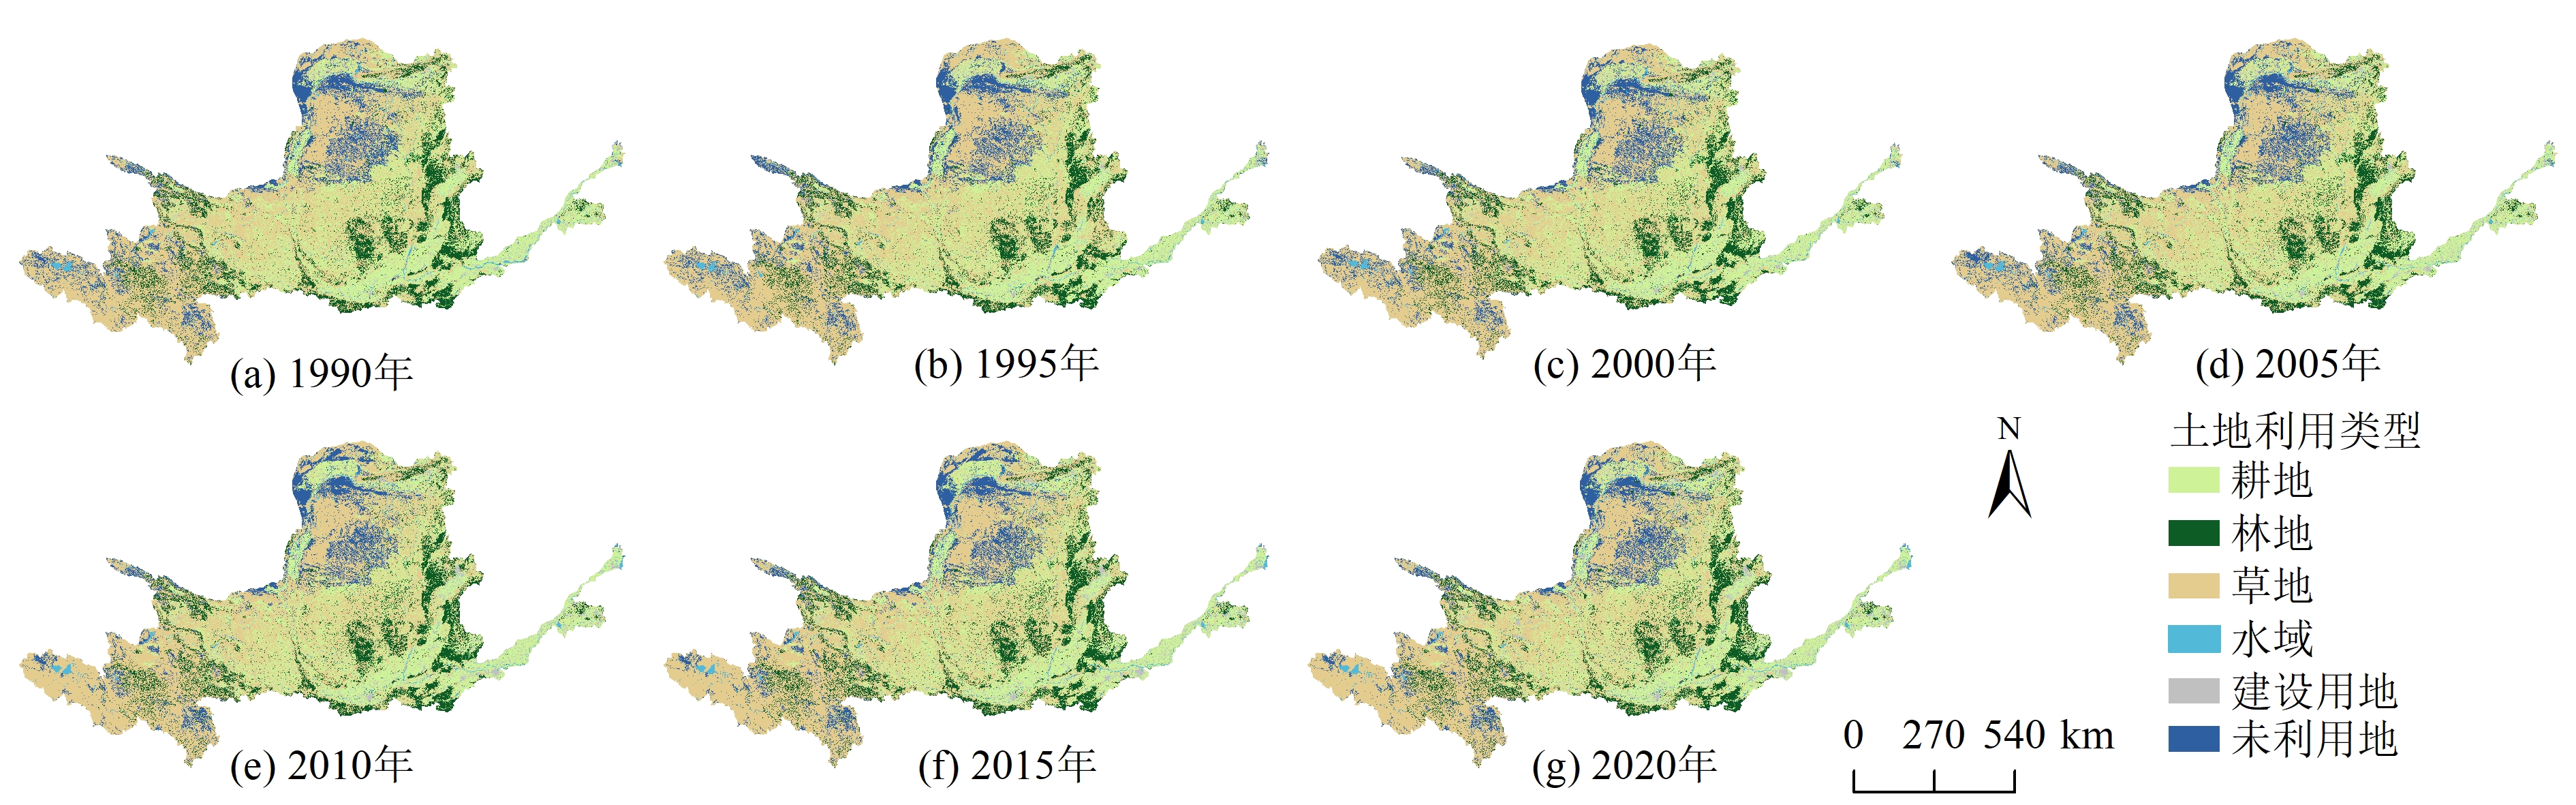
图2 1990-2020年黄河流域土地利用图
Figure 2 Land use map of the Yellow River Basin from 1990 to 2020

图3 1990-2020研究区土地利用变化桑基图 图中数字为各土地利用类型面积km2
Figure 3 Sankey diagram of land use change in the study area from 1990 to 2020

图4 1990-2020年黄河流域碳储量及空间变化和固碳能力冷热点区域
Figure 4 Carbon storage and its spatial changes, as well as hotspots of carbon sequestration capacity in the Yellow River Basin from 1990 to 2020
| 土地利用 类型 | 碳储量/108 t | ||||||
|---|---|---|---|---|---|---|---|
| 1990 | 1995 | 2000 | 2005 | 2010 | 2015 | 2020 | |
| 耕地 | 39.8 | 39.8 | 40.1 | 39.3 | 38.9 | 38.7 | 37.8 |
| 林地 | 29.1 | 27.5 | 29.0 | 29.8 | 29.8 | 29.8 | 30.0 |
| 草地 | 75.1 | 76.9 | 74.8 | 74.4 | 75.4 | 75.3 | 75.6 |
| 水域 | 0.004 | 0.003 | 0.004 | 0.004 | 0.004 | 0.004 | 0.004 |
| 建设用地 | 1.72 | 1.76 | 1.86 | 2.01 | 2.51 | 2.70 | 3.02 |
| 未利用地 | 1.54 | 1.48 | 1.52 | 1.56 | 1.38 | 1.37 | 1.35 |
表3 黄河流域1990-2020年各地类碳储量变化
Table 3 Changes of carbon stocks in the Yellow River Basin from 1990 to 2020
| 土地利用 类型 | 碳储量/108 t | ||||||
|---|---|---|---|---|---|---|---|
| 1990 | 1995 | 2000 | 2005 | 2010 | 2015 | 2020 | |
| 耕地 | 39.8 | 39.8 | 40.1 | 39.3 | 38.9 | 38.7 | 37.8 |
| 林地 | 29.1 | 27.5 | 29.0 | 29.8 | 29.8 | 29.8 | 30.0 |
| 草地 | 75.1 | 76.9 | 74.8 | 74.4 | 75.4 | 75.3 | 75.6 |
| 水域 | 0.004 | 0.003 | 0.004 | 0.004 | 0.004 | 0.004 | 0.004 |
| 建设用地 | 1.72 | 1.76 | 1.86 | 2.01 | 2.51 | 2.70 | 3.02 |
| 未利用地 | 1.54 | 1.48 | 1.52 | 1.56 | 1.38 | 1.37 | 1.35 |
| 土地利用 类型转换 | 碳储量贡献率/% | ||||||
|---|---|---|---|---|---|---|---|
| 1990‒1995 | 1995‒2000 | 2000‒2005 | 2005‒2010 | 2010‒2015 | 2015‒2020 | 1990‒2020 | |
| 耕地→林地 | 1.05 | 0.830 | 0.595 | 0.406 | 0.010 | 0.265 | 2.51 |
| 耕地→草地 | 2.87 | 2.23 | 0.403 | 1.27 | 0.050 | 1.27 | 3.78 |
| 耕地→水域 | −0.220 | −0.309 | −0.144 | −0.296 | −0.025 | −0.159 | −0.716 |
| 耕地→建设用地 | −0.885 | −1.05 | −0.333 | −5.90 | −0.324 | −2.24 | −20.8 |
| 耕地→未利用地 | −0.106 | −0.185 | −0.059 | −0.022 | −0.002 | −0.382 | −0.178 |
| 林地→耕地 | −0.832 | −1.04 | −0.014 | −0.222 | −0.017 | −0.143 | −0.380 |
| 林地→草地 | −21.0 | −4.43 | −0.047 | −0.404 | −0.047 | −0.654 | −2.05 |
| 林地→水域 | −0.005 | −0.003 | −0.001 | −0.008 | 0.000 | −0.003 | −0.016 |
| 林地→建设用地 | −0.003 | −0.002 | −0.002 | −0.041 | −0.007 | −0.028 | −0.137 |
| 林地→未利用地 | −0.081 | −0.008 | −0.002 | −0.029 | 0.000 | −0.013 | −0.013 |
| 草地→耕地 | −2.82 | −3.51 | −0.214 | −1.31 | −0.052 | −0.527 | −3.07 |
| 草地→林地 | 4.65 | 20.1 | 0.519 | 0.660 | 0.052 | 0.834 | 4.36 |
| 草地→水域 | −0.107 | −0.408 | −0.030 | −0.074 | −0.007 | −0.150 | −0.610 |
| 草地→建设用地 | −0.018 | −0.038 | −0.017 | −0.441 | −0.111 | −0.746 | −2.48 |
| 草地→未利用地 | −15.0 | −31.1 | −2.51 | −11.7 | −0.130 | −5.73 | −17.6 |
| 水域→耕地 | 0.629 | 0.363 | 0.025 | 0.382 | 0.003 | 0.050 | 0.721 |
| 水域→林地 | 0.005 | 0.005 | 0.000 | 0.001 | 0.000 | 0.002 | 0.004 |
| 水域→草地 | 0.406 | 0.077 | 0.008 | 0.061 | 0.007 | 0.049 | 0.116 |
| 水域→建设用地 | 0.001 | 0.000 | 0.000 | 0.011 | 0.001 | 0.002 | 0.019 |
| 水域→未利用地 | 0.015 | 0.005 | 0.003 | 0.001 | 0.000 | 0.002 | 0.008 |
| 建设用地→耕地 | 0.588 | 0.428 | 0.001 | 1.05 | 0.010 | 0.419 | 0.593 |
| 建设用地→林地 | 0.001 | 0.002 | 0.000 | 0.001 | 0.000 | 0.009 | 0.001 |
| 建设用地→草地 | 0.023 | 0.012 | 0.000 | 0.020 | 0.005 | 0.127 | 0.006 |
| 建设用地→水域 | 0.000 | −0.001 | 0.000 | −0.002 | 0.000 | −0.014 | −0.005 |
| 建设用地→未利用地 | 0.000 | −0.001 | 0.000 | 0.000 | 0.000 | −0.010 | 0.000 |
| 未利用地→耕地 | 0.193 | 0.229 | 0.016 | 0.539 | 0.010 | 0.087 | 0.644 |
| 未利用地→林地 | 0.016 | 0.076 | 0.007 | 0.010 | 0.001 | 0.152 | 0.195 |
| 未利用地→草地 | 35.4 | 16.0 | 0.256 | 60.4 | 0.154 | 8.94 | 73.3 |
| 未利用地→水域 | −0.005 | −0.014 | −0.001 | −0.009 | −0.001 | −0.002 | −0.024 |
| 未利用地→建设用地 | 0.002 | 0.000 | 0.000 | 0.024 | 0.006 | 0.061 | 0.139 |
表4 黄河流域1990-2020年基于土地利用转换的碳储量贡献率
Table 4 Contribution rate of carbon storage based on land use conversion in the Yellow River Basin from 1990 to 2020
| 土地利用 类型转换 | 碳储量贡献率/% | ||||||
|---|---|---|---|---|---|---|---|
| 1990‒1995 | 1995‒2000 | 2000‒2005 | 2005‒2010 | 2010‒2015 | 2015‒2020 | 1990‒2020 | |
| 耕地→林地 | 1.05 | 0.830 | 0.595 | 0.406 | 0.010 | 0.265 | 2.51 |
| 耕地→草地 | 2.87 | 2.23 | 0.403 | 1.27 | 0.050 | 1.27 | 3.78 |
| 耕地→水域 | −0.220 | −0.309 | −0.144 | −0.296 | −0.025 | −0.159 | −0.716 |
| 耕地→建设用地 | −0.885 | −1.05 | −0.333 | −5.90 | −0.324 | −2.24 | −20.8 |
| 耕地→未利用地 | −0.106 | −0.185 | −0.059 | −0.022 | −0.002 | −0.382 | −0.178 |
| 林地→耕地 | −0.832 | −1.04 | −0.014 | −0.222 | −0.017 | −0.143 | −0.380 |
| 林地→草地 | −21.0 | −4.43 | −0.047 | −0.404 | −0.047 | −0.654 | −2.05 |
| 林地→水域 | −0.005 | −0.003 | −0.001 | −0.008 | 0.000 | −0.003 | −0.016 |
| 林地→建设用地 | −0.003 | −0.002 | −0.002 | −0.041 | −0.007 | −0.028 | −0.137 |
| 林地→未利用地 | −0.081 | −0.008 | −0.002 | −0.029 | 0.000 | −0.013 | −0.013 |
| 草地→耕地 | −2.82 | −3.51 | −0.214 | −1.31 | −0.052 | −0.527 | −3.07 |
| 草地→林地 | 4.65 | 20.1 | 0.519 | 0.660 | 0.052 | 0.834 | 4.36 |
| 草地→水域 | −0.107 | −0.408 | −0.030 | −0.074 | −0.007 | −0.150 | −0.610 |
| 草地→建设用地 | −0.018 | −0.038 | −0.017 | −0.441 | −0.111 | −0.746 | −2.48 |
| 草地→未利用地 | −15.0 | −31.1 | −2.51 | −11.7 | −0.130 | −5.73 | −17.6 |
| 水域→耕地 | 0.629 | 0.363 | 0.025 | 0.382 | 0.003 | 0.050 | 0.721 |
| 水域→林地 | 0.005 | 0.005 | 0.000 | 0.001 | 0.000 | 0.002 | 0.004 |
| 水域→草地 | 0.406 | 0.077 | 0.008 | 0.061 | 0.007 | 0.049 | 0.116 |
| 水域→建设用地 | 0.001 | 0.000 | 0.000 | 0.011 | 0.001 | 0.002 | 0.019 |
| 水域→未利用地 | 0.015 | 0.005 | 0.003 | 0.001 | 0.000 | 0.002 | 0.008 |
| 建设用地→耕地 | 0.588 | 0.428 | 0.001 | 1.05 | 0.010 | 0.419 | 0.593 |
| 建设用地→林地 | 0.001 | 0.002 | 0.000 | 0.001 | 0.000 | 0.009 | 0.001 |
| 建设用地→草地 | 0.023 | 0.012 | 0.000 | 0.020 | 0.005 | 0.127 | 0.006 |
| 建设用地→水域 | 0.000 | −0.001 | 0.000 | −0.002 | 0.000 | −0.014 | −0.005 |
| 建设用地→未利用地 | 0.000 | −0.001 | 0.000 | 0.000 | 0.000 | −0.010 | 0.000 |
| 未利用地→耕地 | 0.193 | 0.229 | 0.016 | 0.539 | 0.010 | 0.087 | 0.644 |
| 未利用地→林地 | 0.016 | 0.076 | 0.007 | 0.010 | 0.001 | 0.152 | 0.195 |
| 未利用地→草地 | 35.4 | 16.0 | 0.256 | 60.4 | 0.154 | 8.94 | 73.3 |
| 未利用地→水域 | −0.005 | −0.014 | −0.001 | −0.009 | −0.001 | −0.002 | −0.024 |
| 未利用地→建设用地 | 0.002 | 0.000 | 0.000 | 0.024 | 0.006 | 0.061 | 0.139 |
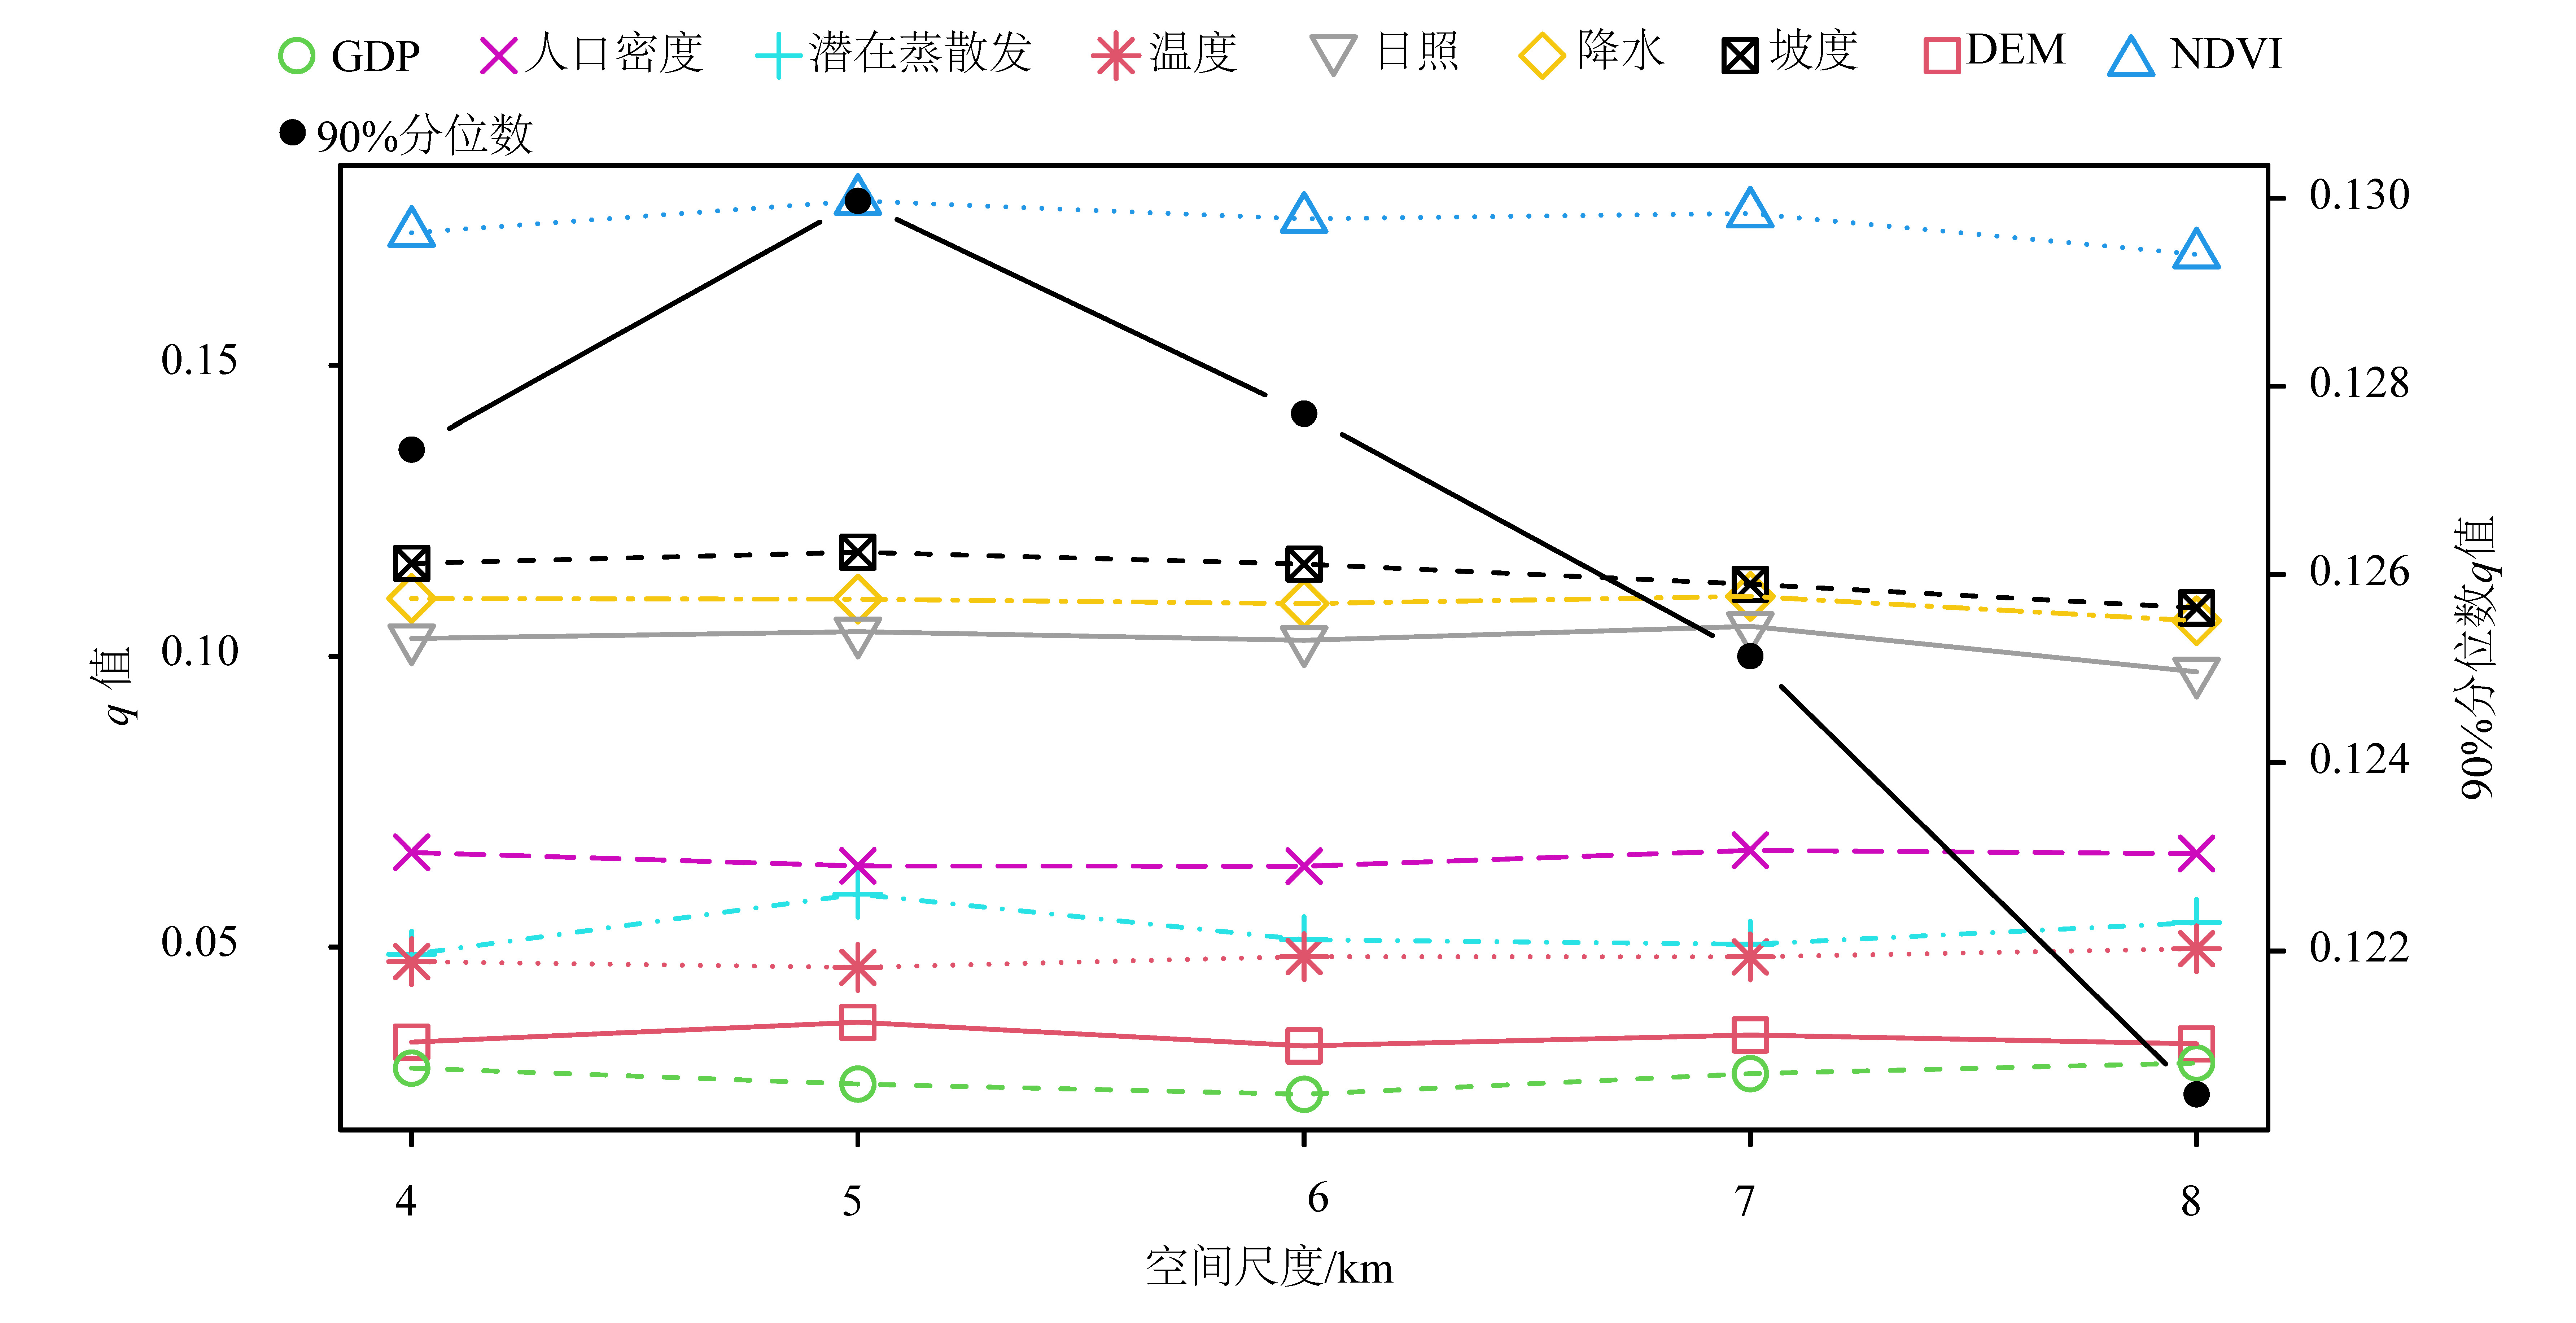
图5 驱动因素q和90%分位数的空间单元尺度效应比较
Figure 5 Comparison of the spatial unit-scale effects of the driving factor q and the 90% quantile
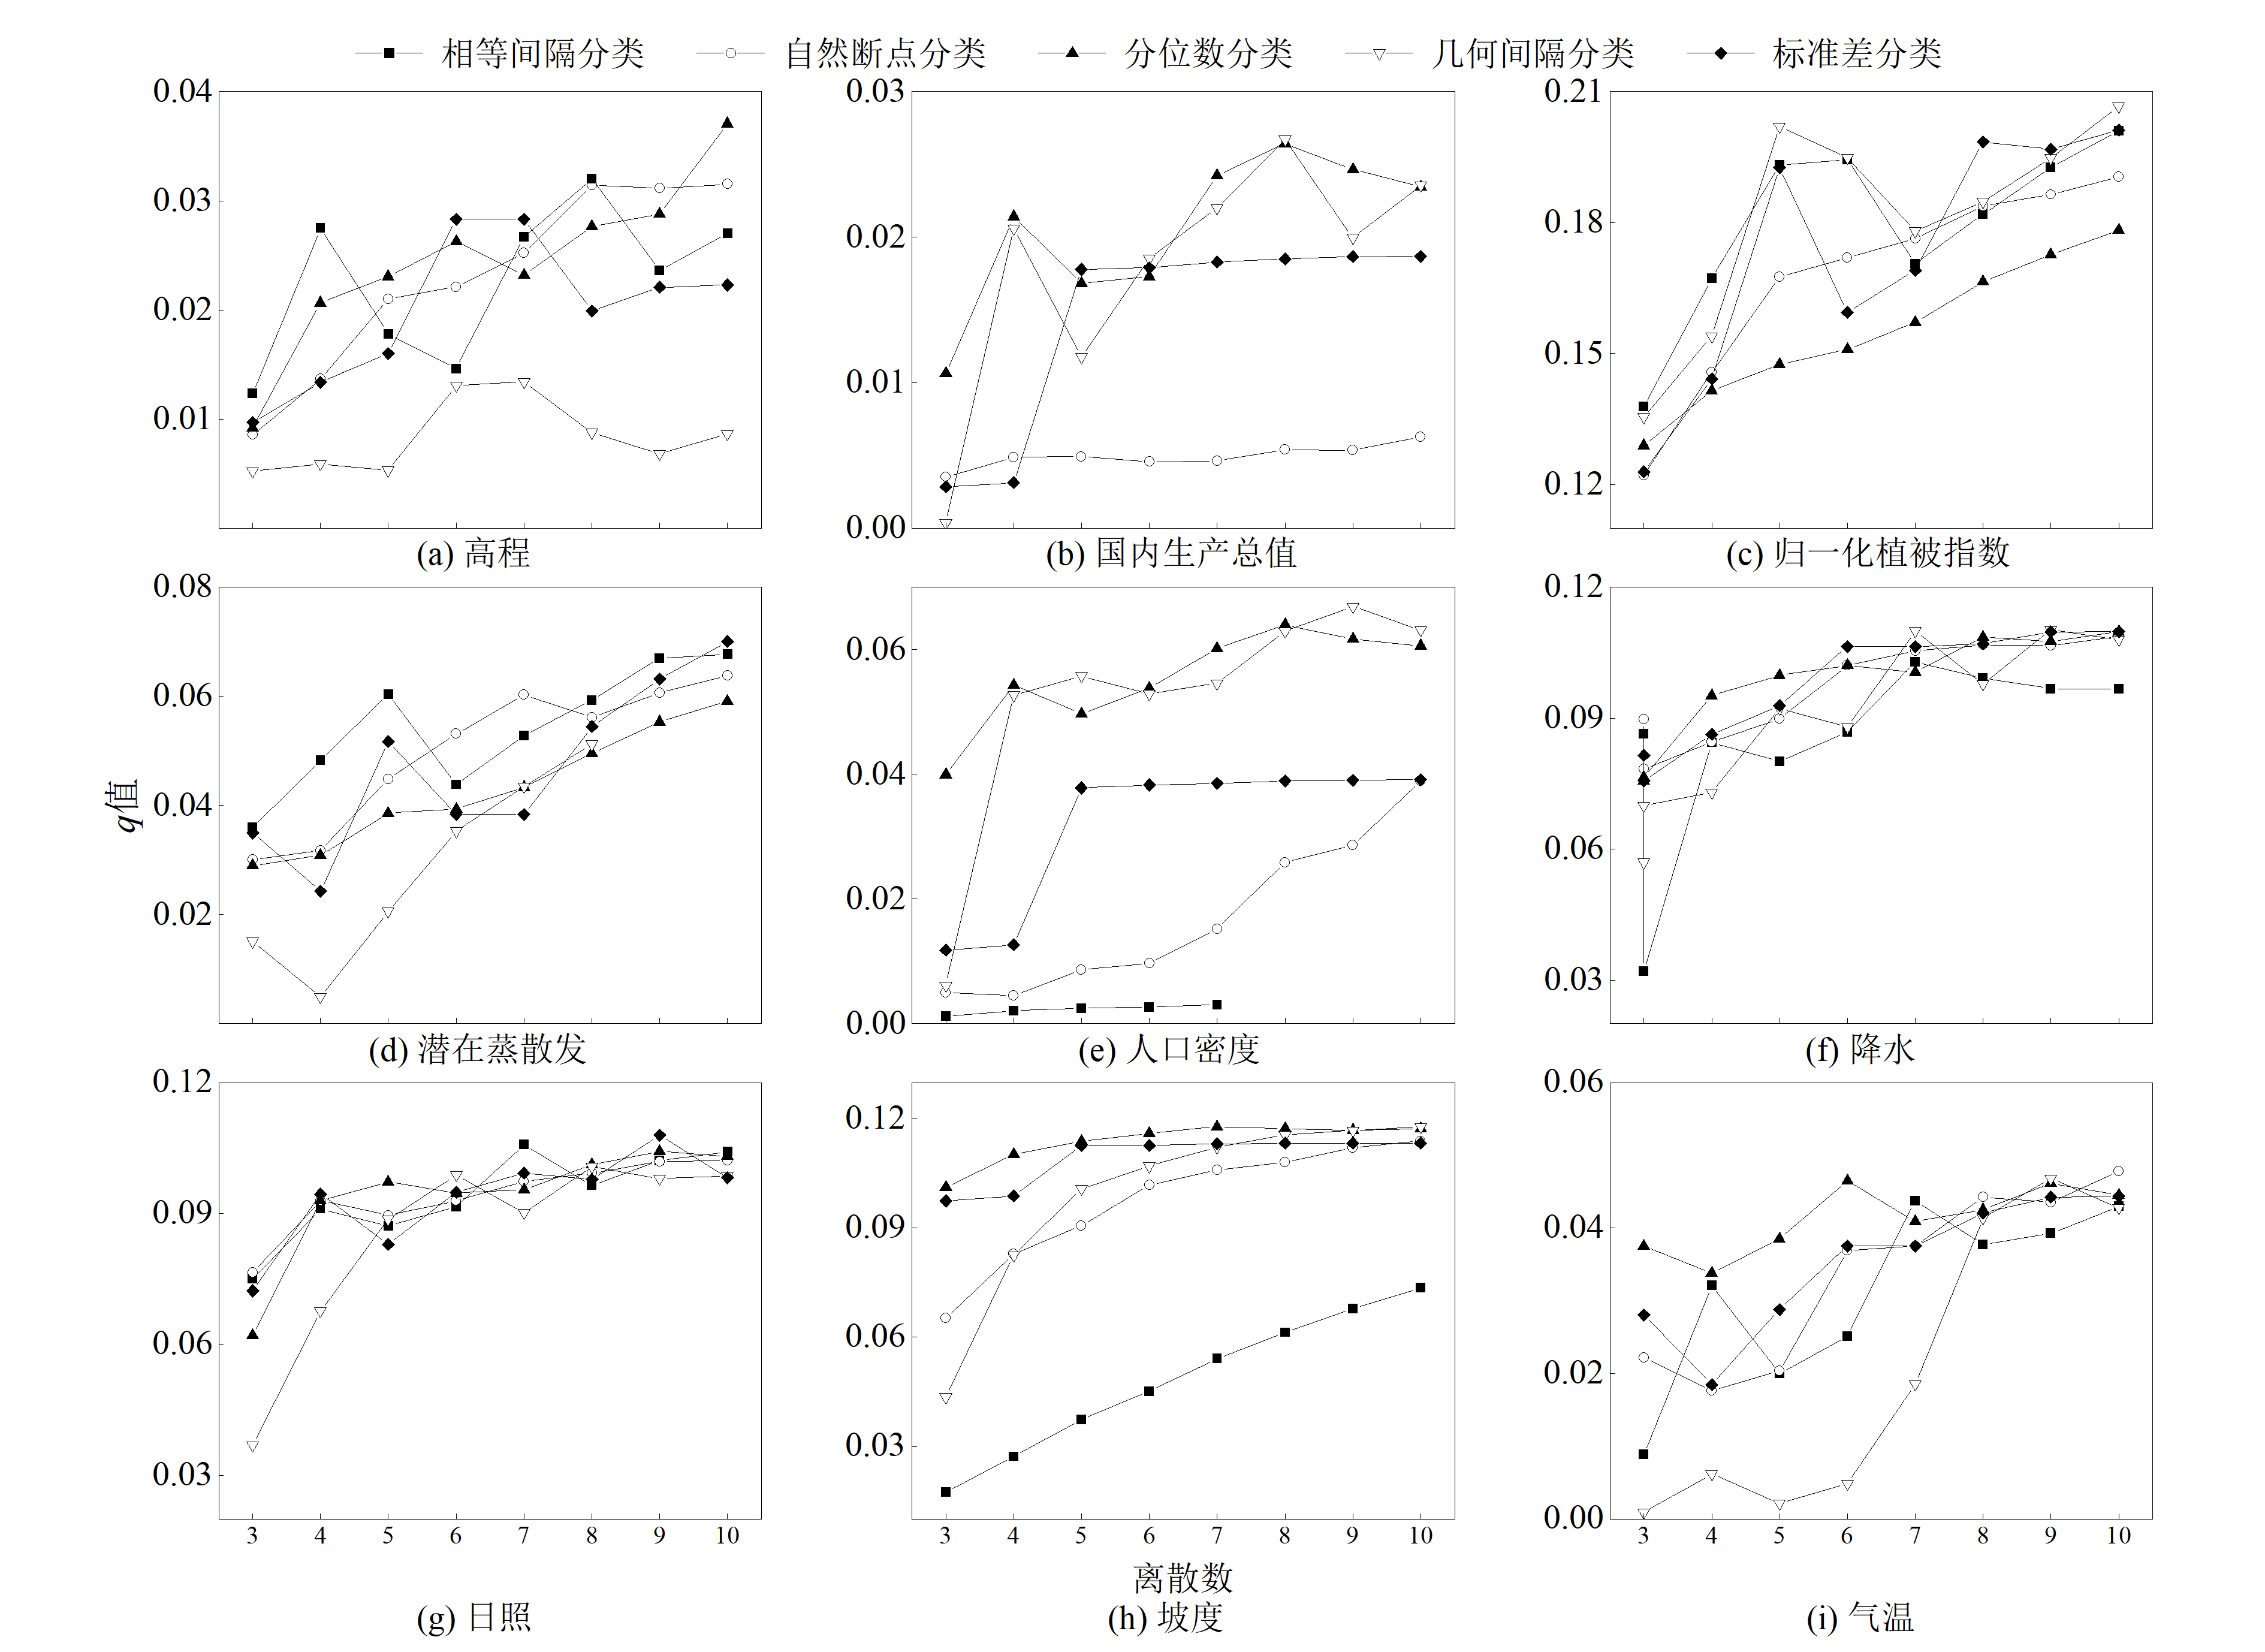
图6 基于5 km最优空间尺度的连续因子最佳离散
Figure 6 Optimal dispersion of continuous factors based on the optimal spatial scale of 5 km
图7 因子和交互探测结果
Figure 7 Factor and interaction detection results
| [1] | AHMED I S, HASSAN F A, SULIEMAN M M, et al., 2022. Using environmental covariates to predict soil organic carbon stocks in Vertisols of Sudan[J]. Geoderma Regional, 31: 00578. |
| [2] | ALAM S A, STARR M, CLARK B J F, 2013. Tree biomass and soil organic carbon densities across the Sudanese woodland savannah: A regional carbon sequestration study[J]. Journal of Arid Environments, 89: 67-76. |
| [3] | BACANI V M, MACHADO DA SILVA B H, AYUMI DE SOUZA AMEDE SATO A, et al., 2024. Carbon storage and sequestration in a eucalyptus productive zone in the Brazilian Cerrado, using the Ca-Markov/Random Forest and InVEST models[J]. Journal of Cleaner Production, 444: 141291. |
| [4] | CAI W X, HE N P, XU L, et al., 2023. Spatial-temporal variation of the carbon sequestration rate of afforestation in China: Implications for carbon trade and planning[J]. Science of The Total Environment, 884: 163792. |
| [5] | CUI J L, ZHANG X M, REIS S, et al., 2023. Nitrogen cycles in global croplands altered by elevated CO2[J]. Nature Sustainability, 6(10): 1166-1176. |
| [6] | CHU X, ZHAN J Y, LI Z H, et al., 2019. Assessment on forest carbon sequestration in the Three-North Shelterbelt Program region, China[J]. Journal of Cleaner Production, 215: 382-389. |
| [7] | DEGERMENCI A S, 2023. Determining the effects of changes in land use on carbon storage in above-ground biomass with NDVI[J]. Global Nest Journal, 25(3): 27-36. |
| [8] | FU Z H, HU W, BEARE M, et al., 2023. Response of soil organic carbon stock to land use is modulated by soil hydraulic properties[J]. Soil and Tillage Research, 233: 105793. |
| [9] | GARCÍA-ONTIYUELO M, ACUñA-ALONSO C, VALERO E, et al., 2024. Geospatial mapping of carbon estimates for forested areas using the InVEST model and Sentinel-2: A case study in Galicia (NW Spain)[J]. Science of The Total Environment, 922: 171297. |
| [10] | GIARDINA C P, RYAN M G, 2000. Evidence that decomposition rates of organic carbon in mineral soil do not vary with temperature[J]. Nature, 404(6780): 858-861. |
| [11] | GÓMEZ-SAPIENS M M, JARCHOW C J, FLESSA K W, et al., 2020. Effect of an environmental flow on vegetation growth and health using ground and remote sensing metrics[J]. Hydrological Processes, 34(8): 1682-1696. |
| [12] | GONG W F, DUAN X Y, MAO M J, et al., 2022. Assessing the impact of land use and changes in land cover related to carbon storage by linking trajectory analysis and InVEST models in the Nandu River Basin on Hainan Island in China[J]. Frontiers in Environmental Science, 10: 1038752. |
| [13] | GUAN J H, DENG L, ZHANG J G, et al., 2019. Soil organic carbon density and its driving factors in forest ecosystems across a northwestern province in China[J]. Geoderma, 352: 1-12. |
| [14] | HASTIE A, HONORIO CORONADO E N, REYNA J, et al., 2022. Risks to carbon storage from land-use change revealed by peat thickness maps of Peru[J]. Nature Geoscience, 15(5): 369-374. |
| [15] | HOU L, LIANG Y F, WANG C K, et al., 2024. Mineral protection explains the elevational variation of temperature sensitivity of soil carbon decomposition in the Eastern Himalaya[J]. Applied Soil Ecology, 197: 105346. |
| [16] | HUANG Y, HUANG L, QIU C J, et al., 2024. Evaluation of effects of heat released from SOC decomposition on soil carbon stock and temperature[J]. Global Change Biology, 30(7): 17391. |
| [17] | IPCC, 2021. Climate change 2021: The physical science basis: Working group I contribution to the sixth assessment report of the intergovernmental panel on climate change[M]. Cambridge: Cambridge University Press. |
| [18] | LI L, JI G X, LI Q S, et al., 2023. Spatiotemporal evolution and prediction of ecosystem carbon storage in the Yiluo River Basin based on the PLUS-InVEST model[J]. Forests, 14(12): 2442. |
| [19] | LI S H, KANG J F, YE J L, et al., 2024. Analysis of soil erosion changes and influencing factors based on the CSLE model and GeoDector in Dongjiang River Basin of China[J]. Soil Science Society of America Journal, 88(3): 718-729. |
| [20] |
LIN Y M, HU Z R, LI W H, et al., 2024. Response of ecosystem carbon storage to land use change from 1985 to 2050 in the Ningxia section of Yellow River Basin, China[J]. Journal of Arid Land, 16(1): 110-130.
DOI |
| [21] | LIU J, WEI L H, ZHENG Z P, et al., 2023. Vegetation cover change and its response to climate extremes in the Yellow River Basin[J]. Science of The Total Environment, 905: 167366. |
| [22] | MARIA T L C, RODRIGUES DE S E, EMANUELLE M DOS S S T, et al., 2023. Influence of vegetation cover and rainfall intensity on soil attributes in an area undergoing desertification in Brazil[J]. CATENA, 221(Part A): 106751. |
| [23] | NOAA-ESRL, 2024. CO2▪earth: Numbers for living on Earth[EB/OL]. [2024-05-10]. https://www.co2.earth/daily-co2. |
| [24] | OTA H O, MOHAN K C, UDUME B U, et al., 2024. Assessment of land use management and its effect on soil quality and carbon stock in Ebonyi State, Southeast Nigeria[J]. Journal of Environmental Management, 358: 120889. |
| [25] | SHAH S P, SHARMA D P, 2024. Monitoring carbon stock changes in Solan forest division of Indian western Himalayas[J]. Environment Development and Sustainability, 26(3): 7881-7902. |
| [26] | SONG Y Z, WANG J F, GE Y, et al., 2020. An optimal parameters-based geographical detector model enhances geographic characteristics of explanatory variables for spatial heterogeneity analysis: Cases with different types of spatial data[J]. GIScience & Remote Sensing, 57(5): 593-610. |
| [27] | SUN B Q, DU J Q, CHONG F F, et al., 2023. Spatio-temporal variation and prediction of carbon storage in terrestrial ecosystems in the Yellow River Basin[J]. Remote Sensing, 15(15): 3866. |
| [28] | KIRAN KUMARA T M, PAL S, CHAND P, et al., 2023. Carbon sequestration potential of agroforestry systems in Indian agricultural landscape: A meta-analysis[J]. Ecosystem Services, 62(2): 12. |
| [29] | TADESSE S, TAMIRU A, 2024. Carbon stock of shatto forest along altitudinal gradients in masha district, southwest ethiopia: A contribution to climate change mitigation[J]. Forest Science and Technology, 20(2): 171-178. |
| [30] | TANG X L, ZHAO X, BAI Y F, et al., 2018. Carbon pools in China’s terrestrial ecosystems: New estimates based on an intensive field survey[J]. Proceedings of the National Academy of Sciences, 115(16): 4021-4026. |
| [31] | WANG H Y, WU L S, YUE Y S, et al., 2024. Impacts of climate and land use change on terrestrial carbon storage: A multi-scenario case study in the Yellow River Basin (1992-2050)[J]. Science of The Total Environment, 930: 172557. |
| [32] | WANI A A, BHAT A F, GATOO A A, et al., 2021. Assessing relationship of forest biophysical factors with NDVI for carbon management in key coniferous strata of temperate Himalayas[J]. Mitigation and Adaptation Strategies for Global Change, 26(1): 09937-6. |
| [33] | WU X Y, SHEN C T, SHI L N, et al., 2024. Spatio-temporal evolution characteristics and simulation prediction of carbon storage: A case study in Sanjiangyuan Area, China[J]. Ecological Informatics, 80: 102485. |
| [34] | XU C L, ZHANG Q B, YU Q, et al., 2023. Effects of land use/cover change on carbon storage between 2000 and 2040 in the Yellow River Basin, China[J]. Ecological Indicators, 151: 110345. |
| [35] | XU L, HE N P, LI M X, et al., 2024. Spatiotemporal dynamics of carbon sinks in China's terrestrial ecosystems from 2010 to 2060[J]. Resources, Conservation and Recycling, 203: 107457. |
| [36] | XU L, HE N P, YU G R, 2019. A dataset of carbon density in Chinese terrestrial ecosystems (2010s)[J]. China Scientific Data, 4(1): 90-96. |
| [37] | LI Y M, YANG X, WU B W, et al., 2023. Spatio-temporal evolution and prediction of carbon storage in Kunming based on PLUS and InVEST models[J]. PeerJ, 11(11): e15285. |
| [38] | ZHOU Z L, ZHANG C L, ZOU X Y, et al., 2024. Estimating lateral cover of vegetation and gravel using NDVI and albedo[J]. CATENA, 239: 107899. |
| [39] | ZHU G F, QIU D D, ZHANG Z X, et al., 2021. Land-use changes lead to a decrease in carbon storage in arid region, China[J]. Ecological Indicators, 127: 107770. |
| [40] | 方精云, 刘国华, 徐嵩龄, 1996. 我国森林植被的生物量和净生产量[J]. 生态学报, 16(5): 16497-16508. |
| FANG J Y, LIU G H, XU S L, 1996. Biomass and net production of forest vegetation in China[J]. Acta Ecologica Sinica, 16(5): 16497-16508. | |
| [41] | 方精云, 杨元合, 马文红, 等, 2010. 中国草地生态系统碳库及其变化[J]. 中国科学: 生命科学, 40(7): 566-576. |
| FANG J Y, YANG Y H, MA W H, et al., 2010. The carbon storage and its changes in China’s grassland ecosystems[J]. Scientia Sinica (Vitae), 40(7): 566-576. | |
| [42] | 贾松伟, 2018. 黄河流域森林植被碳储量分布特征及动态变化[J]. 水土保持研究, 25(5): 78-83, 88. |
| JIA S W, 2018. Carbon storage of forest vegetation and its dynamic changes in Yellow River Basin based on continuous forest resources inventory[J]. Research of Soil and Water Conservation, 25(5): 78-83, 88. | |
| [43] | 黄玫, 季劲钧, 曹明奎, 等, 2006. 中国区域植被地上与地下生物量模拟[J]. 生态学报, 26(12): 4156-4163. |
| HUANG M, JI J J, CAO M K, et al., 2006. Modeling study of vegetation shoot and root biomass in China[J]. Acta Ecologica Sinica, 26(12): 4156-4163. | |
| [44] |
孔冬艳, 陈会广, 吴孔森, 2021. 中国 “三生空间” 演变特征、生态环境效应及其影响因素[J]. 自然资源学报, 36(5): 1116-1135.
DOI |
| KONG D Y, CHEN H G, WU K S, 2021. The evolution of “production-living-ecological” space, eco-environmental effects and its influencing factors in China[J]. Journal of Natural Resources, 36(5): 1116-1135. | |
| [45] | 李克让, 王绍强, 曹明奎, 2003. 中国植被和土壤碳贮量[J]. 中国科学(D辑), 33(1): 72-80. |
| LI K R, WANG S Q, CAO M K, 2003. The vegetation and soil carbon storage in China[J]. Science in China (Series D), 33(1): 72-80. | |
| [46] | 李妙宇, 上官周平, 邓蕾, 2021. 黄土高原地区生态系统碳储量空间分布及其影响因素[J]. 生态学报, 41(17): 6786-6799. |
| LI M Y, SHANG G Z P, DENG L, 2021. Spatial distribution of carbon storages in the terrestrial ecosystems and its influencing factors on the Loess Plateau[J]. Acta Ecologica Sinica, 41(17): 6786-6799. | |
| [47] | 廖美玉, 方秀琴, 蒋心远, 等, 2024. 黄河流域近40年土地利用/覆被时空变化特征[J]. 水土保持学报, 38(2): 165-177, 189. |
| LIAO M Y, FANG X Q, JAING X Y, et al., 2024. Spatiotemporal characteristics of land use/cover changes in the Yellow River Basin over the past 40 years[J]. Journal of Soil and Water Conservation, 38(2): 165-177, 189. | |
| [48] | 朴世龙, 何悦, 王旭辉, 等, 2022. 中国陆地生态系统碳汇估算: 方法、进展、展望[J]. 中国科学: 地球科学, 52(6): 1010-1020. |
| PIAO S L, HE Y, WANG X H, et al., 2022. The estimation of carbon sequestration in China’s terrestrial ecosystems: Methods, progress, and prospects[J]. Scientia Sinica Terrae, 52(6): 1010-1020. | |
| [49] |
王超越, 郭先华, 郭莉, 等, 2022. 基于FLUS-InVEST的西北地区土地利用变化及其对碳储量的影响——以呼包鄂榆城市群为例[J]. 生态环境学报, 31(8): 1667-1679.
DOI |
| WANG C Y, GUO X H, GUO L, et al., 2022. Land use change and its impacton carbon storage in northwest China based on FLUS-InVEST: A case study of Hu-Bao-Er-Yu urban agglomeration[J]. Ecology and Environmental Sciences, 31(8): 1667-1679. | |
| [50] |
王成武, 罗俊杰, 唐鸿湖, 2023. 基于InVEST模型的太行山沿线地区生态系统碳储量时空分异驱动力分析[J]. 生态环境学报, 32(2): 215-225.
DOI |
| WANG C W, LUO J J, TANG H H, 2023. Analysis on the driving force of spatial and temporal differentiation of carbon storage in the Taihang mountains based on InVEST model[J]. Ecology and Environmental Sciences, 32(2): 215-225. | |
| [51] |
王劲峰, 徐成东, 2017. 地理探测器: 原理与展望[J]. 地理学报, 72(1): 116-134.
DOI |
|
WANG J F, XU C D, 2017. Geodetector: Principle and prospective[J]. Acta Geographica Sinica, 72(1): 116-134.
DOI |
|
| [52] | 王绍强, 周成虎, 1999. 中国陆地土壤有机碳库的估算[J]. 地理研究, 18(14): 349-356. |
| WANG S Q, ZHOU C H, 1999. Estimating soil carbon reservior of terrestrial ecosystem in China[J]. Geographical Research, 18(14): 349-356. | |
| [53] | 王绍业, 2023. 基于InVEST模型的黄河流域生态系统服务功能评估[D]. 郑州: 华北水利水电大学: 29-30. |
| WANY S Y, 2023. Assessment of ecosystem service functions in the Yellow River Basin based on the InVEST model[D]. Zhengzhou: North China University of Water Resources and Electric Power: 29-30. | |
| [54] | 杨洁, 谢保鹏, 张德罡, 2021. 基于InVEST和CA-Markov模型的黄河流域碳储量时空变化研究[J]. 中国生态农业学报(中英文), 29(6): 1018-1029. |
| YANG J, XIE B P, ZHANG D G, 2021. Spatio-temporal evolution of carbon stocks in the Yellow River Basin based on InVEST and CA-Markov models[J]. Chinese Journal of Eco-Agriculture, 29(6): 1018-1029. | |
| [55] | 杨元合, 石岳, 孙文娟, 等, 2022. 中国及全球陆地生态系统碳源汇特征及其对碳中和的贡献[J]. 中国科学: 生命科学, 52(4): 534-574. |
| YANG Y H, SHI Y, SUN W J, et al., 2022. Terrestrial carbon sinks in China and around the world and their contribution to carbon neutrality[J]. Scientia Sinica (Vitae), 52(4): 534-574. | |
| [56] | 衣鹏慧, 吴会峰, 胡保安, 等, 2023. 黄土高原地区退耕还林后土壤有机碳储量变化特征及影响因素[J]. 生态学报, 43(24): 10054-10064. |
| YI P H, WU H F, HU B A, et al., 2023. Variation characteristics and influencing factors of soil organic carbon storage after returning farmland to forest on the Loess Plateau[J]. Acta Ecologica Sinica, 43(24): 10054-10064. |
| [1] | 郭昭, 师芸, 刘铁铭, 张雨欣, 闫永智. 2001-2020年秦岭北麓NPP时空格局及驱动因素分析[J]. 生态环境学报, 2025, 34(3): 401-410. |
| [2] | 张继, 杨世琦, 赵磊, 冯介玲, 陈艳英. 基于InVEST模型的重庆市“一带三屏”生境质量时空演变特征分析[J]. 生态环境学报, 2025, 34(2): 167-180. |
| [3] | 马月伟, 陈玉美, 张盛蓝, 桂雅丽, 陈艳梅. 夹金山脉大熊猫栖息地生境质量与人类活动强度耦合协调研究[J]. 生态环境学报, 2025, 34(2): 197-208. |
| [4] | 赵乐鋆, 王诗瑶, 赵子渝, 洪星, 李夫星, 吴佳仪, 华婧妤. 2008-2022年华北平原七省市AOD时空变化特征及主要影响因素分析[J]. 生态环境学报, 2025, 34(2): 256-267. |
| [5] | 赵忠宝, 李婧, 刘小丹, 柏祥, 刘昊野, 徐晓娜, 耿世刚, 鲁少波. 河北省森林生态产品价值评估及其空间分布驱动因素研究[J]. 生态环境学报, 2025, 34(2): 321-332. |
| [6] | 叶俊宏, 刘珍环, 刘子瑜. 珠江三角洲城市群国土空间生态修复分区情景模拟[J]. 生态环境学报, 2025, 34(1): 4-12. |
| [7] | 唐建亭, 袁杰, 陈宗颜, 李晓燕, 孙子婷. 祁连山南坡土地利用变化及碳储量研究[J]. 生态环境学报, 2024, 33(9): 1353-1361. |
| [8] | 张舒涵, 姜海玲, 于海淋, 冯馨慧. 沈阳现代化都市圈景观生态风险时空演变及驱动力分析[J]. 生态环境学报, 2024, 33(9): 1471-1481. |
| [9] | 张雯, 郑天, 刘永超, 钟捷, 苏杰, 李加林. 基于电路理论的浙江省生态保护修复关键区域识别[J]. 生态环境学报, 2024, 33(9): 1482-1494. |
| [10] | 奥勇, 张龙, 王晓峰, 吴彦芸, 唐冰倩, 张亦恒. 基于“自然-社会”视角的陕西省土地利用变化碳核算与演变格局分析[J]. 生态环境学报, 2024, 33(8): 1306-1317. |
| [11] | 王雯, 侯青青, 裴婷婷. 甘肃河东地区坡度对生态系统服务的影响及其阈值效应[J]. 生态环境学报, 2024, 33(7): 1117-1129. |
| [12] | 王美娜, 范顺祥, 舒翰俊, 张建杰, 褚力其, 法玉琦. 河南省土壤侵蚀时空分异特征及土壤保持经济价值[J]. 生态环境学报, 2024, 33(5): 730-744. |
| [13] | 程鹏, 孙明东, 宋晓伟. 中国灰水足迹时空动态演进及驱动因素研究[J]. 生态环境学报, 2024, 33(5): 745-756. |
| [14] | 李慧, 邓佳伟, 李亚鑫, 母滢琦. 秦岭北麓典型流域径流对气候和土地利用变化的响应——以灞河流域为例[J]. 生态环境学报, 2024, 33(5): 802-811. |
| [15] | 李霞, 陈永昊, 陈喆, 张国壮, 唐梦雅. 中国沿海地区植被NDVI时空变化及驱动力分析[J]. 生态环境学报, 2024, 33(2): 180-191. |
| 阅读次数 | ||||||
|
全文 |
|
|||||
|
摘要 |
|
|||||