生态环境学报 ›› 2025, Vol. 34 ›› Issue (3): 401-410.DOI: 10.16258/j.cnki.1674-5906.2025.03.007
郭昭1,2( ), 师芸1,2,*(), 刘铁铭3, 张雨欣1,2, 闫永智1,2
收稿日期:2024-08-23
出版日期:2025-03-18
发布日期:2025-03-24
通讯作者:
*师芸。E-mail: shiyun0908@hotmail.com作者简介:郭昭(2000年生),男,硕士研究生,主要研究方向为生态遥感。E-mail: 22210061014@stu.xust.edu.cn
基金资助:
GUO Zhao1,2(), SHI Yun1,2,*(), LIU Tieming3, ZHANG Yuxin1,2, YAN Yongzhi1,2
Received:2024-08-23
Online:2025-03-18
Published:2025-03-24
摘要:
为探究秦岭北麓植被NPP的分布状况、演变规律及驱动因素,准确评估秦岭北麓植被生产能力,实现区域生态可持续发展,达成碳中和提供参考依据。利用改进CASA模型对秦岭北麓2001-2020年植被NPP进行估算,并利用趋势分析法、相关性分析法以及地理探测器对研究区植被NPP的时空演变特征和驱动因素进行研究。结果表明,秦岭北麓2001-2020年植被NPP呈波动上升的趋势,年均NPP为719.50 g∙m−2(以C计,下同),空间分布呈现南高北低的分布格局,季节差异明显,夏季NPP最高,约占全年NPP总量的51.13%;降雨、气温和太阳辐射3种气候因子与植被NPP整体呈现正相关关系,正相关区域占比分别为73.26%、65.81%、87.15%;植被NPP受多种驱动因子共同影响,从单一影响因子来看,气温、海拔以及降水是驱动秦岭北麓NPP变化的主要因子,其q值分别为0.68、0.61、0.56,从双因子交互来看,气温和土地利用类型交互作用下对NPP变化的解释力更强,其q值为0.73,从不同修复单元来看,不同影响因素对不同修复单元内植被NPP驱动力大小并不相同,反应了植被NPP对不同影响因子的响应具有显著的区域差异性和复杂性。研究结果可为秦岭北麓植被监测、生态环境保护提供科学参考。
中图分类号:
郭昭, 师芸, 刘铁铭, 张雨欣, 闫永智. 2001-2020年秦岭北麓NPP时空格局及驱动因素分析[J]. 生态环境学报, 2025, 34(3): 401-410.
GUO Zhao, SHI Yun, LIU Tieming, ZHANG Yuxin, YAN Yongzhi. Analysis of Spatiotemporal Patterns and Driving Factors of NPP on the Northern Slope of the Qinling Mountains from 2001 to 2020[J]. Ecology and Environment, 2025, 34(3): 401-410.

图1 研究区概况图
Figure 1 Overview map of the studied area
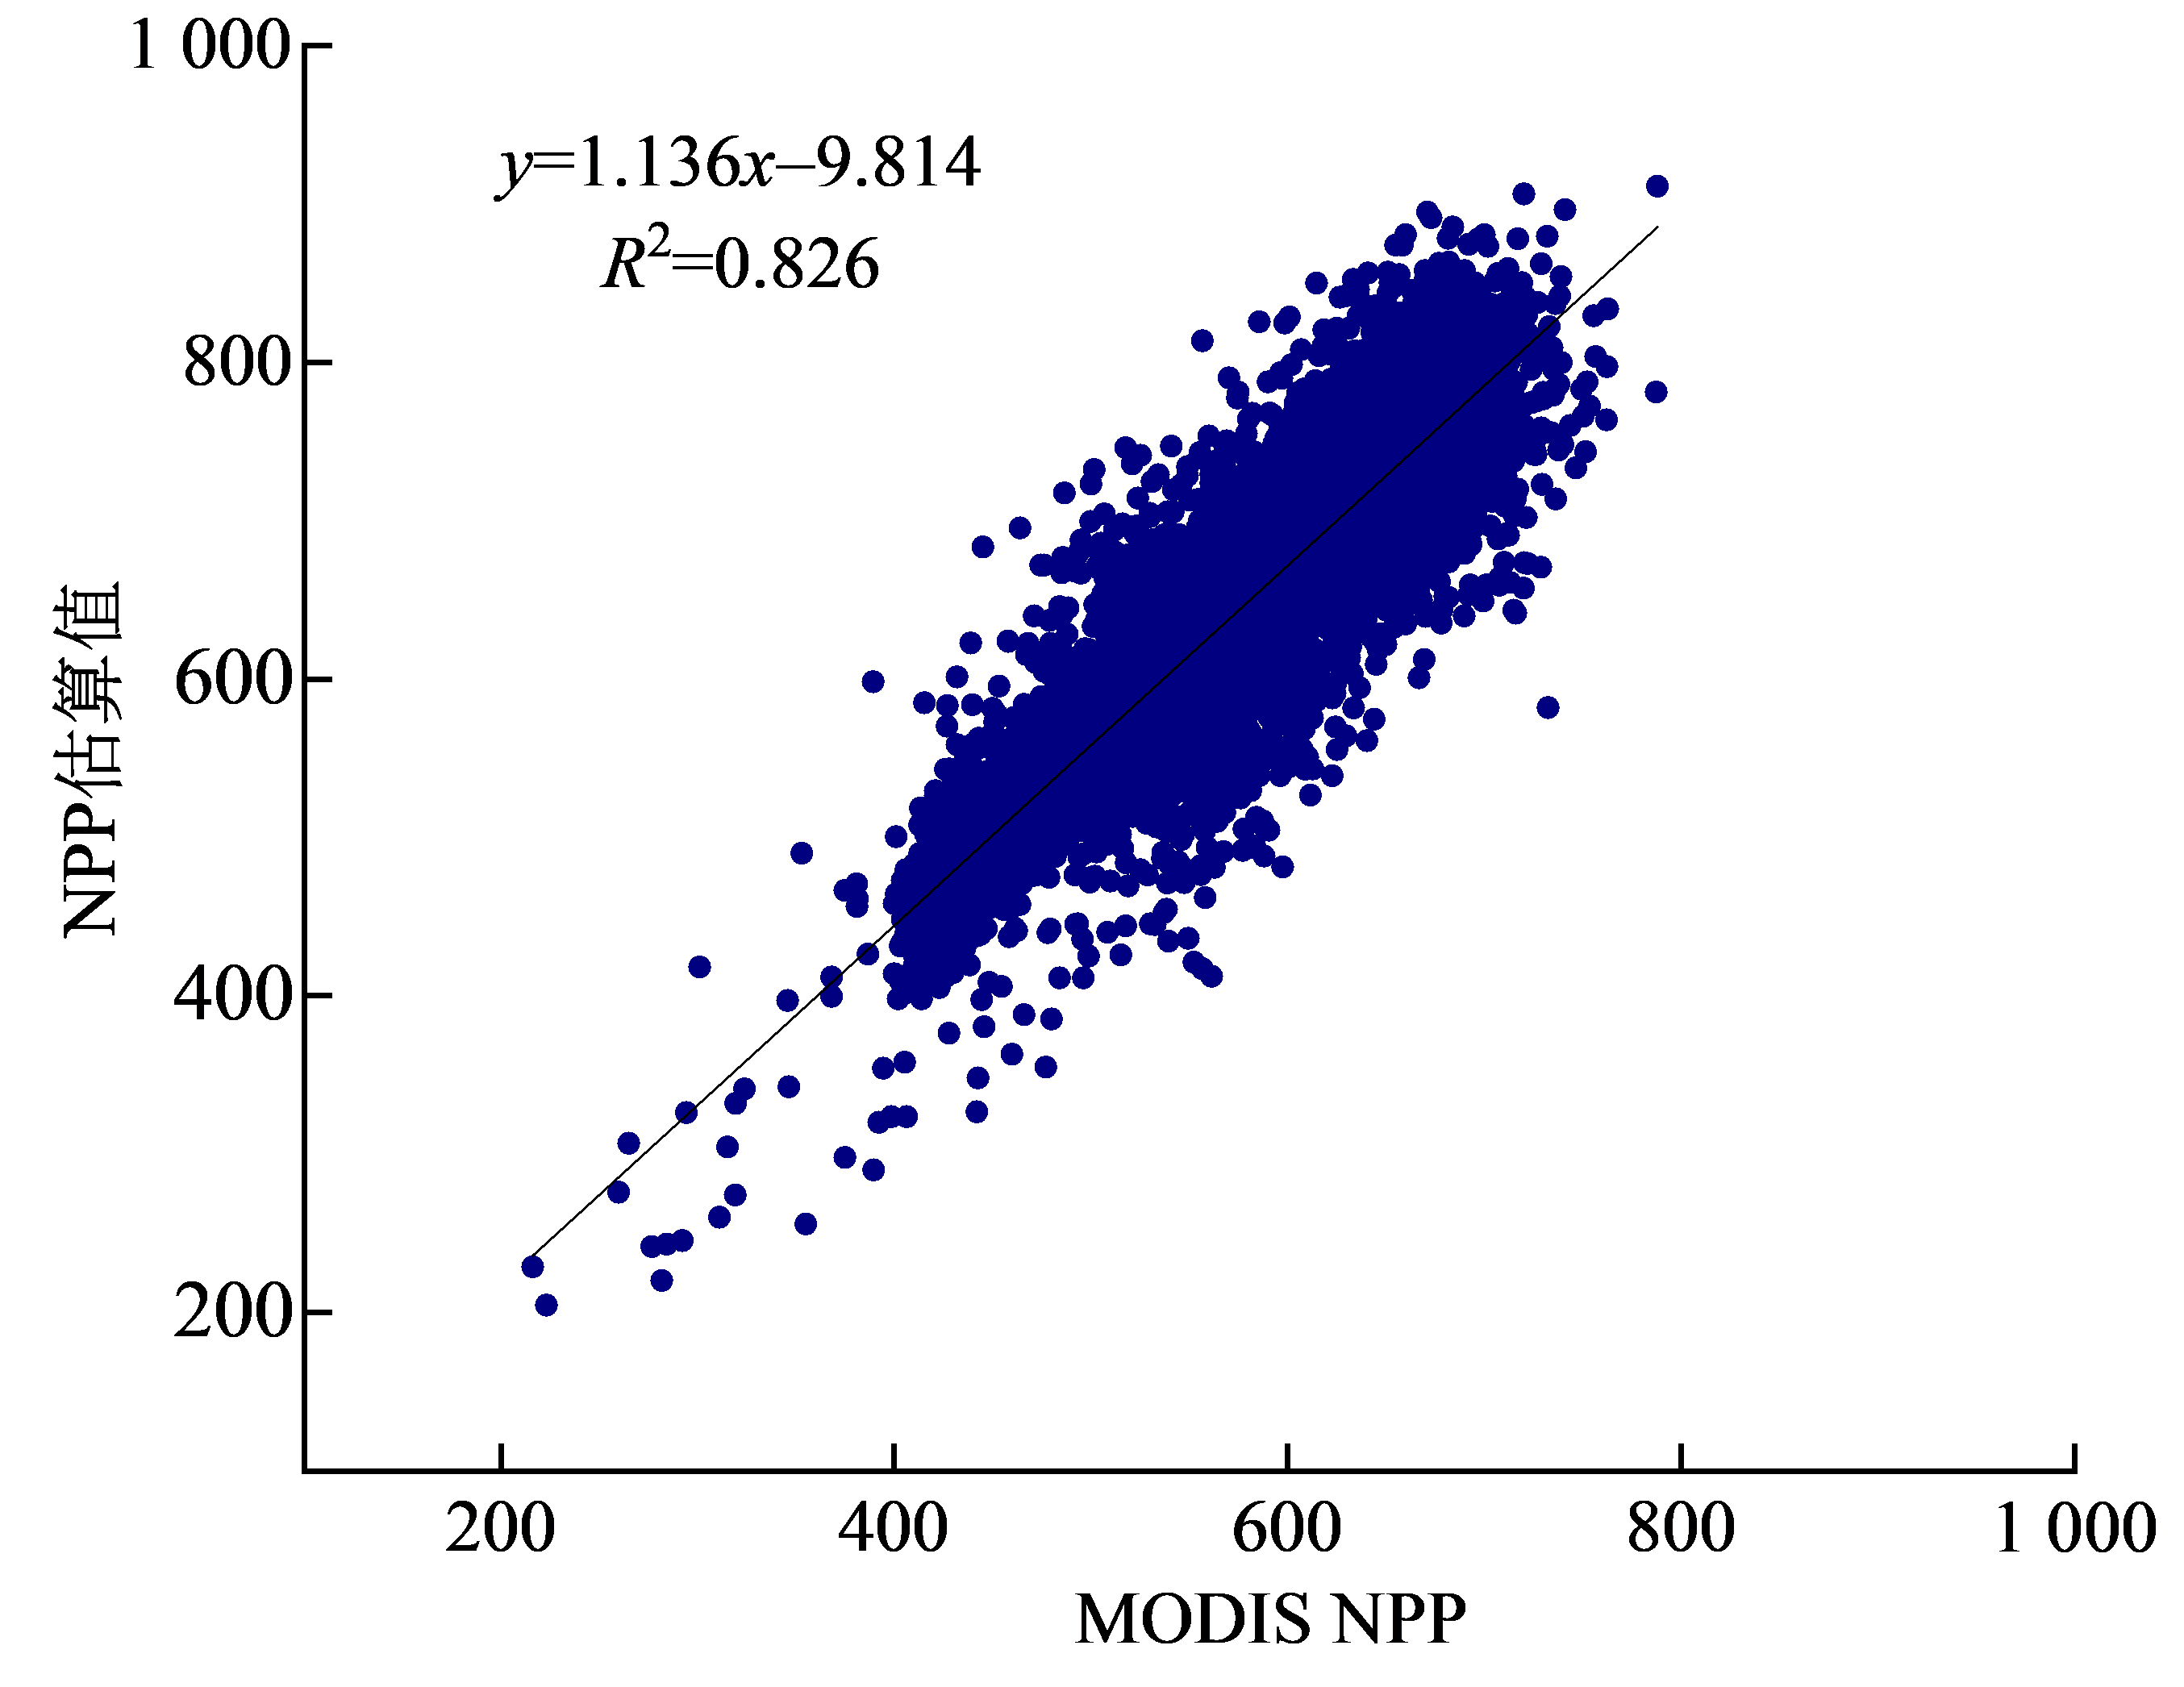
图2 NPP精度验证
Figure 2 Validation of estimated NPP
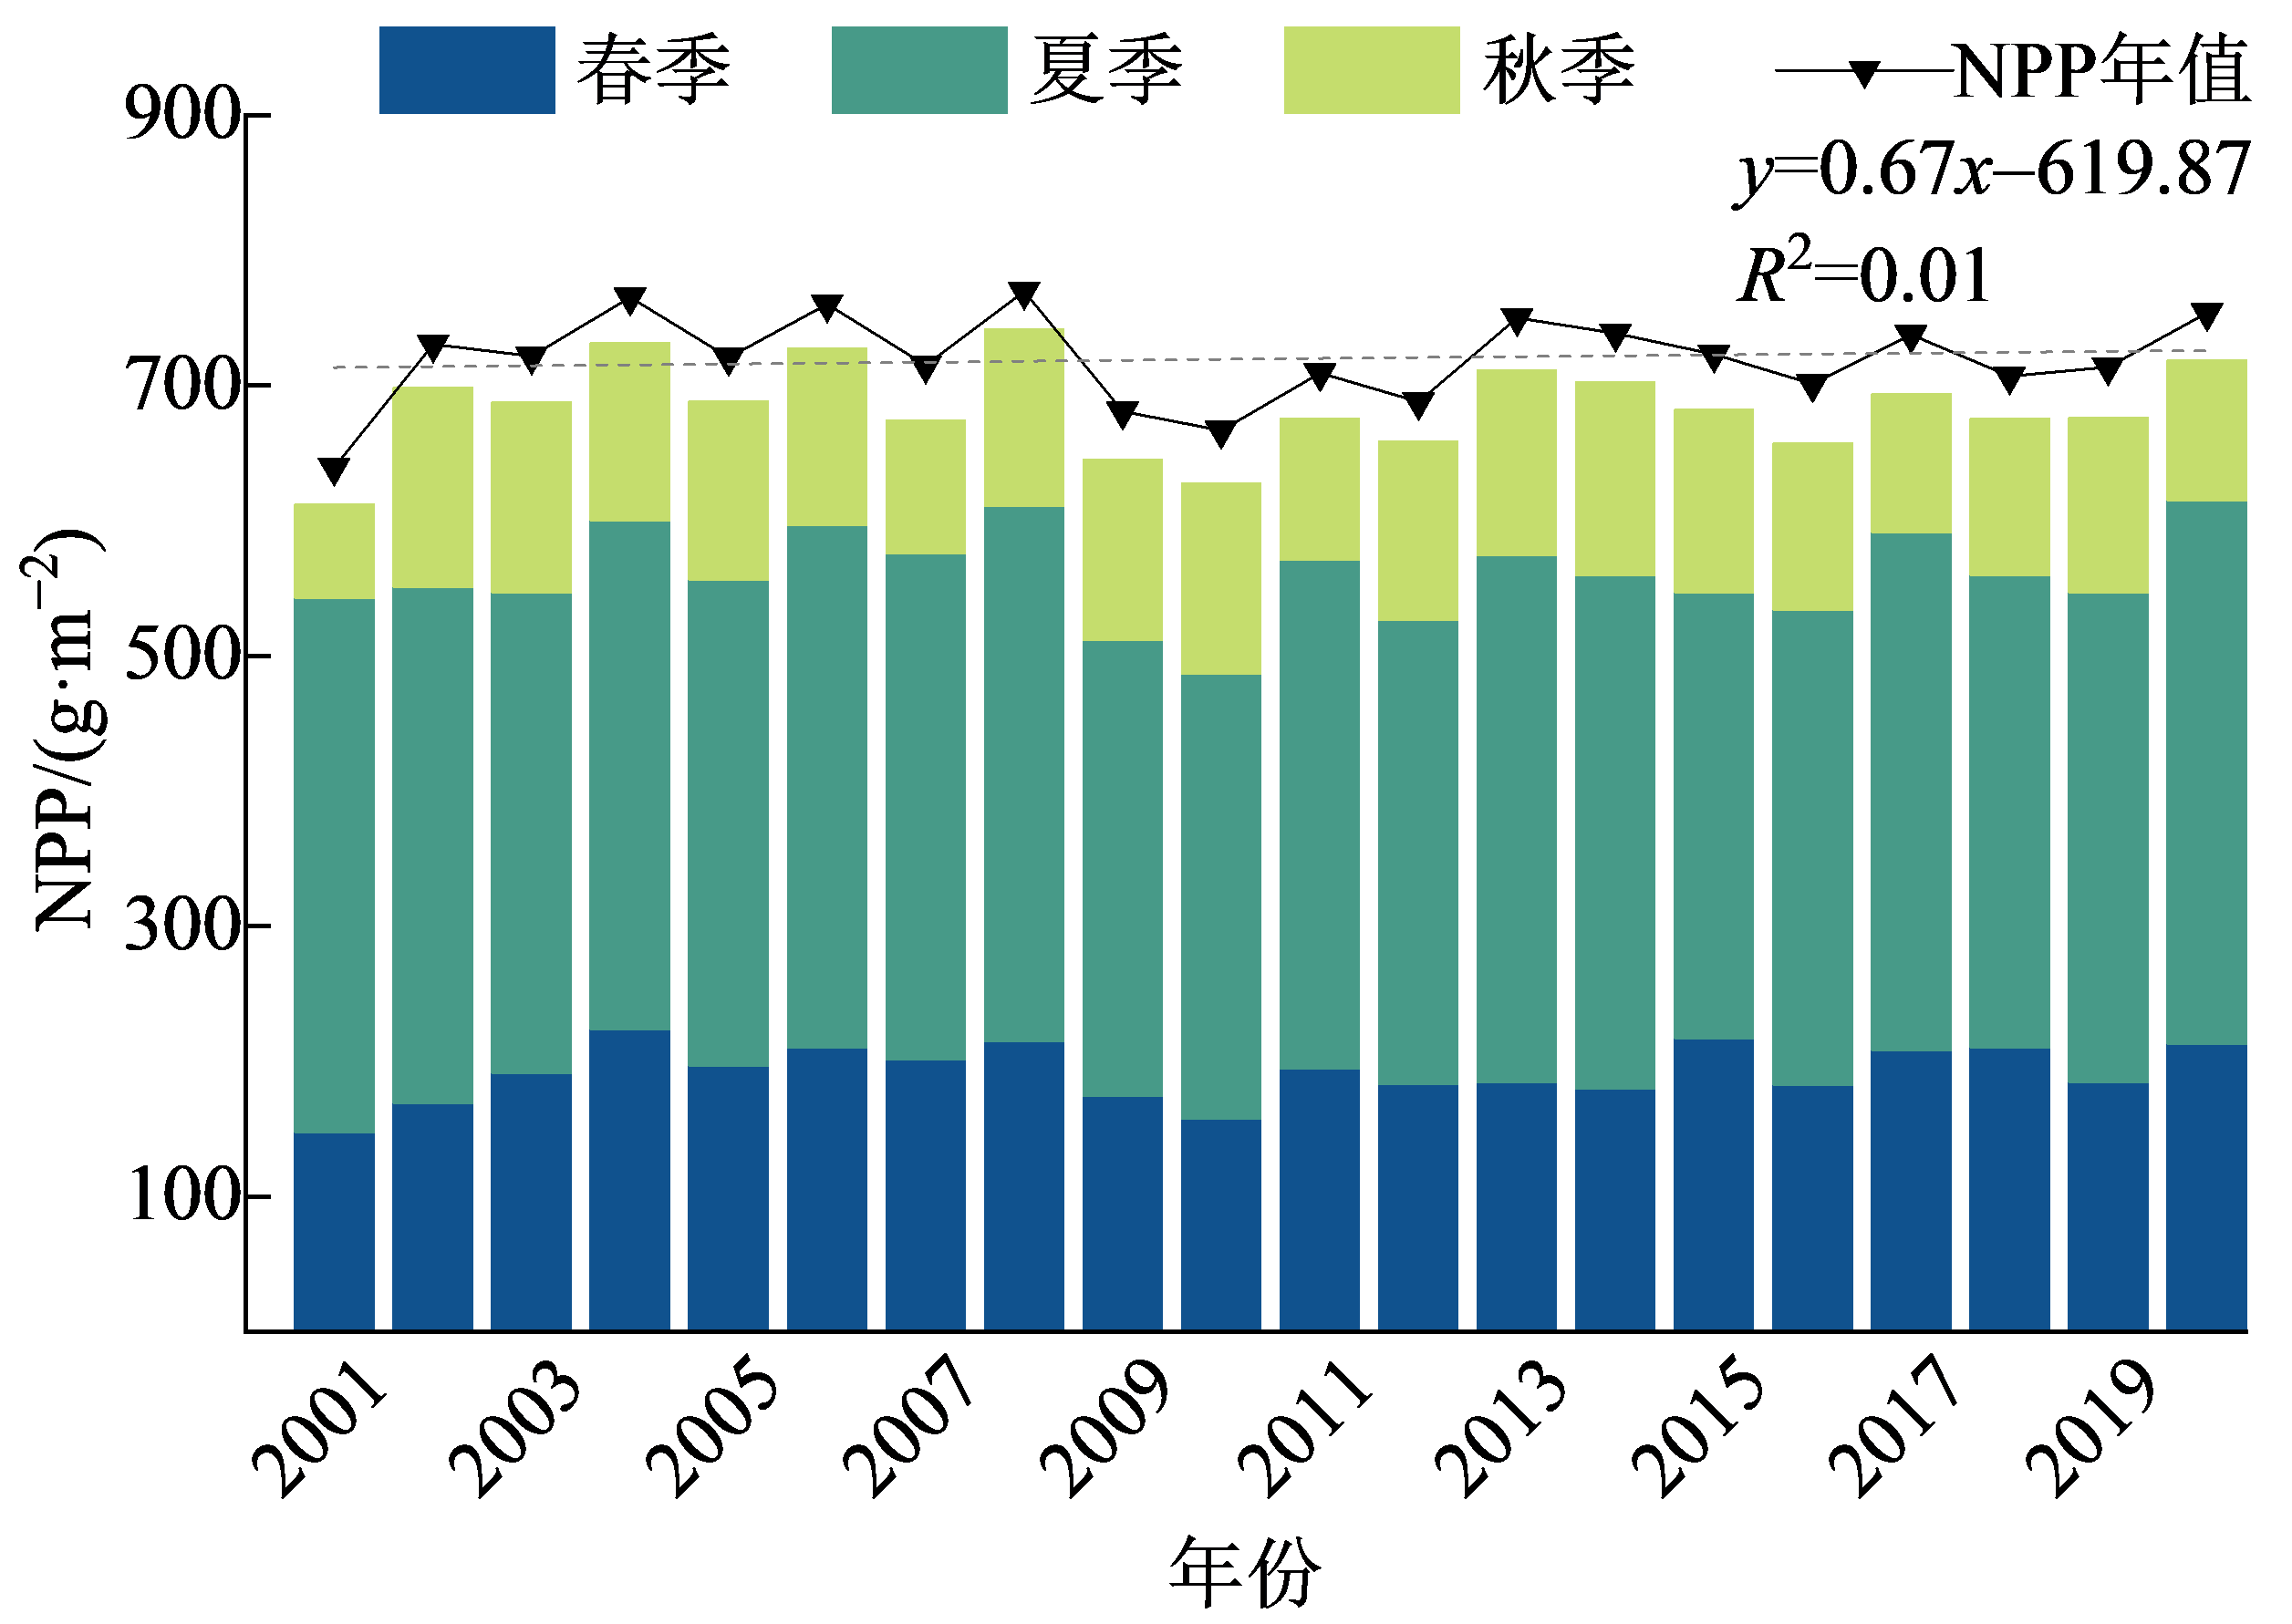
图3 2001-2020年NPP季度、年度变化趋势
Figure 3 Trends of seasonal and annual NPP changes from 2001 to 2020
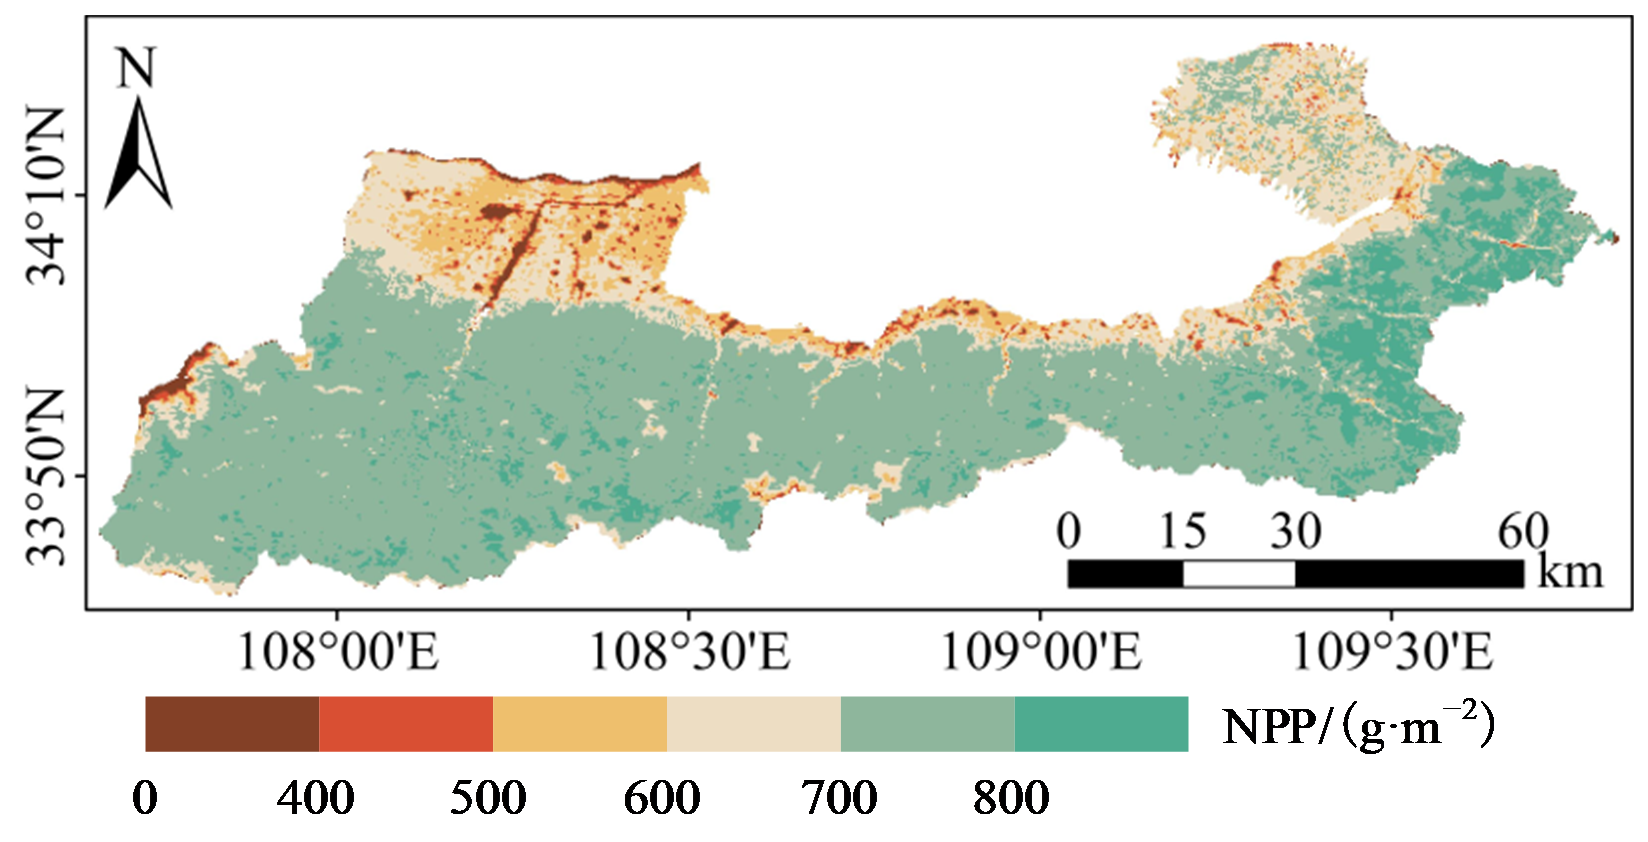
图4 2001-2020年秦岭北麓NPP均值
Figure 4 Mean NPP of the northern slopes of the Qinling Mountains from 2001 to 2020
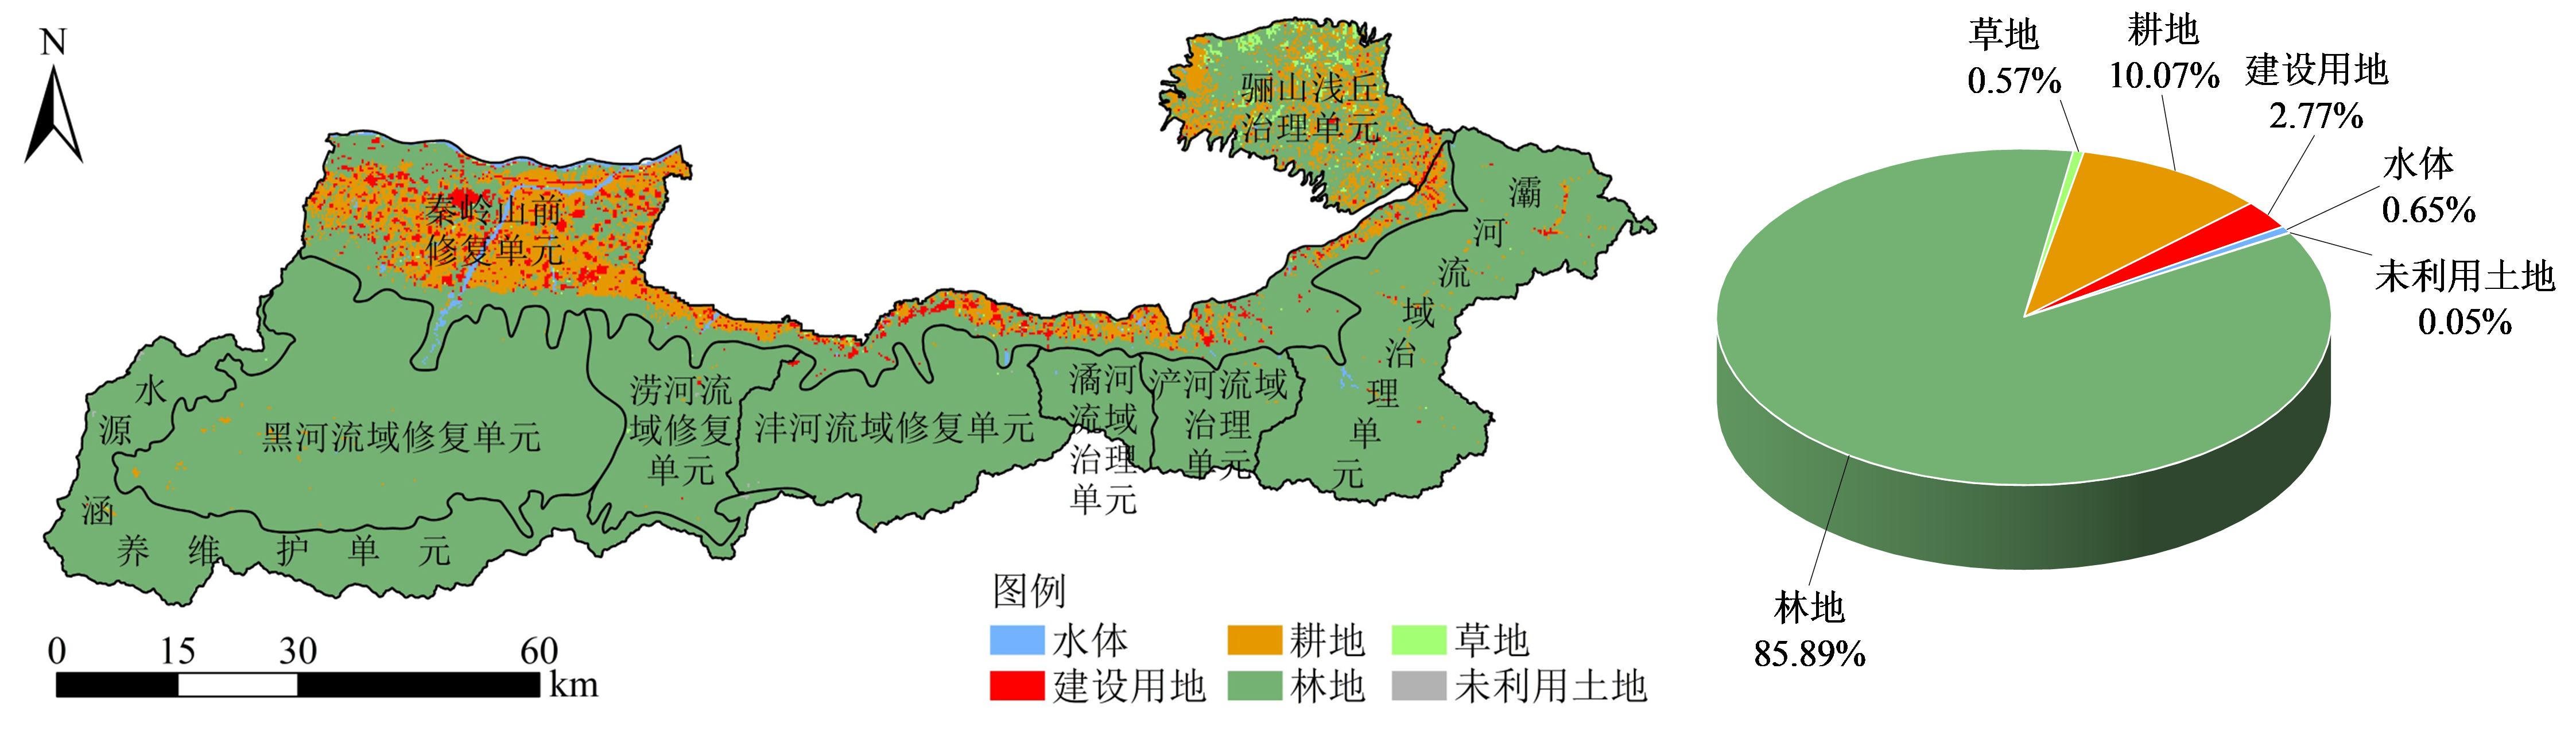
图5 秦岭北麓土地利用类型图及面积占比
Figure 5 Land use type map and area proportion of the northern slopes of the Qinling Mountains
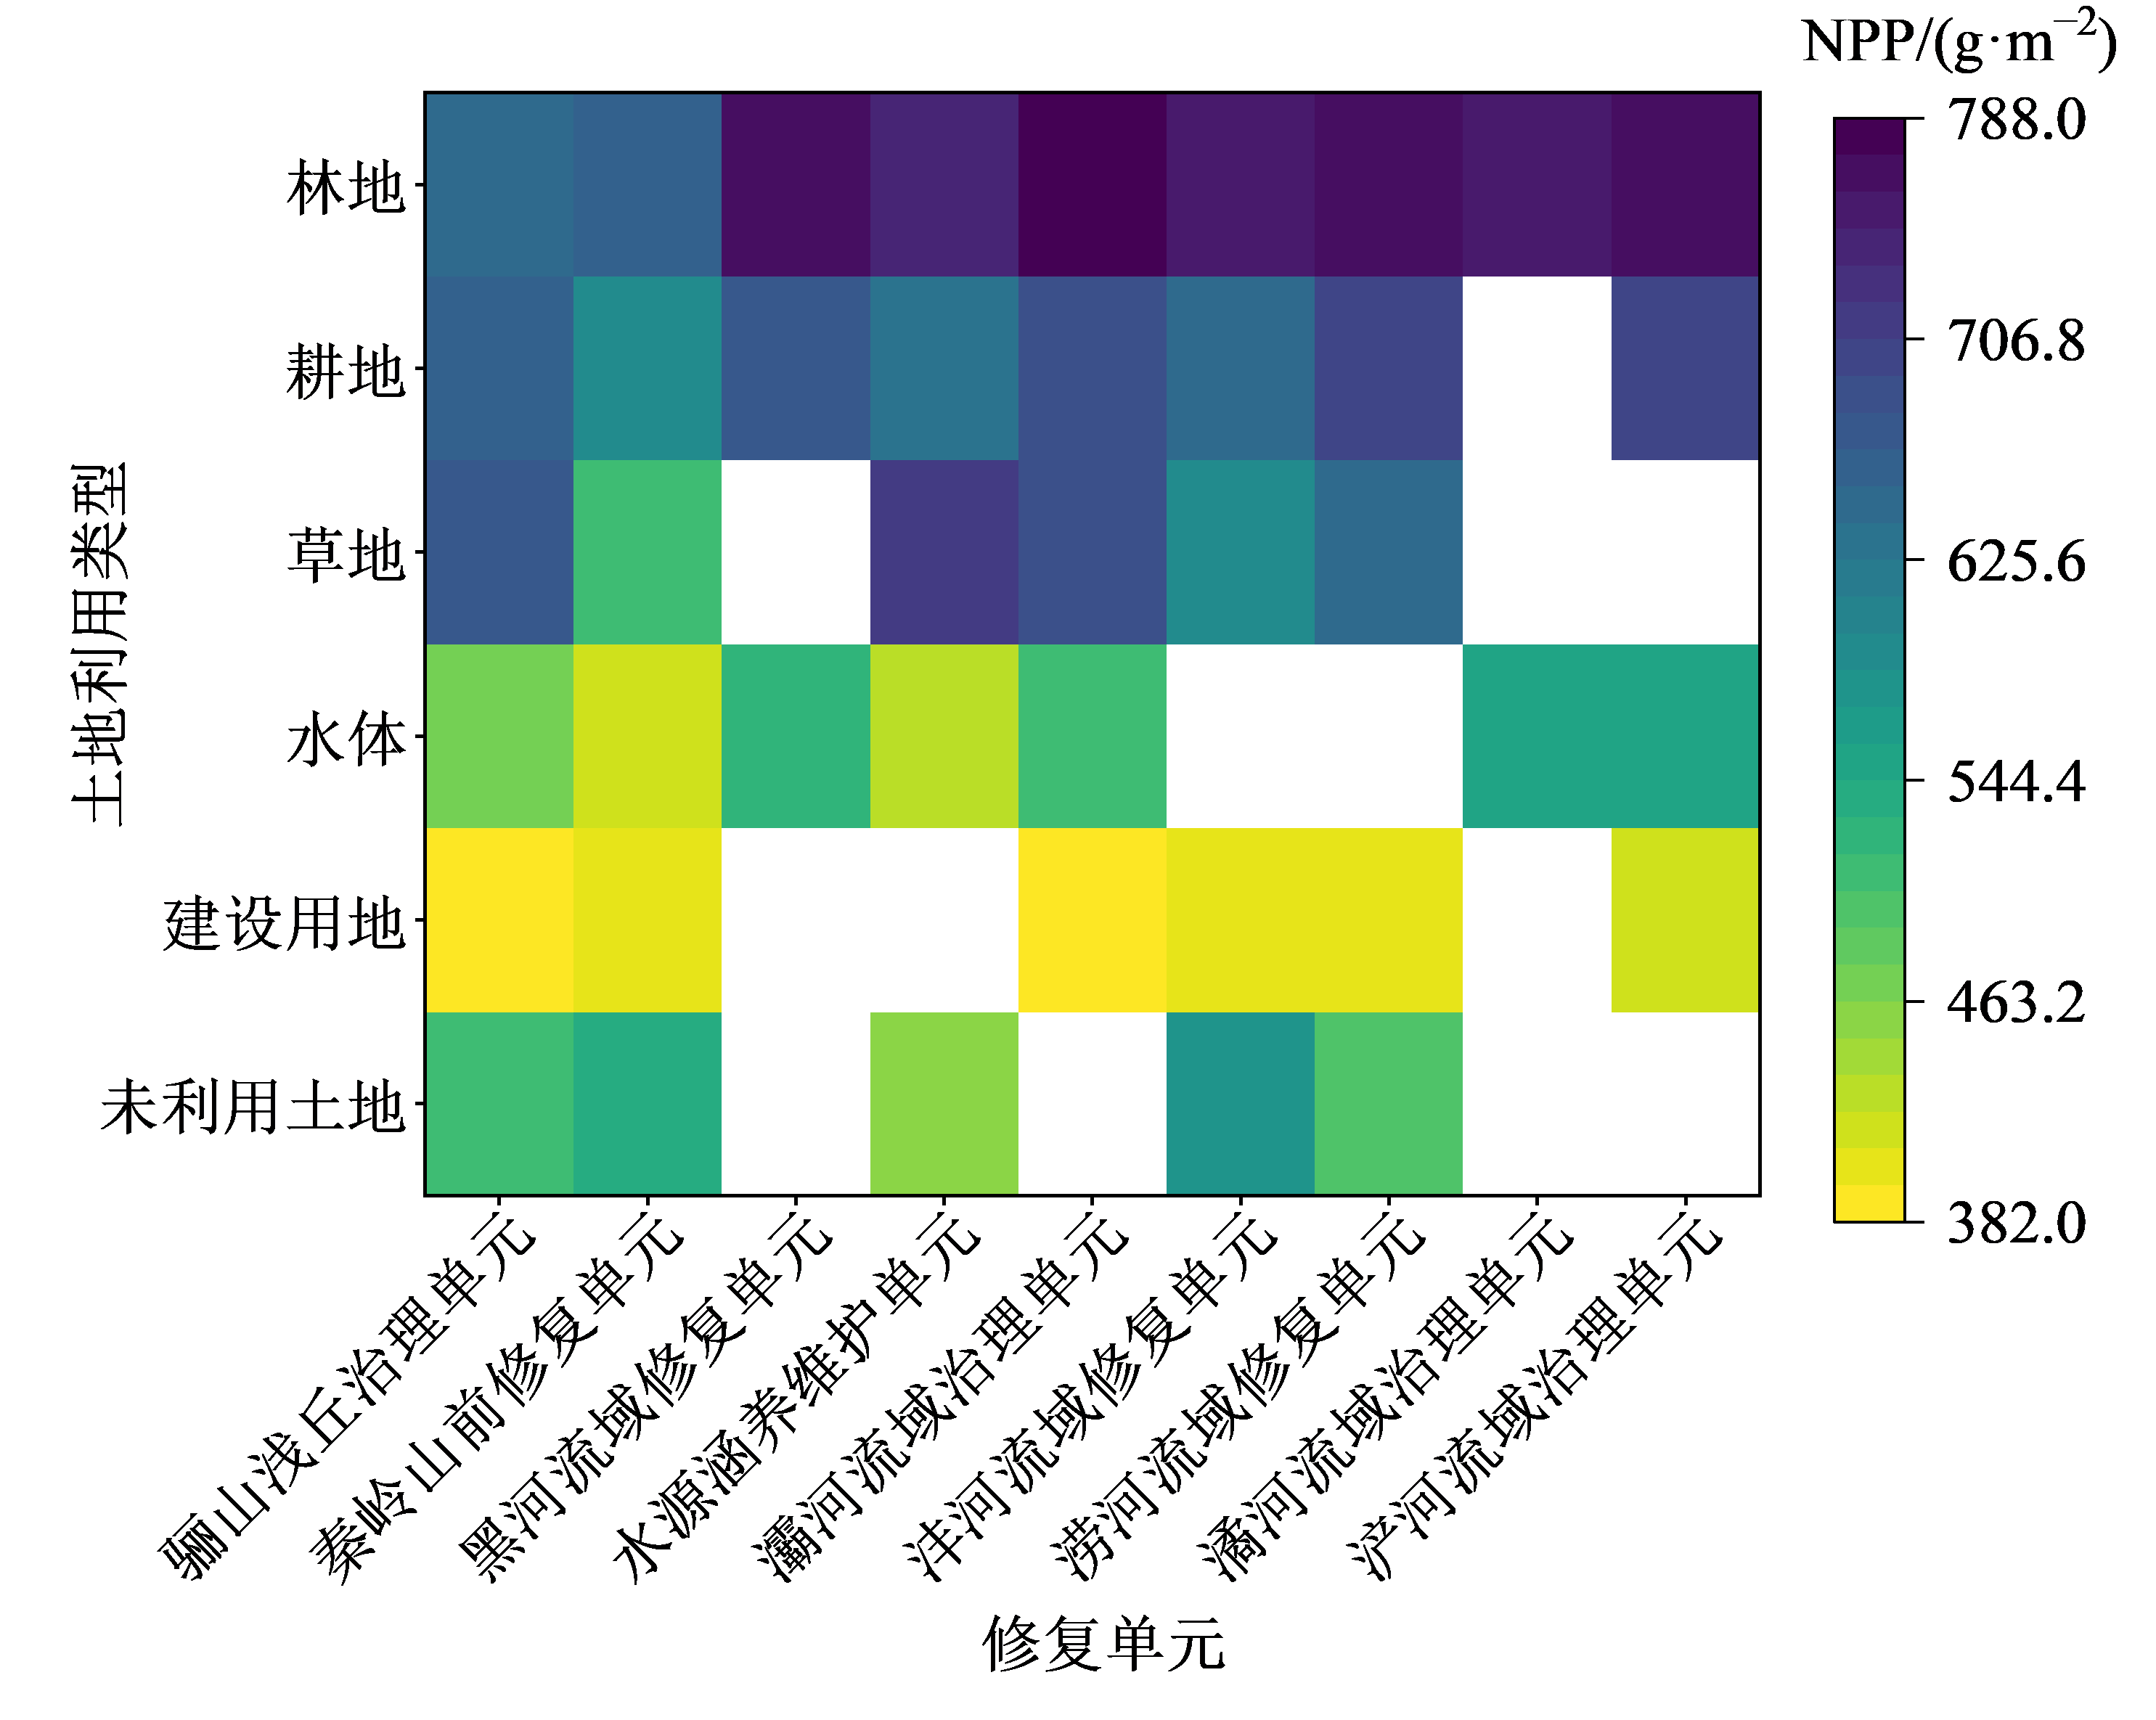
图6 各修复单元不同土地利用类型NPP均值
Figure 6 Mean NPP of different land use types in each restoration unit

图7 2001-2020年不同阶段秦岭北麓植被NPP变化趋势
Figure 7 Trends of vegetation NPP changes in the northern slopes of the Qinling Mountains during different periods from 2001 to 2020
| 变化趋势 | 2001-2005年 | 2006-2010年 | 2011-2015年 | 2016-2020年 | 2001-2020年 |
|---|---|---|---|---|---|
| 显著降低 | 0.26 | 4.65 | 0.55 | 0.32 | 3.66 |
| 轻度降低 | 7.49 | 84.02 | 33.34 | 0.71 | 17.78 |
| 基本不变 | 2.29 | 1.37 | 3.32 | 1.29 | 2.48 |
| 轻度增加 | 86.43 | 9.34 | 60.10 | 94.11 | 53.16 |
| 显著增加 | 3.53 | 0.62 | 2.69 | 3.57 | 22.92 |
表1 植被NPP空间变化趋势面积占比
Table 1 Area proportion of spatial trends in vegetation NPP %
| 变化趋势 | 2001-2005年 | 2006-2010年 | 2011-2015年 | 2016-2020年 | 2001-2020年 |
|---|---|---|---|---|---|
| 显著降低 | 0.26 | 4.65 | 0.55 | 0.32 | 3.66 |
| 轻度降低 | 7.49 | 84.02 | 33.34 | 0.71 | 17.78 |
| 基本不变 | 2.29 | 1.37 | 3.32 | 1.29 | 2.48 |
| 轻度增加 | 86.43 | 9.34 | 60.10 | 94.11 | 53.16 |
| 显著增加 | 3.53 | 0.62 | 2.69 | 3.57 | 22.92 |

图8 NPP与气候因子的相关性及显著性
Figure 8 Correlation and significance between NPP and climatic factors
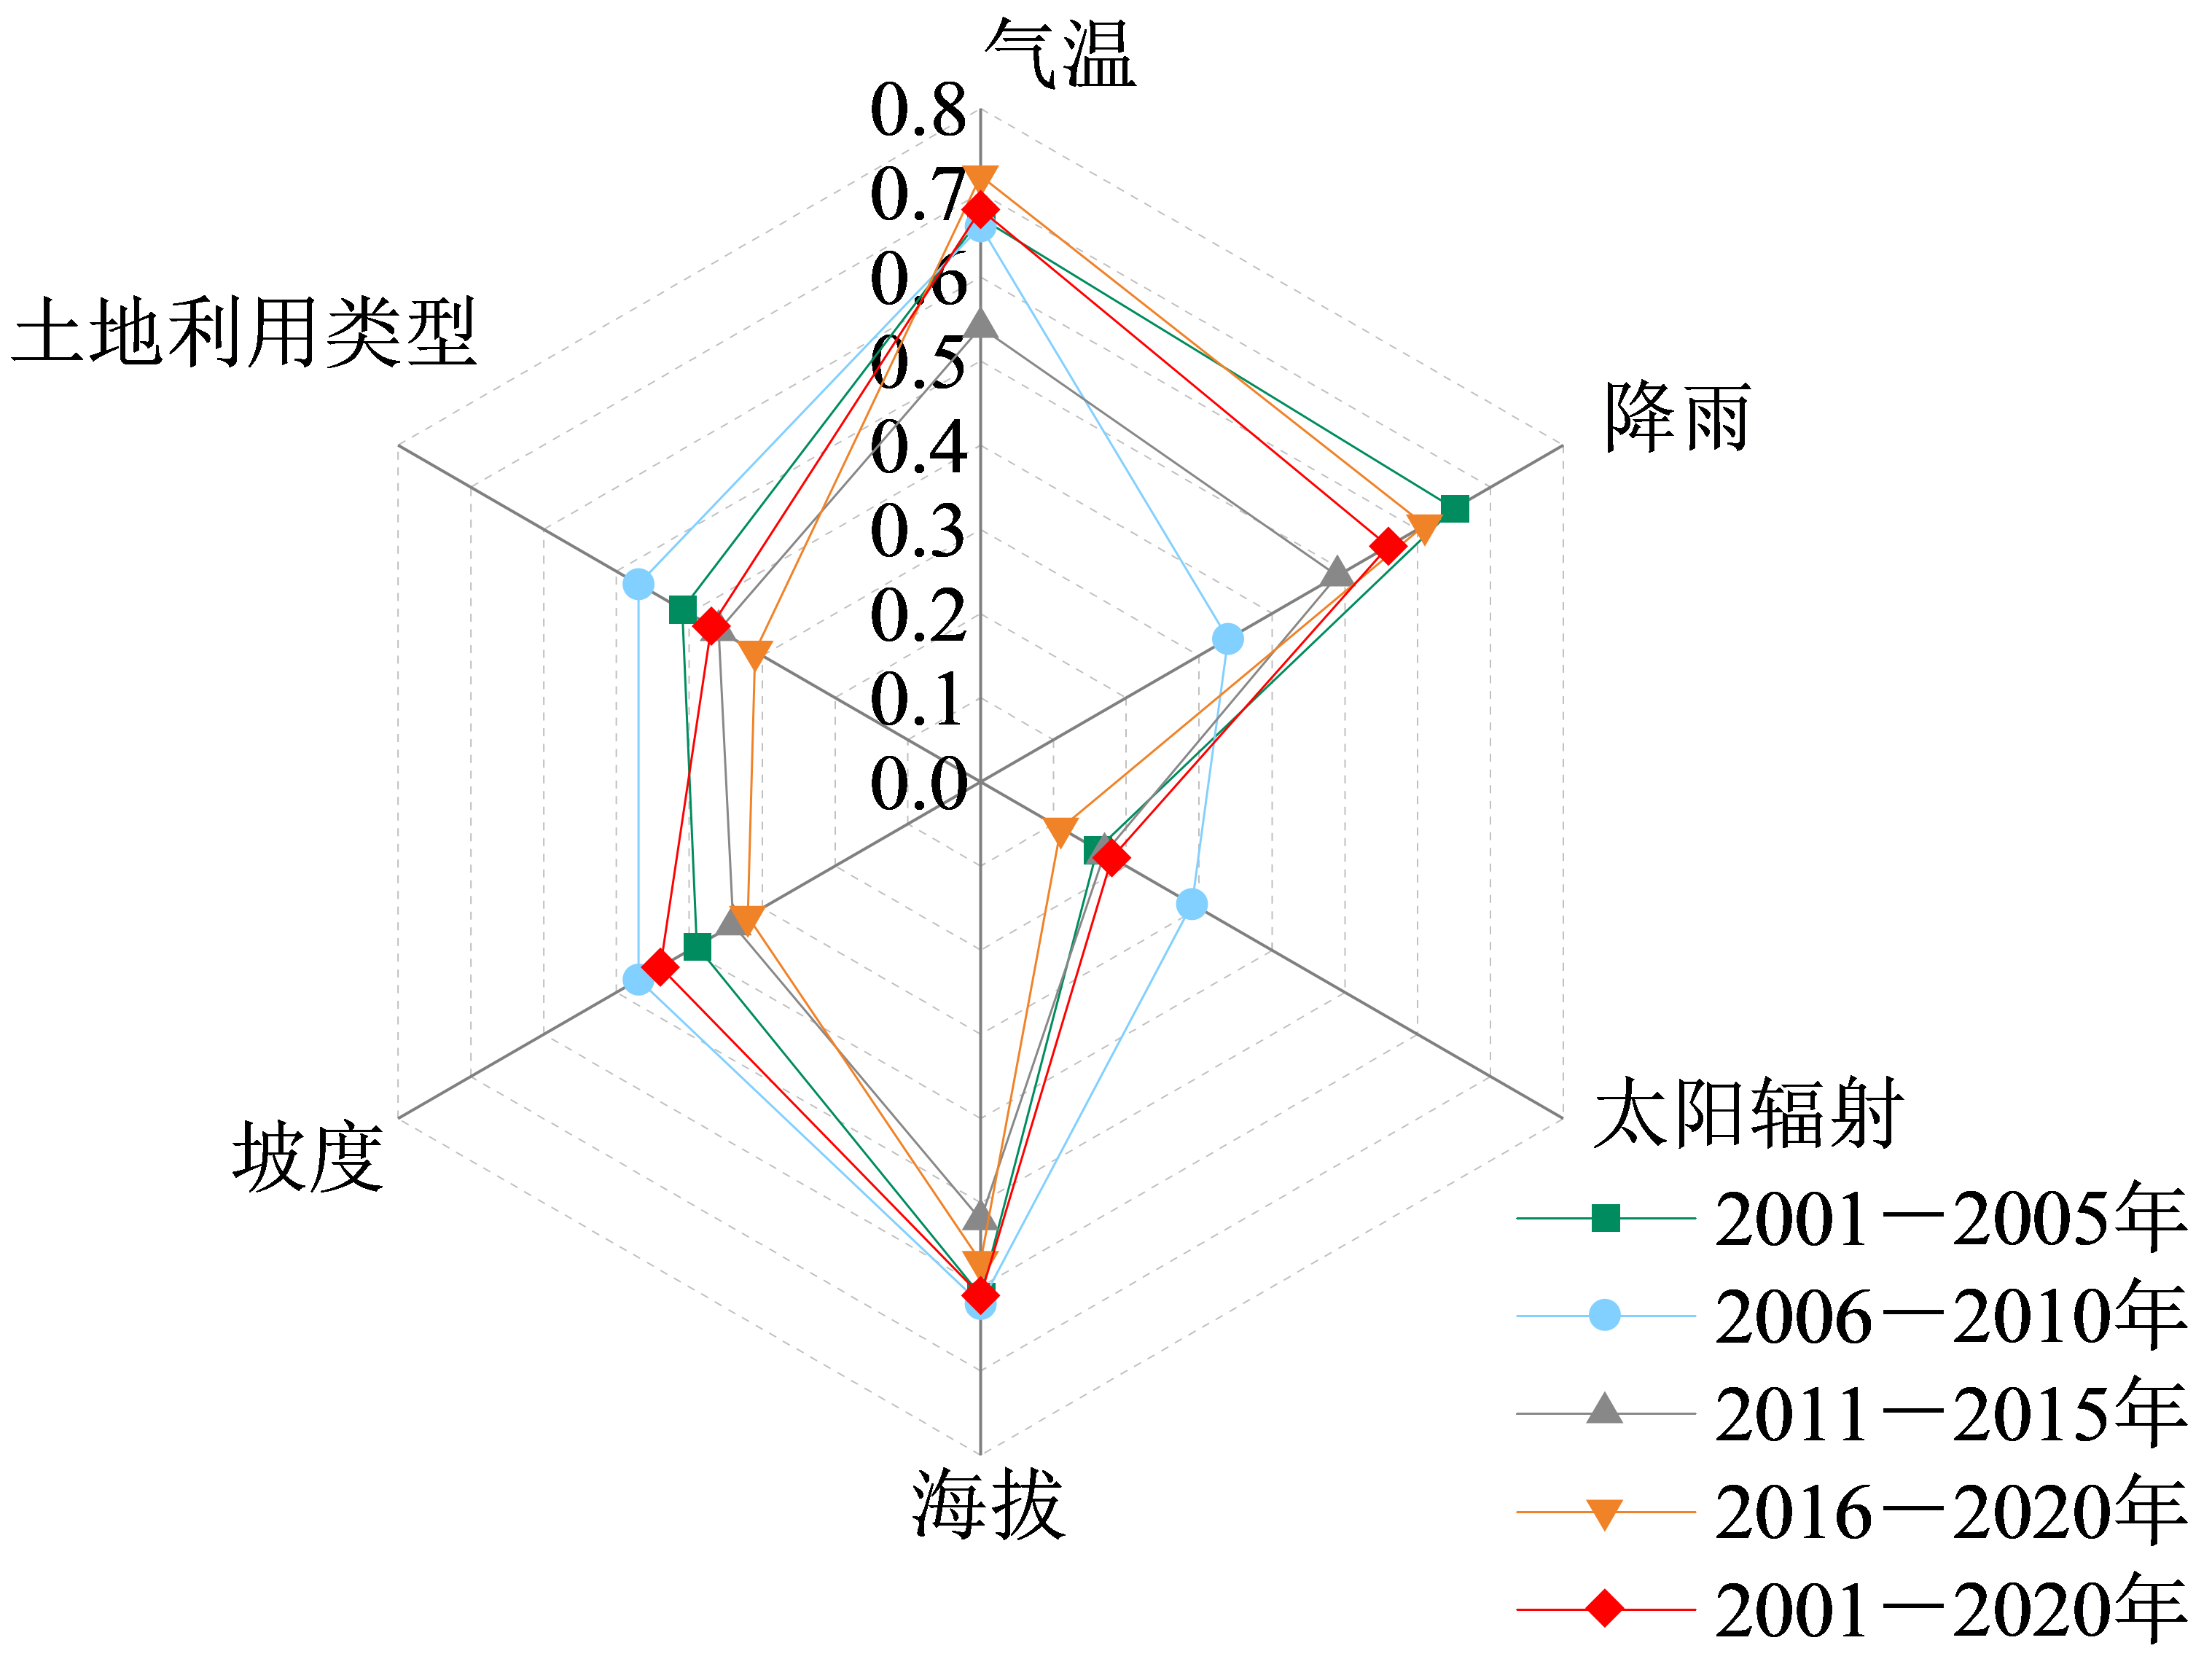
图9 NPP单因子探测结果
Figure 9 Results of single-factor detection for NPP
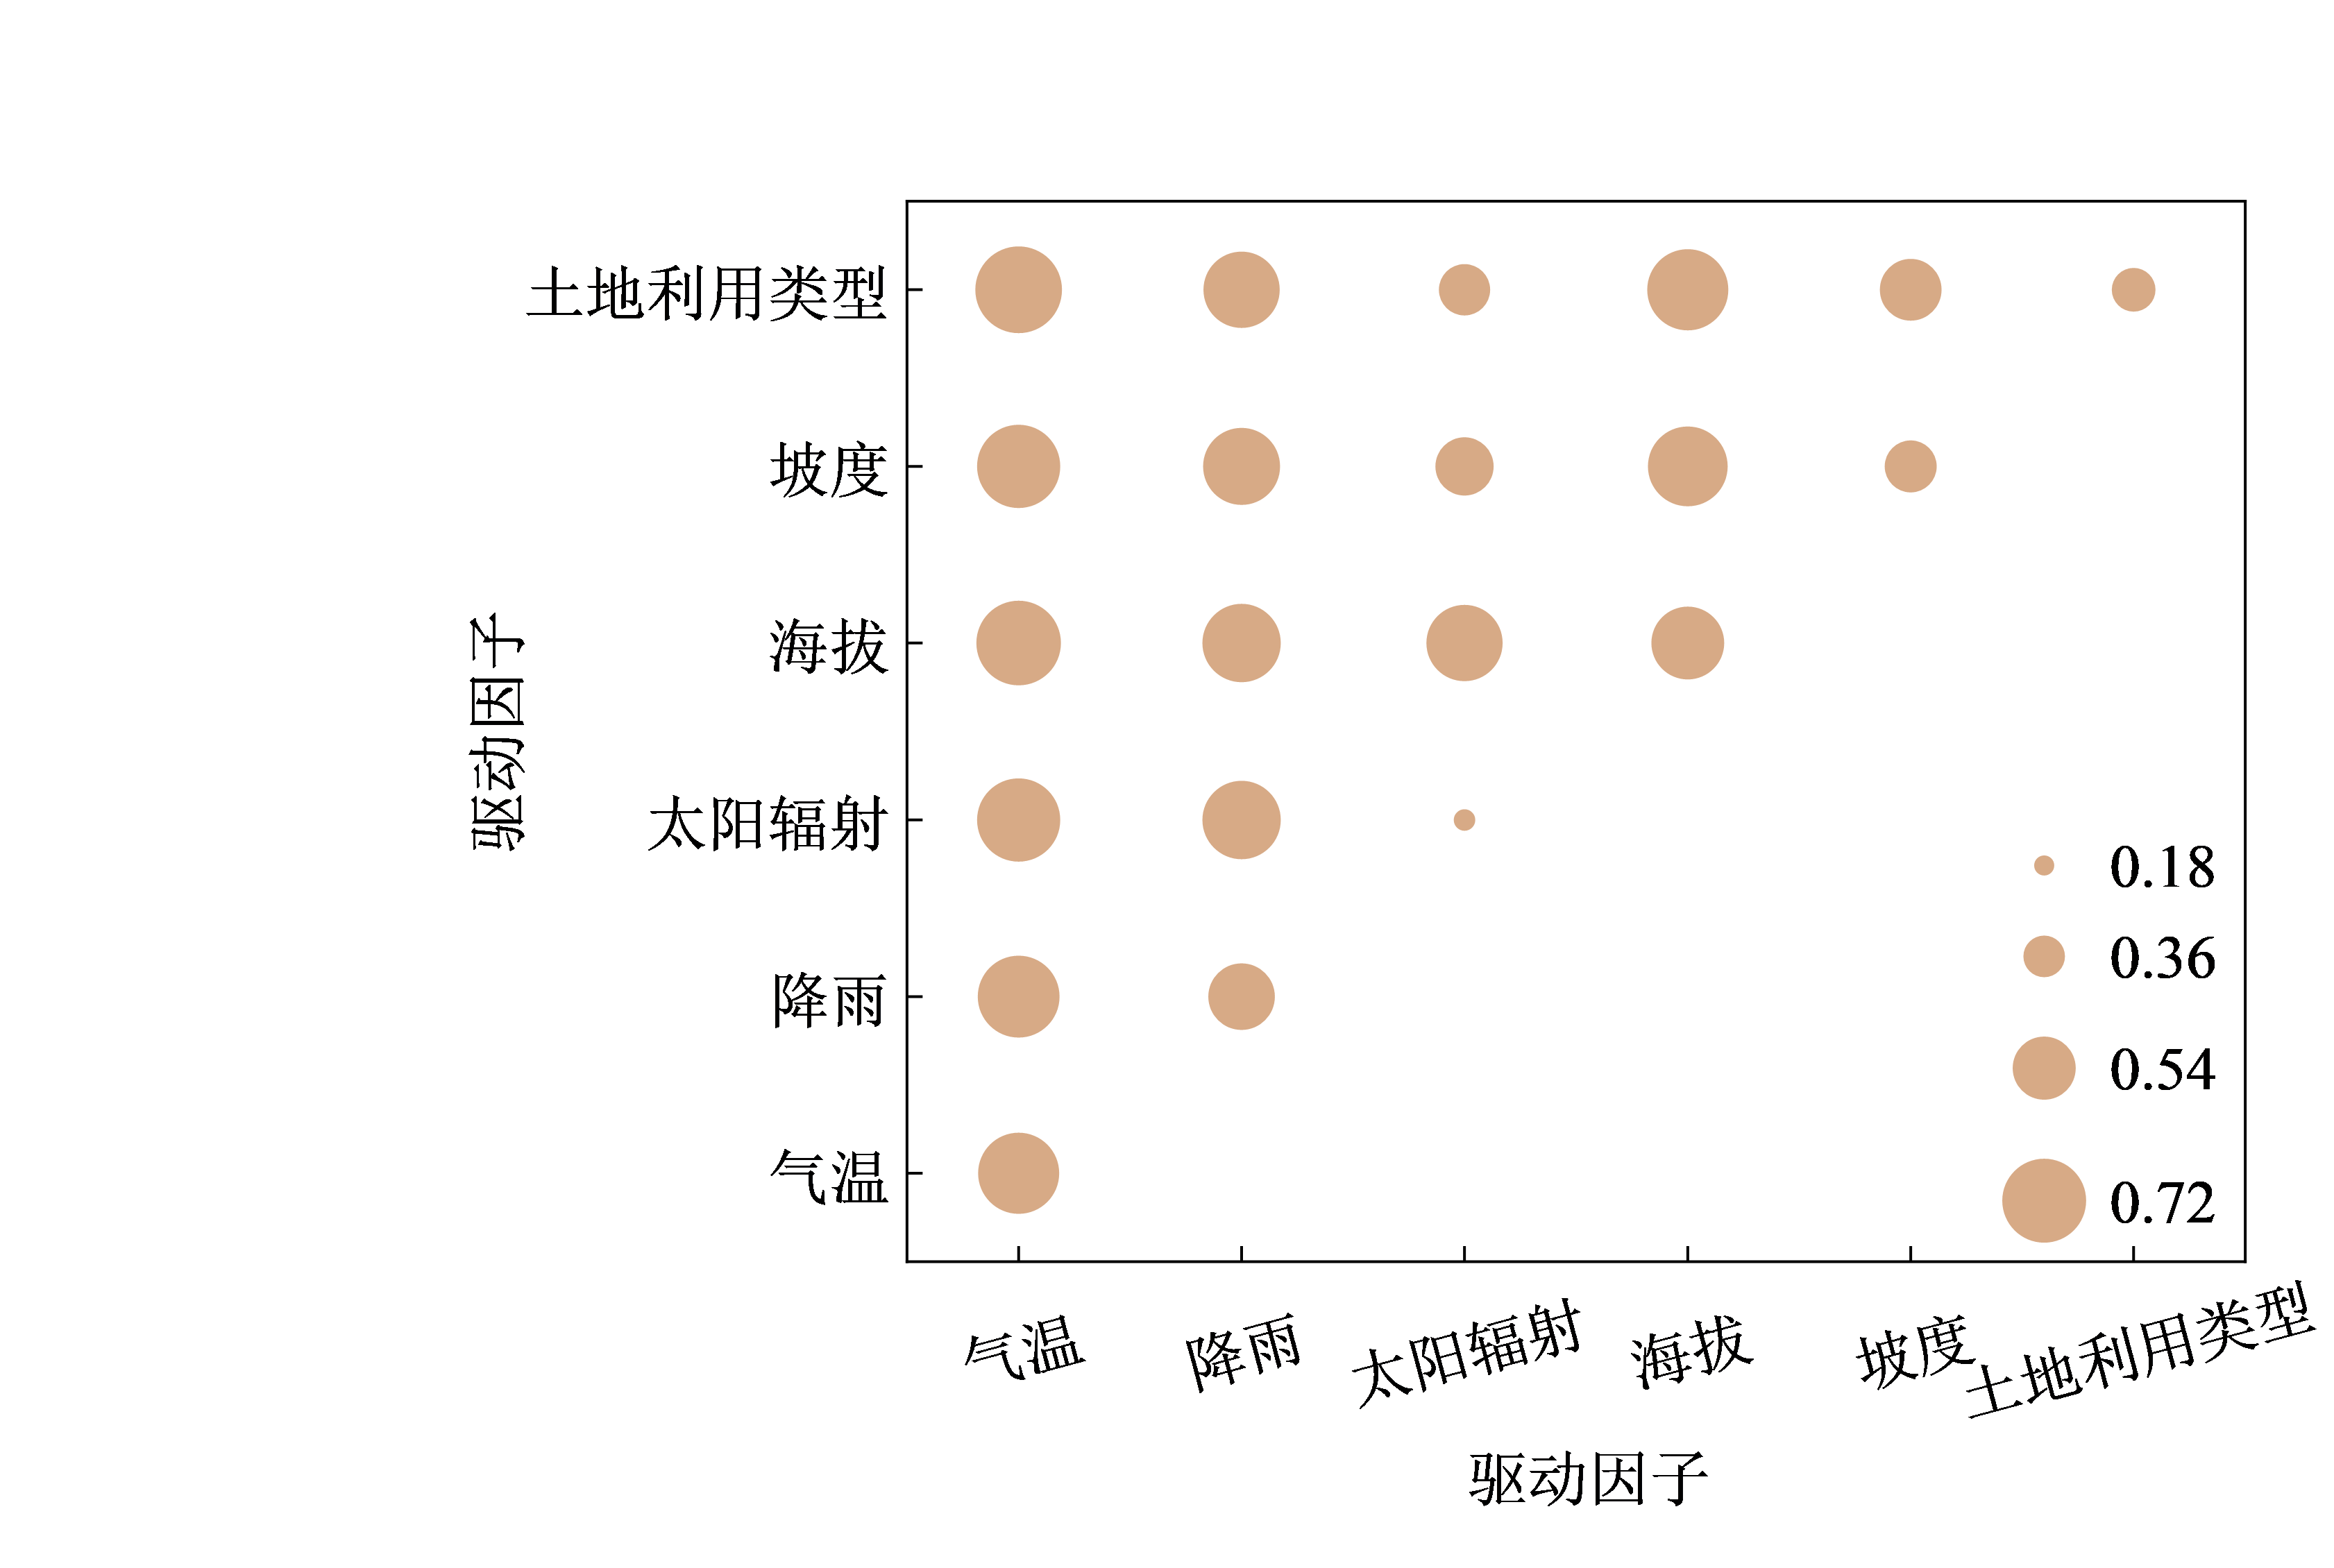
图10 NPP双因子探测结果
Figure 10 Results of dual-factor detection for NPP
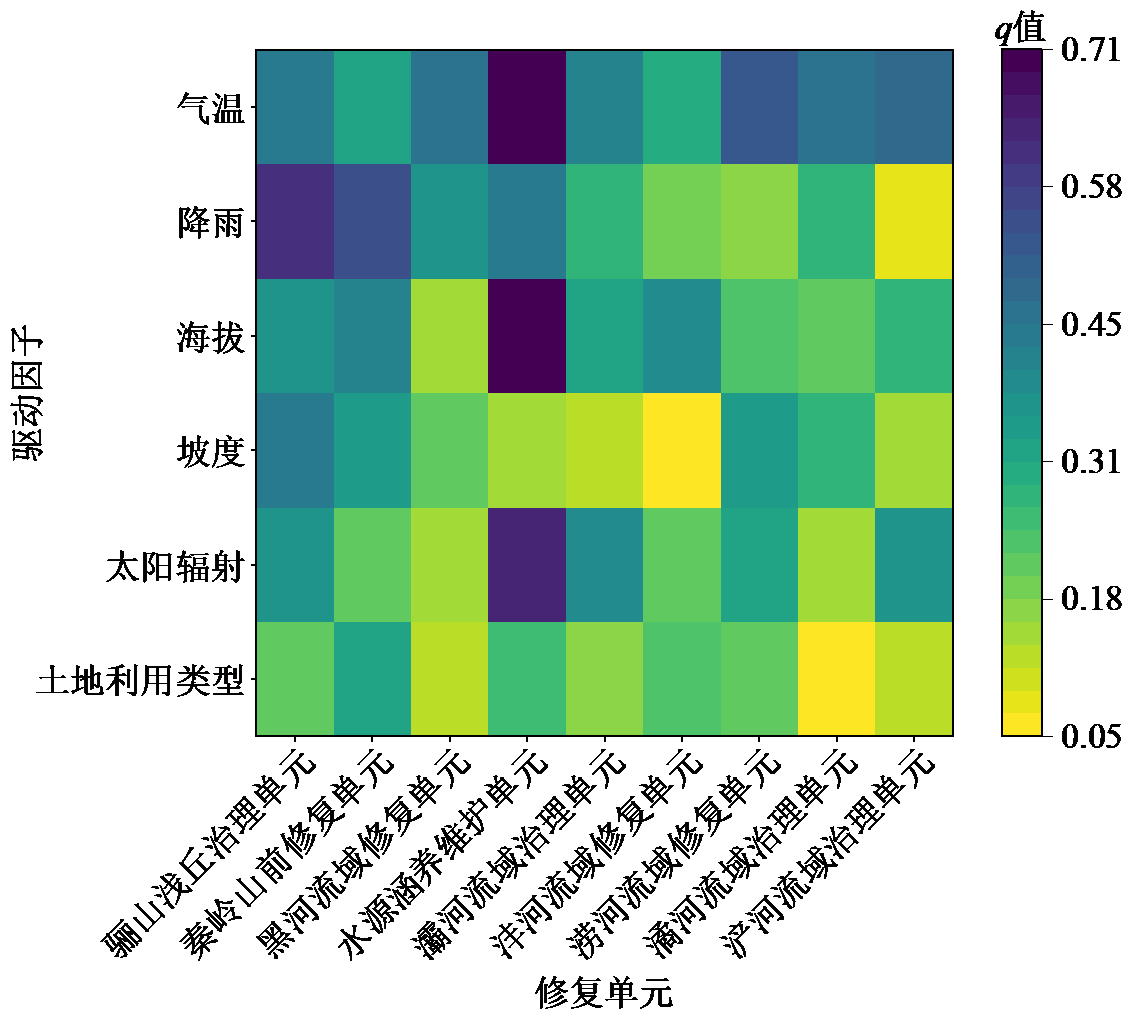
图11 各修复单元NPP驱动因子探测结果
Figure 11 Detection results of NPP driving factors in each restoration unit
| [1] | BAI Y, 2021. Analysis of vegetation dynamics in the Qinling-Daba Mountains region from MODIS time series data[J]. Ecological Indicators, 129: 108029. |
| [2] | FIELD C B, BEHRENFELD M J, RANDERSON J T, et al., 1998. Primary production of the biosphere: Integrating terrestrial and oceanic components[J]. Science, 281(5374): 237-240. |
| [3] | FIELD C B, RANDERSON J T, MALMSTRÖM C M, 1995. Global net primary production: Combining ecology and remote sensing[J]. Remote Sensing of Environment, 51(1): 74-88. |
| [4] | JIANG L L, JIAPAER G, BAO A M, et al., 2017. Vegetation dynamics and responses to climate change and human activities in Central Asia[J]. Science of The Total Environment, 599-600: 967-980. |
| [5] | POTTER C S, RANDERSON J T, FIELD C B, et al., 1993. Terrestrial ecosystem production: A process model based on global satellite and surface data[J]. Global Biogeochemical Cycles, 7(4): 811-841. |
| [6] | REN H R, SHANG Y J, ZHANG S, 2020. Measuring the spatiotemporal variations of vegetation net primary productivity in Inner Mongolia using spatial autocorrelation[J]. Ecological Indicators, 112: 106108. |
| [7] | SUN B, ZHOU Q M, 2016. Expressing the spatio-temporal pattern of farmland change in arid lands using landscape metrics[J]. Journal of Arid Environments, 124: 118-127. |
| [8] | SUN Q L, LI B L, ZHANG T, et al., 2017. An improved Biome-BGC model for estimating net primary productivity of alpine meadow on the Qinghai-Tibet Plateau[J]. Ecological Modelling, 350: 55-68. |
| [9] | WANG T, YANG M H, YAN S J, et al., 2021. Effects of temperature and precipitation on spatiotemporal variations of net primary productivity in the Qinling Mountains, China[J]. Polish Journal of Environmental Studies, 30(1): 409-422. |
| [10] |
WEN Y Y, LIU X P, BAI Y, et al., 2019. Determining the impacts of climate change and urban expansion on terrestrial net primary production in China[J]. Journal of Environmental Management, 240: 75-83.
DOI PMID |
| [11] | YU R, 2020. An improved estimation of net primary productivity of grassland in the Qinghai-Tibet region using light use efficiency with vegetation photosynthesis model[J]. Ecological Modelling, 431: 109121. |
| [12] | ZHANG X H, ZHANG B P, YAO Y H, et al., 2022. Dynamics and climatic drivers of evergreen vegetation in the Qinling-Daba Mountains of China[J]. Ecological Indicators, 136: 108625. |
| [13] | 陈超男, 王丽园, 朱文博, 等, 2024. 秦巴山地极端气候变化特征及其对植被动态的影响[J]. 水土保持学报, 38(3): 276-287. |
| CHEN C N, WANG L Y, ZHU W B, et al., 2024. Characteristics of extreme climate change in the Qinling-Daba mountains and its impact on vegetation dynamics[J]. Journal of Soil and Water Conservation, 38(3): 276-287. | |
| [14] | 赖金林, 齐实, 廖瑞恩, 等, 2023. 2000-2019年西南高山峡谷区植被变化对气候变化和人类活动的响应[J]. 农业工程学报, 39(14): 155-163. |
| LAI J L, QI S, LIAO R E, et al., 2023. Vegetation change responses to climate change and human activities in southwest alpine canyon areas of China from 2000 to 2019[J]. Transactions of the Chinese Society of Agricultural Engineering (Transactions of the CSAE), 39(14): 155-163. | |
| [15] | 李文斌, 曹生奎, 曹广超, 等, 2024. 2000-2020年青海湖流域植被净初级生产力时空格局及驱动分析[J]. 水土保持研究, 31(5): 327-336, 343. |
| LI W B, CAO S K, CAO G C, et al., 2024. Spatiotemporal patterns of vegetation net primary productivity and their drivers in Qinghai Lake Basin from 2000 to 2020[J]. Research of Soil and Water Conservation, 31(5): 327-336, 343. | |
| [16] | 刘亮, 关靖云, 穆晨, 等, 2022. 2008-2018年伊犁河流域植被净初级生产力时空分异特征研究[J]. 生态学报, 42(12): 4861-4871. |
| LIU L, GUAN J Y, MU C, et al., 2022. Spatio-temporal characteristics of vegetation net primary productivity in the Ili River Basin from 2008 to 2018[J]. Acta Ecologica Sinica, 42(12): 4861-4871. | |
| [17] | 鲁韦坤, 李蒙, 程晋昕, 等, 2024. 基于BEPS模型的云南省碳源/汇时空特征及其适用性分析[J]. 生态学报, 44(4): 1441-1455. |
| LU W K, LI M, CHENG J X, et al., 2024. Spatio-temporal characteristics and applicability of carbon source/sink in Yunnan Province based on BEPS model[J]. Acta Ecologica Sinica, 44(4): 1441-1455. | |
| [18] | 罗旭, 2024. 秦岭地区生态环境质量时空变化及驱动力分析[J/OL]. 环境科学, 1-16 [2025-01-13]. https://doi.org/10.13227/j.hjkx.202404223. |
| LUO X, 2024. Spatio-temporal dynamic simulation analysis of ecological environment quality in Qinling Mountains[J/OL]. Environmental Science, 1-16 [2025-01-13]. https://doi.org/10.13227/j.hjkx.202404223. | |
| [19] |
马炳鑫, 靖娟利, 徐勇, 等, 2021. 2000-2019年滇黔桂岩溶区植被NPP时空变化及与气候变化的关系研究[J]. 生态环境学报, 30(12): 2285-2293.
DOI |
| MA B X, JING J L, XU Y, et al., 2021. Spatial-temporal changes of NPP and its relationship with climate change in karst areas of Yunnan, Guizhou and Guangxi from 2000 to 2019[J]. Ecology and Environmental Sciences, 30(12):2285-2293. | |
| [20] | 彭建兵, 申艳军, 金钊, 等, 2023. 秦岭生态地质环境系统研究关键思考[J]. 生态学报, 43(11): 4344-4358. |
| PENG J B, SHEN Y J, JIN Z, et al., 2023. Key thoughts on the study of eco-geological environment system in Qinling Mountains[J]. Acta Ecologica Sinica, 43(11): 4344-4358. | |
| [21] | 朴世龙, 方精云, 郭庆华, 2001. 利用CASA模型估算我国植被净第一性生产力[J]. 植物生态学报, 25(5): 603-608. |
| PIAO S L, FANG J Y, GUO Q H, 2001. Application of CASA model to the estimation of Chinese terrestrial net primary productivity[J]. Acta Phytoecologica Sinica, 25(5): 603-608. | |
| [22] |
石智宇, 王雅婷, 赵清, 等, 2022. 2001-2020 年中国植被净初级生产力时空变化及其驱动机制分析[J]. 生态环境学报, 31(11): 2111-2123.
DOI |
| SHI Z Y, WANG Y T, ZHAO Q, et al., 2022. The spatiotemporal changes of NPP and its driving mechanisms in China from 2001 to 2020[J]. Ecology and Environmental Sciences, 31(11): 2111-2123. | |
| [23] | 苏嘉亮, 晏晨然, 雷雨, 等, 2023. 陕西省生态环境质量长时序动态监测[J]. 生态学报, 43(2): 554-568. |
| SU J L, YAN C R, LEI Y, et al., 2023. Long time series dynamic monitoring of eco-environmental quality in Shaanxi Province[J]. Acta Ecologica Sinica, 43(2): 554-568. | |
| [24] |
王劲峰, 徐成东, 2017. 地理探测器: 原理与展望[J]. 地理学报, 72(1): 116-134.
DOI |
|
WANG J F, XU C D, 2017. Geodetector: Principle and prospective[J]. Acta Geographica Sinica, 72(1): 116-134.
DOI |
|
| [25] | 王靖钰, 李国栋, 任晓娟, 等, 2024. 南北过渡带常绿落叶阔叶混交林碳通量特征及其对环境因子的响应[J]. 生态学报, 44(14): 6243-6253. |
| WANG J Y, LI G D, REN X J, et al., 2024. Carbon flux characteristics and responses to environmental factors in the evergreen-deciduous broadleaf mixed forest of the north-south transitional zone[J]. Acta Ecologica Sinica, 44(14): 6243-6253. | |
| [26] | 王娟, 卓静, 何慧娟, 等, 2016. 2000-2013年秦岭林区植被净初级生产力时空分布特征及其驱动因素[J]. 西北林学院学报, 31(5): 238-245. |
| WANG J, ZHUO J, HE H J, et al., 2016. Changes of vegetation net primary productivity and its driving factors from 2000 to 2013 in Qinling Mountainous area[J]. Journal of Northwest Forestry University, 31(5): 238-245. | |
| [27] | 汪晓珍, 呼海涛, 吴建召, 等, 2024. 2000-2020年陕西省陆地生态系统NPP时空变化与潜力[J]. 水土保持学报, 38(3): 325-334. |
| WANG X Z, HU H T, WU J Z, et al., 2024. Spatial and temporal variation and potential of NPP in terrestrial ecosystems in Shaanxi province from 2000 to 2020[J]. Journal of Soil and Water Conservation, 38(3): 325-334. | |
| [28] | 肖晶, 饶良懿, 2024. 2001-2020年乌梁素海流域植被NPP时空变化及驱动因素分析[J]. 环境科学, 45(8): 4744-4755. |
| XIAO J, RAO L Y, 2024. Spatiotemporal variation characteristics and driving factors of vegetation NPP in the Ulansuhai Nur Basin from 2001 to 2020[J]. Environmental Science, 45(8): 4744-4755. | |
| [29] | 徐勇, 黄雯婷, 郭振东, 等, 2023. 2000-2020年我国西南地区植被NEP时空变化及其驱动因素的相对贡献[J]. 环境科学研究, 36(3): 557-570. |
| XU Y, HUANG W T, GUO Z D, et al., 2023. Spatio-temporal variation of vegetation net ecosystem productivity and relative contribution of driving forces in southwest China from 2000 to 2020[J]. Research of Environmental Sciences, 36(3): 557-570. | |
| [30] | 尹本酥, 李振发, 岳蓉, 等, 2024. 基于温度植被干旱指数的关中地区旱情监测[J]. 农业工程学报, 40(17): 111-119. |
| YIN B S, LI Z F, YUE R, et al, 2024. Monitoring drought in Guanzhong areas using temperature-vegetation drought index[J]. Transactions of the Chinese Society of Agricultural Engineering (Transactions of the CSAE), 40(17): 111-119. | |
| [31] |
袁博, 白红英, 章杰, 等, 2013. 秦岭山地植被净初级生产力及对气候变化的响应[J]. 植物研究, 33(2): 225-231.
DOI |
|
YUAN B, BAI H Y, ZHANG J, et al., 2013. Vegetation net primary productivity in Qinling Mountains and its response to climate change[J]. Bulletin of Botanical Research, 33(2): 225-231.
DOI |
|
| [32] | 张猛, 陈淑丹, 林辉, 等, 2023. 洞庭湖湿地净初级生产力估算研究[J]. 遥感学报, 27(6): 1454-1466. |
| ZHANG M, CHEN S D, LIN H, et al., 2023. Net primary productivity estimation of Dongting Lake wetland[J]. National Remote Sensing Bulletin, 27(6): 1454-1466. | |
| [33] |
朱文泉, 潘耀忠, 张锦水, 2007. 中国陆地植被净初级生产力遥感估算[J]. 植物生态学报, 31(3): 413-424.
DOI |
| ZHU W Q, PAN Y Z, ZHANG J S, 2007. Estimation of net primary productivity of Chinese terrestrial vegetation based on remote sensing[J]. Journal of Plant Ecology, 31(3): 413-424. |
| [1] | 李曼, 吴东丽, 何昊, 余慧婕, 赵琳, 刘聪, 胡正华, 李琪. 1990-2020年黄河流域碳储量时空演变及驱动因素研究[J]. 生态环境学报, 2025, 34(3): 333-344. |
| [2] | 张任菲, 肖萌, 刘志成. 京津冀地区景观破碎化的时空异质性及驱动因素研究[J]. 生态环境学报, 2025, 34(3): 461-473. |
| [3] | 赵乐鋆, 王诗瑶, 赵子渝, 洪星, 李夫星, 吴佳仪, 华婧妤. 2008-2022年华北平原七省市AOD时空变化特征及主要影响因素分析[J]. 生态环境学报, 2025, 34(2): 256-267. |
| [4] | 赵忠宝, 李婧, 刘小丹, 柏祥, 刘昊野, 徐晓娜, 耿世刚, 鲁少波. 河北省森林生态产品价值评估及其空间分布驱动因素研究[J]. 生态环境学报, 2025, 34(2): 321-332. |
| [5] | 汪洋, 李帆, 严笑, 梅言, 李培, 黄林, 赵俊杰. 山地高密度城市空间形态对冬季气溶胶格局的约束力探测——重庆中心城区案例研究[J]. 生态环境学报, 2025, 34(1): 56-66. |
| [6] | 侯金龙, 马志强, 杨澄, 葛双双, 何迪, 董璠. 京津冀地区植被碳源/汇的时空变化特征及影响因素分析[J]. 生态环境学报, 2024, 33(9): 1329-1338. |
| [7] | 张舒涵, 姜海玲, 于海淋, 冯馨慧. 沈阳现代化都市圈景观生态风险时空演变及驱动力分析[J]. 生态环境学报, 2024, 33(9): 1471-1481. |
| [8] | 戴晓爱, 马佳欣, 唐艺菱, 李为乐. 甘肃省植被时空动态变化及其归因分析[J]. 生态环境学报, 2024, 33(8): 1163-1173. |
| [9] | 徐佳乐, 杨兴川, 赵文吉, 杨志强, 钟一雪, 师乐颜, 马鹏飞. 气候变化背景下内蒙古中西部植被覆盖度演变特征研究[J]. 生态环境学报, 2024, 33(7): 1008-1018. |
| [10] | 王雪融, 龚建周, 俞方圆. 粤港澳大湾区4种生态系统调节服务的互馈关系及机制[J]. 生态环境学报, 2024, 33(7): 1130-1141. |
| [11] | 张维琛, 王惺琪, 王博杰. 塔布河流域生态系统服务时空格局及影响因素分析[J]. 生态环境学报, 2024, 33(7): 1142-1152. |
| [12] | 王捷纯, 邓玉娇, 朱怀卫, 孔蕴淇. 广东省不同生态系统植被NPP时空变化及对气候因子的响应[J]. 生态环境学报, 2024, 33(6): 831-840. |
| [13] | 廖洪圣, 卫伟, 石宇. 黄土丘陵区典型流域土壤侵蚀时空演变特征及其驱动机制:以祖厉河为例[J]. 生态环境学报, 2024, 33(6): 908-918. |
| [14] | 王美娜, 范顺祥, 舒翰俊, 张建杰, 褚力其, 法玉琦. 河南省土壤侵蚀时空分异特征及土壤保持经济价值[J]. 生态环境学报, 2024, 33(5): 730-744. |
| [15] | 程鹏, 孙明东, 宋晓伟. 中国灰水足迹时空动态演进及驱动因素研究[J]. 生态环境学报, 2024, 33(5): 745-756. |
| 阅读次数 | ||||||
|
全文 |
|
|||||
|
摘要 |
|
|||||