生态环境学报 ›› 2024, Vol. 33 ›› Issue (7): 1008-1018.DOI: 10.16258/j.cnki.1674-5906.2024.07.002
徐佳乐1( ), 杨兴川1,*(), 赵文吉1, 杨志强1, 钟一雪1, 师乐颜1, 马鹏飞2
收稿日期:2024-04-22
出版日期:2024-07-18
发布日期:2024-09-04
通讯作者:
*杨兴川。E-mail: mxoyxc@163.com作者简介:徐佳乐(2002年生),男,硕士研究生,主要从事生态遥感与地学应用研究。E-mail: 2230902132@cnu.edu.cn
基金资助:
XU Jiale1(), YANG Xingchuan1,*(), ZHAO Wenji1, YANG Zhiqiang1, ZHONG Yixue1, SHI Leyan1, MA Pengfei2
Received:2024-04-22
Online:2024-07-18
Published:2024-09-04
摘要:
植被覆盖的动态演变能够有效地反映区域生态环境变化。为探究内蒙古中西部5个盟市植被覆盖度时空演变特征及对气候变化的响应,基于MODIS NDVI数据和同期气候因子(平均气温、累计降水、平均日照时数、平均相对湿度)数据,利用Theil-Sen Median趋势分析、MK检验、Hurst指数、偏相关分析等方法分析了内蒙古中西部5个盟市2000-2021年植被覆盖度和气候因子的时空变化特征及植被覆盖度对气候因子的响应。结果表明:2000-2021年,内蒙古中西部5个盟市的平均植被覆盖度为0.321,处于较低水平;22年间,植被覆盖度呈波动上升趋势,增长速度为0.4%。研究区植被覆盖度呈现东高西低的分布格局,低覆盖度面积为53.2%,中高覆盖度和高覆盖度约占总面积的10%。研究区植被覆盖度的平均Sen斜率为0.004,表明植被覆盖整体呈上升趋势;植被改善区域面积达89.1%,植被退化部分占比为10.6%。Hurst指数均值为0.423。结合Sen趋势,预测出未来覆盖度以稳步增长为主,其中48.4%的区域不会发生显著的植被改善或退化现象,30.6%的区域未来以植被改善为主。研究区平均气温、累计降水量呈上升趋势,而平均日照时数和平均相对湿度呈下降趋势。植被覆盖度与平均气温的关系以不显著相关为主,其中通过显著性检验(p<0.05)的正相关面积为14.7%;植被覆盖度与累计降水量的关系以正相关为主,正相关面积占比为98.1%;与平均日照时数和平均相对湿度的关系均以不显著相关为主。
中图分类号:
徐佳乐, 杨兴川, 赵文吉, 杨志强, 钟一雪, 师乐颜, 马鹏飞. 气候变化背景下内蒙古中西部植被覆盖度演变特征研究[J]. 生态环境学报, 2024, 33(7): 1008-1018.
XU Jiale, YANG Xingchuan, ZHAO Wenji, YANG Zhiqiang, ZHONG Yixue, SHI Leyan, MA Pengfei. Evolution Characteristics of Vegetation Coverage in Central and Western Inner Mongolia under the Background of Climate Change[J]. Ecology and Environment, 2024, 33(7): 1008-1018.
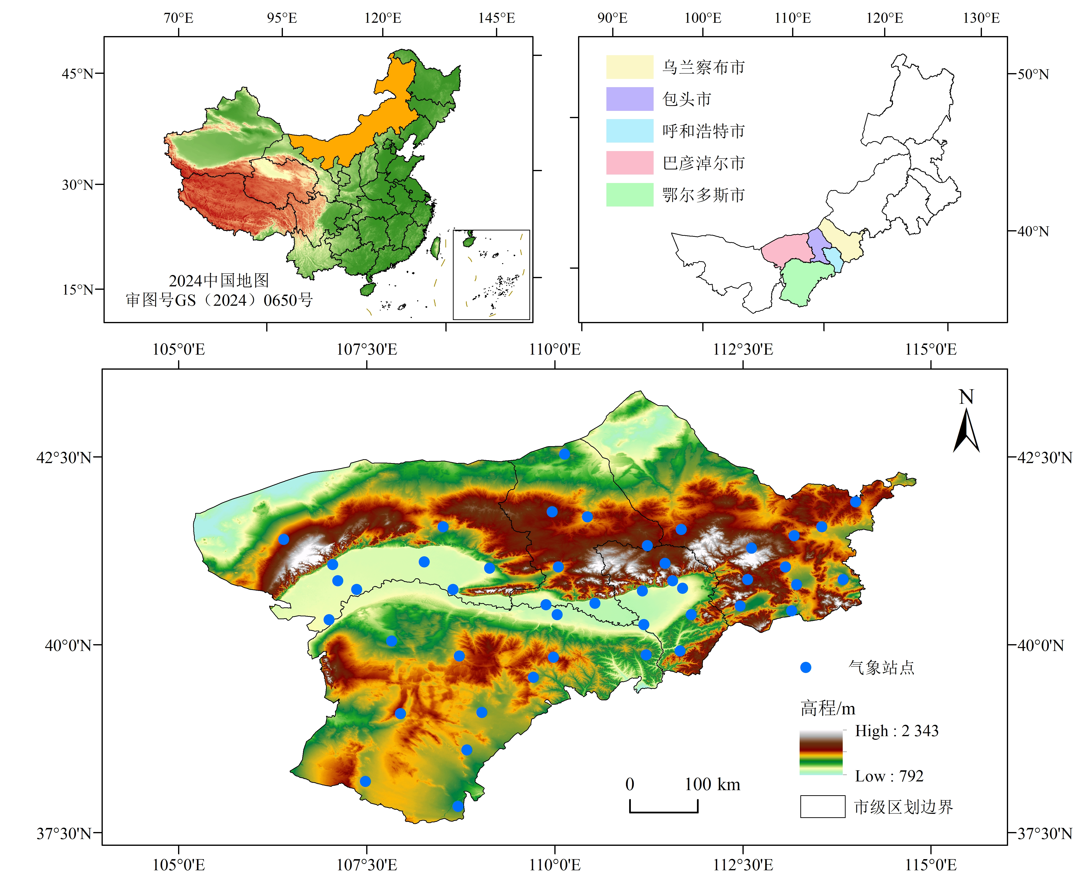
图1 研究区域高程及气象站点分布 基于国家地理信息公共服务平台下载的审图号为GS(2024)0650号的标准地图制作,底图边界无修改
Figure 1 Distribution of elevation and meteorological stations in the studied area
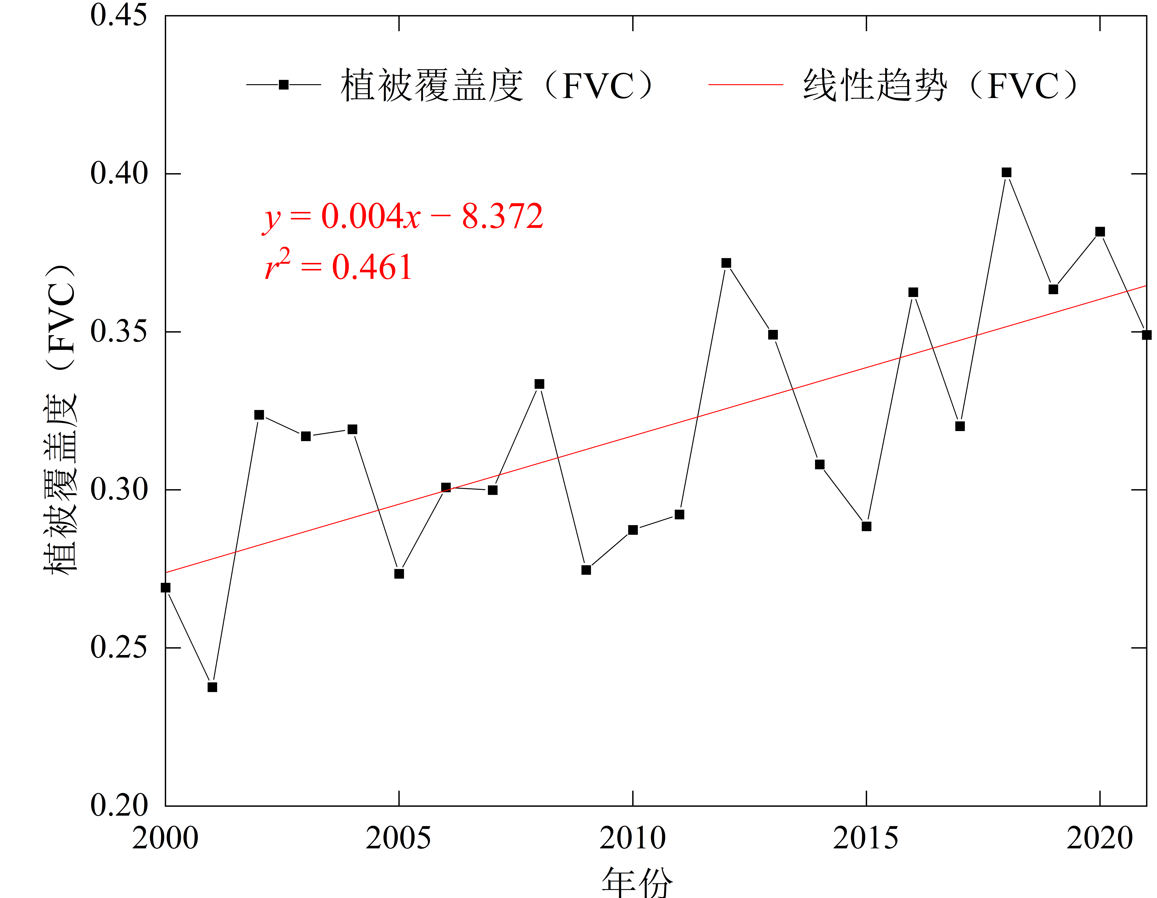
图2 2000-2021年平均植被覆盖度年际变化
Figure 2 Interannual variation of average FVC from 2000 to 2021
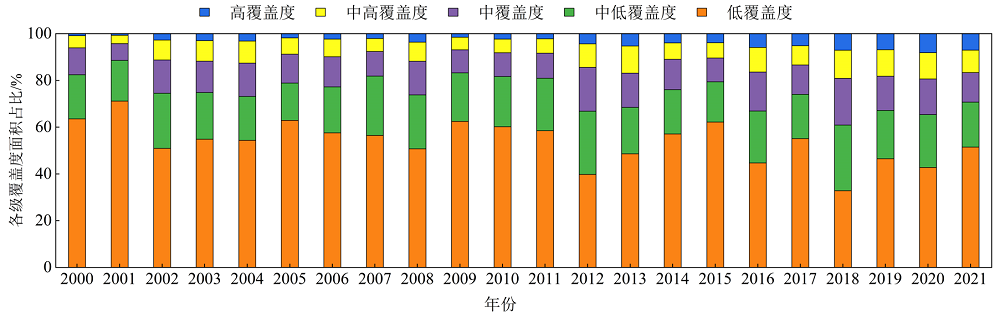
图3 2000-2021年不同等级植被覆盖度占比变化
Figure 3 Changes in percentage of FVC at different levels from 2000 to 2021

图4 2000-2021年植被覆盖度空间分布
Figure 4 Spatial distribution of annual FVC from 2000 to 2021
| 类别 | 面积/(104 km2) | 占比/% |
|---|---|---|
| 低覆盖度 | 17.239 | 53.2 |
| 中低覆盖度 | 7.237 | 22.3 |
| 中覆盖度 | 4.685 | 14.4 |
| 中高覆盖度 | 2.526 | 7.8 |
| 高覆盖度 | 0.749 | 2.3 |
表1 各级植被覆盖度面积及占比
Table 1 Area and proportion of FVC at five levels
| 类别 | 面积/(104 km2) | 占比/% |
|---|---|---|
| 低覆盖度 | 17.239 | 53.2 |
| 中低覆盖度 | 7.237 | 22.3 |
| 中覆盖度 | 4.685 | 14.4 |
| 中高覆盖度 | 2.526 | 7.8 |
| 高覆盖度 | 0.749 | 2.3 |
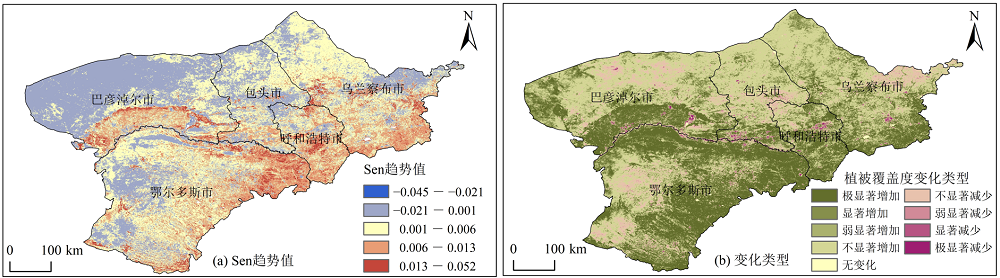
图5 2000-2021年植被覆盖度Sen趋势及变化类型
Figure 5 The Sen trend and change types of FVC from 2000 to 2021
| Sen趋势 (β) | 显著水平 (Z) | 变化类型 | 面积占比/% |
|---|---|---|---|
| β>0 | 2.58<Z | 极显著增加 | 30.6 |
| 1.96<Z≤2.58 | 显著增加 | 12.4 | |
| 1.65<Z≤1.96 | 弱显著增加 | 7.2 | |
| Z≤1.65 | 不显著增加 | 38.7 | |
| β=0 | 无变化 | 0.4 | |
| β<0 | Z≤1.65 | 不显著减少 | 9.5 |
| 1.65<Z≤1.96 | 弱显著减少 | 0.3 | |
| 1.96<Z≤2.58 | 显著减少 | 0.4 | |
| 2.58<Z | 极显著减少 | 0.4 |
表2 植被演变类型分类标准及各类面积占比
Table 2 Classification standards of vegetation evolution types and proportions of various areas
| Sen趋势 (β) | 显著水平 (Z) | 变化类型 | 面积占比/% |
|---|---|---|---|
| β>0 | 2.58<Z | 极显著增加 | 30.6 |
| 1.96<Z≤2.58 | 显著增加 | 12.4 | |
| 1.65<Z≤1.96 | 弱显著增加 | 7.2 | |
| Z≤1.65 | 不显著增加 | 38.7 | |
| β=0 | 无变化 | 0.4 | |
| β<0 | Z≤1.65 | 不显著减少 | 9.5 |
| 1.65<Z≤1.96 | 弱显著减少 | 0.3 | |
| 1.96<Z≤2.58 | 显著减少 | 0.4 | |
| 2.58<Z | 极显著减少 | 0.4 |

图6 内蒙古中西部5市Hurst指数分级及植被未来趋势预测
Figure 6 Hurst index classification and vegetation future trend prediction in 5 cities in central and western Inner Mongolia
| 变化趋势 | 趋势类型 | 面积占比/% |
|---|---|---|
| 改善 | 强反持续退化 | 0.1 |
| 弱反持续退化 | 0.4 | |
| 弱持续改善 | 10.9 | |
| 强持续改善 | 19.2 | |
| 无显著变化 | 无显著变化 | 48.4 |
| 退化 | 强反持续改善 | 8 |
| 弱反持续改善 | 12.4 | |
| 弱持续退化 | 0.4 | |
| 强持续退化 | 0.3 |
表3 植被覆盖度未来变化趋势类型面积占比
Table 3 Proportion of area in FVC trend types in the future
| 变化趋势 | 趋势类型 | 面积占比/% |
|---|---|---|
| 改善 | 强反持续退化 | 0.1 |
| 弱反持续退化 | 0.4 | |
| 弱持续改善 | 10.9 | |
| 强持续改善 | 19.2 | |
| 无显著变化 | 无显著变化 | 48.4 |
| 退化 | 强反持续改善 | 8 |
| 弱反持续改善 | 12.4 | |
| 弱持续退化 | 0.4 | |
| 强持续退化 | 0.3 |
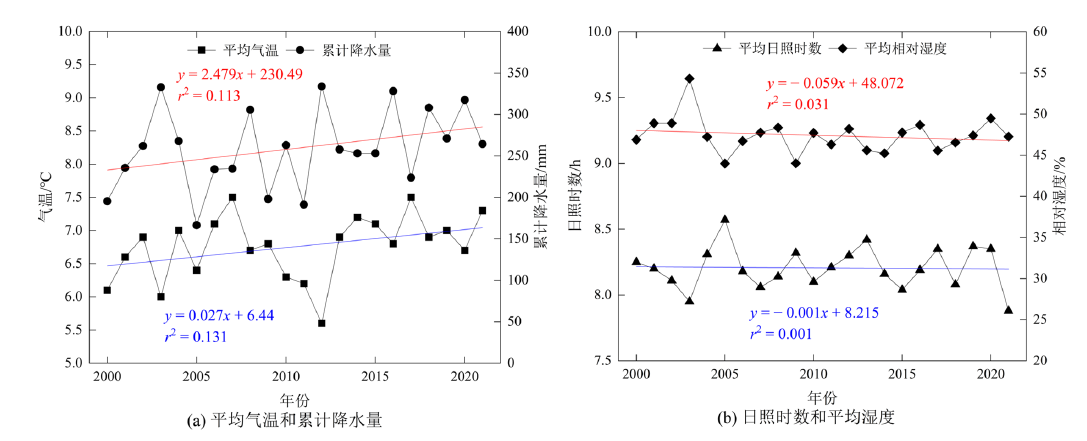
图7 2000-2021年4个主要气候因子年际变化
Figure 7 Interannual variation of four main climate factors from 2000 to 2021

图8 2000-2021年气候因子多年平均空间分布
Figure 8 Annual mean spatial distribution of climate factors from 2000 to 2021
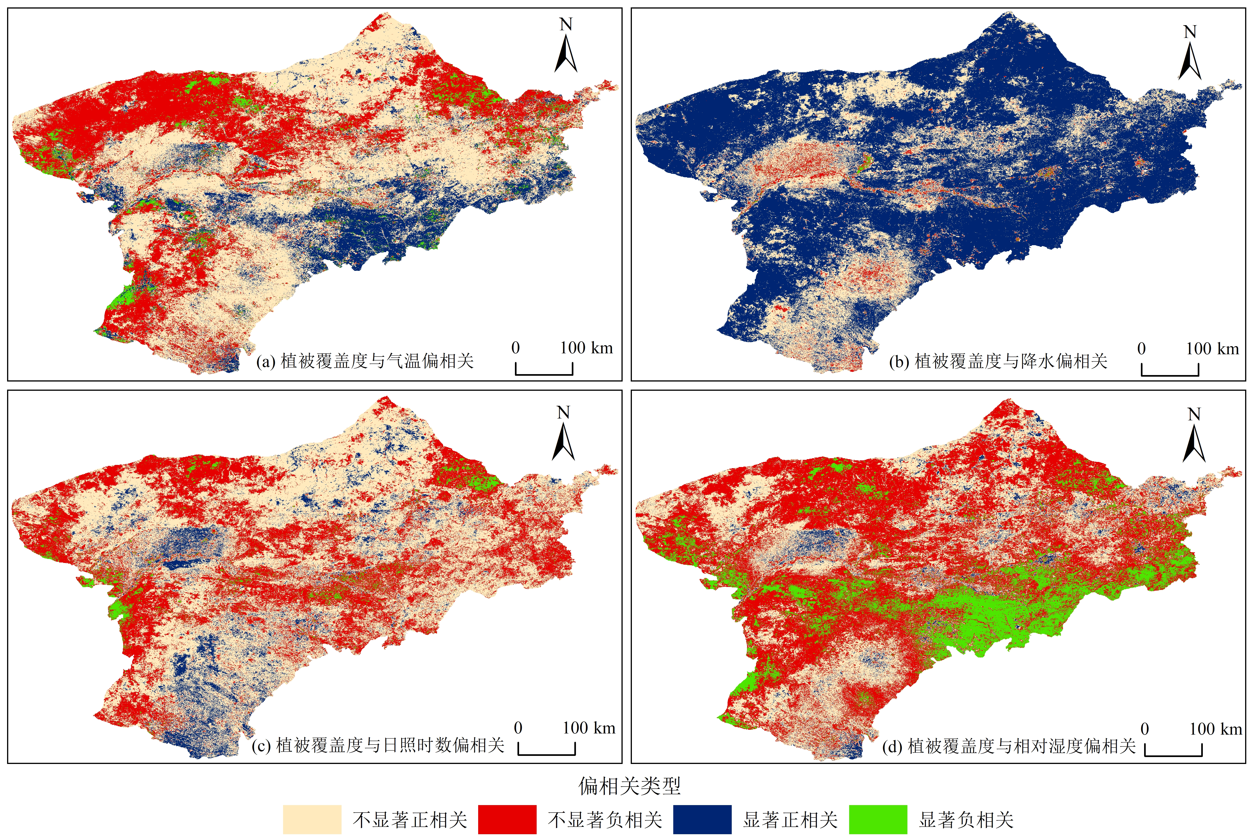
图9 植被覆盖度与各气候因子相关类型空间分布
Figure 9 Spatial distribution of correlation types between FVC and the four climate factors
| 相关系数 (r) | 显著水平 (p) | 相关类型 | 面积占比/% | |||
|---|---|---|---|---|---|---|
| 平均 气温 | 累计降水量 | 平均日照时数 | 平均相对湿度 | |||
| >0 | <0.05 | 显著正相关 | 14.7 | 68.8 | 8.6 | 3.6 |
| >0 | >0.05 | 不显著正相关 | 50.4 | 27.9 | 56.2 | 32.2 |
| <0 | <0.05 | 显著负相关 | 4.4 | 0.2 | 2.4 | 15.5 |
| <0 | >0.05 | 不显著负相关 | 30.5 | 3.1 | 32.8 | 48.7 |
表4 各气候因子不同相关类型面积占比统计
Table 4 Statistics of area proportion in different correlation types for the four climate factors
| 相关系数 (r) | 显著水平 (p) | 相关类型 | 面积占比/% | |||
|---|---|---|---|---|---|---|
| 平均 气温 | 累计降水量 | 平均日照时数 | 平均相对湿度 | |||
| >0 | <0.05 | 显著正相关 | 14.7 | 68.8 | 8.6 | 3.6 |
| >0 | >0.05 | 不显著正相关 | 50.4 | 27.9 | 56.2 | 32.2 |
| <0 | <0.05 | 显著负相关 | 4.4 | 0.2 | 2.4 | 15.5 |
| <0 | >0.05 | 不显著负相关 | 30.5 | 3.1 | 32.8 | 48.7 |
| [1] | GHANGHERMEH A, ROSHAN G, ASADI K, et al., 2024. Spatiotemporal analysis of urban heat islands and vegetation cover using emerging hotspot analysis in a humid subtropical climate[J]. Atmosphere, 15(2): 161. |
| [2] | MANN H B, 1945. Nonparametric tests against trend[J]. Econometrica, 13(3): 245-259. |
| [3] | OLIVIER T B G, ANGORA A, YVES K, et al., 2024. Recent vegetation cover dynamics and climatic parameters evolution study in the great green wall of Senegal[J]. Journal of Environmental Protection, 14(4): 254-284. |
| [4] | PENG S Z, DING Y X, LIU W Z, et al., 2019. 1 km monthly temperature and precipitation dataset for China from 1901 to 2017[J]. Earth System Science Data, 11(4): 1931-1946. |
| [5] | SEN K P, 1968. Estimates of the regression coefficient based on Kendall's tau[J]. Journal of the American Statistical Association, 63(324): 1379-1389. |
| [6] | SUN W Y, MU X M, SONG X Y, et al., 2016. Changes in extreme temperature and precipitation events in the Loess Plateau (China) during 1960-2013 under global warming[J]. Atmospheric Research, 168: 33-48. |
| [7] | TINGNEYUC S, KUMAR S J, INDRAJIT P, 2024. Spatio-temporal vegetation cover analysis to determine climate change in Papua New Guinea[J]. International Journal of Disaster Resilience in the Built Environment, 15(1): 116-140. |
| [8] | 阿多, 赵文吉, 宫兆宁, 等, 2017. 1981-2013华北平原气候时空变化及其对植被覆盖度的影响[J]. 生态学报, 37(2): 576-592. |
| A D, ZHAO W J, GONG Z N, et al., 2017. Temporal and spatial changes of climate and its impact on vegetation coverage in the north China plain during 1981-2013[J]. Acta Ecologica Sinica, 37(2): 576-592. | |
| [9] | 毕馨予, 刘晓静, 马东来, 等, 2021. 辽宁省植被NDVI对气候因子的滞后响应研究[J]. 中国农业资源与区划, 42(10): 233-244. |
| BI X Y, LIU X J, MA D L, et al., 2021. Study on the lag response of vegetation NDVI to climate factors in Liaoning province[J]. China Agricultural Resources and Regionalization, 42(10): 233-244. | |
| [10] | 陈淑君, 许国昌, 吕志平, 等, 2023. 中国植被覆盖度时空演变及其对气候变化和城市化的响应[J]. 干旱区地理, 46(5): 742-752. |
| CHEN S J, XU G C, LÜ Z P, et al., 2023. Spatio-temporal evolution of vegetation coverage in China and its response to climate change and urbanization[J]. Arid Region Geography, 46(5): 742-752. | |
| [11] | 陈子旋, 刘兰君, 代汉青, 等, 2023. 草原地区生态安全格局评价及生态价值挖掘实践路径探究——以内蒙古和林格尔县为例[J]. 湖北农业科学, 62(S1): 56-63, 69. |
| CHEN Z X, LIU L J, DAI H Q, et al., 2023. Evaluation of ecological security pattern and practice path of ecological value mining in grassland area: A case study of Helinger county, Inner Mongolia[J]. Hubei Agricultural Sciences, 62(S1): 56-63, 69. | |
| [12] | 崔利芳, 许馨, 牛自耕, 等, 2023. 武汉都市圈植被NDVI变化特征及其对气候变化的响应[J]. 黄冈师范学院学报, 43(3): 43-48. |
| CUI L F, XU X, NIU Z G, et al., 2023. NDVI variation characteristics of vegetation in Wuhan metropolitan area and its response to climate change[J]. Journal of Huanggang Normal University, 43(3): 43-48. | |
| [13] | 高海燕, 王鑫, 杨振奇, 等, 2024. 黄河中游窟野河流域土壤侵蚀与生态修复研究进展[J]. 内蒙古大学学报(自然科学版), 55(3): 329-336. |
| GAO H Y, WANG X, YANG Z Q, et al., 2024. Research progress on soil erosion and ecological restoration in Groye River basin, middle Yellow River[J]. Journal of Inner Mongolia University (Natural Science Edition), 55(3): 329-336. | |
| [14] | 郭荣朋, 丘伟国, 贾丁一, 等, 2024. 2000-2020年福建省植被恢复对气候变化的响应[J]. 森林与环境学报, 44(1): 1-12. |
| GUO R P, QIU W G, JIA D Y, et al., 2024. Response of vegetation restoration to climate change in Fujian province from 2000 to 2020[J]. Journal of Forest and Environment, 44(1): 1-12. | |
| [15] | 韩雪娇, 图雅, 刘晓娟, 等, 2024. 气候因子对乌兰察布草原区不同植被类型群落特征的年际影响[J]. 生态与农村环境学报, 40(3): 363-373. |
| HAN X J, TU Y, LIU X J, et al., 2024. Interannual effects of climate factors on community characteristics of different vegetation types in Ulanqab grassland[J]. Journal of Ecology and Rural Environment, 40(3): 363-373. | |
| [16] | 韩云环, 马柱国, 李明星, 等, 2023. 中国不同干湿区植被变化及其与气候因子的关系[J]. 大气科学, 47(6): 1680-1692. |
| HAN Y H, MA Z G, LI M X, et al., 2023. Vegetation change and its relationship with climate factors in different wet and dry regions of China[J]. Atmospheric Sciences, 47(6): 1680-1692. | |
| [17] | 郝鑫怡, 张喆, 郑浩, 等, 2024. 天山北坡经济带植被覆盖度动态变化研究[J]. 中国环境科学, 44(2): 1020-1031. |
| HAO X Y, ZHANG Z, ZHENG H, et al., 2024. Study on dynamic changes of vegetation coverage in the economic belt on the northern slope of Tianshan mountains[J]. China Environmental Science, 44(2): 1020-1031. | |
| [18] | 胡屾, 胡娟娟, 郑晔施, 等, 2023. 内蒙古生态屏障区植被覆盖变化及降水、气温对其的影响[J]. 东北林业大学学报, 51(12): 44-50, 80. |
| HU S, HU J J, ZHENG Y S, et al., 2023. Vegetation cover change and the impact of precipitation and temperature on it in the ecological barrier area of Inner Mongolia[J]. Journal of Northeast Forestry University, 51(12): 44-50, 80. | |
| [19] | 李攀, 胡德勇, 赵文吉, 2010. 北方农牧交错带植被覆盖变化遥感监测研究——以河北省沽源县为例[J]. 国土资源遥感, 22(2): 113-117. |
| LI P, HU D Y, ZHAO W J, 2010. Remote sensing monitoring of vegetation cover change in northern agro-pastoral ecotone: A case study of Guyuan county, Hebei province[J]. Remote Sensing of Land and Resources, 22(2): 113-117. | |
| [20] | 林龙圳, 陈远书, 马玮哲, 等, 2021. 库布齐沙漠地区生态系统格局演变及其驱动力分析[J]. 北京林业大学学报, 43(4): 108-123. |
| LIN L Z, CHEN Y S, MA W Z, et al., 2021. Evolution of ecosystem pattern and its driving forces in Kubuqi desert[J]. Journal of Beijing Forestry University, 43(4): 108-123. | |
| [21] | 裴宏泽, 赵亚超, 张廷龙, 2023. 2000-2020年黄土高原NEP时空格局与驱动力[J]. 干旱区研究, 40(11): 1833-1844. |
| PEI H Z, ZHAO Y C, ZHANG T L, 2023. Spatial and temporal patterns and driving forces of NEP in the Loess Plateau from 2000 to 2020[J]. Research on Arid Regions, 40(11): 1833-1844. | |
| [22] | 邱嘉琦, 于德永, 2023. 中国北方农牧交错带生态系统服务空间格局及影响因子——以内蒙古中西部地区为例[J]. 生态学报, 43(18): 7598-7609. |
| QIU J Q, YU D Y, 2023. Spatial pattern and impact factors of ecosystem services in the farming pastoral ecotone of northern China, a case study of the central and western regions of Inner Mongolia[J]. Acta Ecologica Sinica, 43(18): 7598-7609. | |
| [23] | 塞米热·吾斯曼, 杨涵, 钟瑞森, 等, 2024. 伊犁河三角洲植被覆盖度时空变化特征及影响因素[J/OL]. 水生态学杂志, [2024-03-26]. https://link.cnki.net/urlid/42.1785.X.20240306.1435.001. |
| SAIMIRE W S M, YANG H, ZHONG R S, et al., 2024. Spatio-temporal variation characteristics and influencing factors of vegetation coverage in Yili river delta[J/OL]. Journal of Water Ecology, [2024-03-26]. https://link.cnki.net/urlid/42.1785.X.20240306.1435.001. | |
| [24] | 佘洁, 佘璐, 沈爱红, 等, 2024. 宁夏沿黄城市带植被覆盖度时空变化及驱动力分析[J/OL]. 环境科学, [2024-03-26]. https://link.cnki.net/urlid/11.1895.X.20240312.1415.021. |
| SHE J, SHE L, SHEN A H, et al., 2024. Spatio-temporal changes and driving forces of vegetation coverage in the urban belt along the Yellow River in Ningxia[J/OL]. Environmental Science, [2024-03-26]. https://link.cnki.net/urlid/11.1895.X.20240312.1415.021. | |
| [25] | 申丛林, 杨光, 韩雪莹, 等, 2022. 近20年内蒙古黄河流域植被覆盖时空变化[J]. 西部资源 (6): 174-179. |
| SHEN S L, YANG G, HAN X Y, et al., 2022. Spatio-temporal changes of vegetation cover in the Yellow River basin of Inner Mongolia in recent 20 years[J]. Western Resources (6): 174-179. | |
| [26] | 石淞, 李文, 丁一书, 等, 2023. 东北地区植被时空演变及影响因素分析[J]. 中国环境科学, 43(1): 276-289. |
| SHI S, LI W, DING Y S, et al., 2023. Analysis of spatio-temporal evolution and influencing factors of vegetation in northeast China[J]. China Environmental Science, 43(1): 276-289. | |
| [27] | 孙炼, 2023. 基于NDVI的四川省植被变化动态监测及驱动因素分析[J]. 西南农业学报, 36(5): 1082-1089. |
| SUN L, 2023. Dynamic monitoring and driving factors analysis of vegetation change in Sichuan province based on NDVI[J]. Journal of Southwest Agriculture, 36(5): 1082-1089. | |
| [28] |
王蕊, 拜得珍, 尹芳, 等, 2022. 湟水流域2000-2019年植被变化趋势特征和延续性分析[J]. 遥感技术与应用, 37(6): 1504-1512.
DOI |
| WANG R, BAI D Z, YIN F, et al., 2022. Trend characteristics and continuity analysis of vegetation change in Huangshui basin from 2000 to 2019[J]. Remote Sensing Technology and Applications, 37(6): 1504-1512. | |
| [29] | 文帆, 陈秋计, 黄兰, 等, 2023. 1986-2021年彬长矿区植被覆盖度时空变化及其影响因子[J]. 水土保持通报, 43(6): 304-310, 323. |
| WEN F, CHEN Q J, HUANG L, et al., 2023. Temporal and spatial variation of vegetation coverage and its influencing factors in Binchang mining area from 1986 to 2021[J]. Bulletin of Soil and Water Conservation, 43(6): 304-310, 323. | |
| [30] | 卫鸿飞, 张唯, 吉宸佳, 等, 2024. 基于GEE的阿拉善左旗植被时空变化特征及驱动因子分析[J]. 地理空间信息, 22(2): 55-60. |
| WEI H F, ZHANG W, JI C J, et al., 2024. Spatial and temporal characteristics and driving factors of vegetation change in Alxa left Banner based on GEE[J]. Geospatial Information, 22(2): 55-60. | |
| [31] | 闫志远, 张圣微, 王怡璇, 2023. 基于GEE的1982-2021年内蒙古地区植被覆盖度时空动态及气候响应特征[J]. 农业工程学报, 39(15): 94-102. |
| YAN Z Y, ZHANG S W, WANG Y X, 2023. Temporal and spatial dynamics and climate response characteristics of vegetation coverage in Inner Mongolia from 1982 to 2021 based on GEE[J]. Journal of Agricultural Engineering, 39(15): 94-102. | |
| [32] |
易小雅, 张德全, 刘勇, 等, 2024. 2000-2020年内蒙古杭锦旗植被变化特征及其对气候要素的响应[J]. 中国沙漠, 44(3): 51-62.
DOI |
| YI X Y, ZHANG D Q, LIU Y, et al., 2024. Characteristics of vegetation change and its response to climate factors in Hangjin banner, Inner Mongolia, 2000-2020 [J]. Deserts of China, 44(3): 51-62. | |
| [33] | 张保龙, 程文博, 赵宇新, 等, 2024. 植被NPP时空变化及其对气候变化的响应——以黄河内蒙古段为例[J]. 内蒙古气象 (1): 9-16. |
| ZHANG B L, CHENG W B, ZHAO Y X, et al., 2024. Temporal and spatial variation of NPP in vegetation and its response to climate change: A case study of the Inner Mongolia section of the Yellow River[J]. Meteorology of Inner Mongolia (1): 9-16. | |
| [34] | 张丽, 刘佳雨, 2023. 近30年东北沙地生态系统服务动态[J]. 中国水土保持科学(中英文), 21(1): 139-148. |
| ZHANG L, LIU J Y, 2023. Ecosystem service dynamics of sandy land in northeast China in recent 30 years[J]. Science of Soil and Water Conservation in China, 21(1): 139-148. | |
| [35] |
张鐥文, 杨冉, 侯文星, 等, 2023. 生态补水前后永定河两岸植被覆盖度变化及驱动力分析[J]. 生态环境学报, 32(2): 264-273.
DOI |
| ZHANG S W, YANG R, HOU W X, et al., 2023. Vegetation coverage change and driving force analysis on both sides of Yongding river before and after ecological water replenishment[J]. Journal of Ecology and Environment, 32(2): 264-273. | |
| [36] | 赵恒谦, 刘轩绮, 刘哿, 等, 2024. 京津风沙源区NPP时空变化及其对治理工程实施的响应[J]. 生态学报, 44(6): 2406-2419. |
| ZHAO H Q, LIU X Q, LIU G, et al., 2024. Temporal and spatial changes of NPP in the Beijing-Tianjin aeolian sand source area and its response to the implementation of the control project[J]. Acta Ecologica Sinica, 44(6): 2406-2419. | |
| [37] | 赵倩倩, 李建华, 张桂琴, 等, 2022. 气候变化背景下黄河流域植被变化及其成因[J]. 气候与环境研究, 27(1): 157-169. |
| ZHAO Q Q, LI J H, ZHANG G Q, et al., 2022. Vegetation change and its causes in the Yellow River basin under the background of climate change[J]. Climatic and Environmental Research, 27(1): 157-169. | |
| [38] | 赵雨琪, 魏天兴, 2024. 1990-2020年黄土高原典型县域植被覆盖变化及影响因素[J]. 干旱区研究, 41(1): 147-156. |
| ZHAO Y Q, WEI T X, 2024. Vegetation cover changes and influencing factors in typical counties of the Loess Plateau from 1990 to 2020[J]. Arid Area Research, 41(1): 147-156. | |
| [39] | 甄慧, 汪洋, 夏婷婷, 等, 2023. 基于地理探测器的开都——孔雀河流域植被覆盖度时空变化及驱动力分析[J]. 草业科学, 40(5): 1140-1153. |
| ZHEN H, WANG Y, XIA T T, et al., 2023. Spatio-temporal variation and driving force analysis of vegetation coverage in Kaidu Kongque river basin based on geo detector[J]. Pratacultural Science, 40(5): 1140-1153. | |
| [40] | 周美林, 刘家宏, 刘希胜, 等, 2024. 青海湖流域植被动态变化驱动力及空间粒度效应[J]. 中国环境科学, 44(3): 1497-1506. |
| ZHOU M L, LIU J H, LIU X S, et al., 2024. Driving forces and spatial grain size effects of vegetation dynamic changes in Qinghai Lake basin[J]. China Environmental Science, 44(3): 1497-1506. |
| [1] | 汪东川, 李亭蓉, 王康健, 孙苗苗, 俞长锦, 杨菲, 杨琳, 张万恒, 刘云绮, 曾孔鹏. 金沙江观音岩库区植被覆盖度时空差异影响机制分析[J]. 生态环境学报, 2024, 33(7): 997-1007. |
| [2] | 张维琛, 王惺琪, 王博杰. 塔布河流域生态系统服务时空格局及影响因素分析[J]. 生态环境学报, 2024, 33(7): 1142-1152. |
| [3] | 宋小龙, 马明德, 王鹏, 李陇堂, 米文宝, 宋永永. 2000—2022年宁夏不同地理分区生长季植被覆盖度时空非平稳性特征[J]. 生态环境学报, 2024, 33(6): 853-868. |
| [4] | 李慧, 邓佳伟, 李亚鑫, 母滢琦. 秦岭北麓典型流域径流对气候和土地利用变化的响应——以灞河流域为例[J]. 生态环境学报, 2024, 33(5): 802-811. |
| [5] | 田叙辰, 魏洪玲, 解胜男, 储启名, 杨婧, 张颖, 肖思秋, 唐中华, 刘英, 李德文. 基于MaxEnt模型的东北地区槭树潜在地理分布[J]. 生态环境学报, 2024, 33(4): 509-519. |
| [6] | 李霞, 陈永昊, 陈喆, 张国壮, 唐梦雅. 中国沿海地区植被NDVI时空变化及驱动力分析[J]. 生态环境学报, 2024, 33(2): 180-191. |
| [7] | 肖博, 王邵军, 解玲玲, 王郑钧, 郭志鹏, 张昆凤, 张路路, 樊宇翔, 郭晓飞, 罗双, 夏佳慧, 李瑞, 兰梦杰, 杨胜秋. 蚂蚁筑巢定居活动对热带森林土壤氮库及组分分配的影响[J]. 生态环境学报, 2023, 32(6): 1026-1036. |
| [8] | 陈俊芳, 吴宪, 刘啸林, 刘娟, 杨佳绒, 刘宇. 不同土壤水分下元素化学计量对微生物多样性的塑造特征[J]. 生态环境学报, 2023, 32(5): 898-909. |
| [9] | 巫晨煜, 许帆帆, 魏士博, 樊晶晶, 刘观鹏, 王坤. 渭河流域地表植被覆盖对气候变化的响应研究[J]. 生态环境学报, 2023, 32(5): 835-844. |
| [10] | 郝蕾, 翟涌光, 戚文超, 兰穹穹. 2001-2020年内蒙古植被碳源/碳汇时空动态及对气候因子的响应[J]. 生态环境学报, 2023, 32(5): 825-834. |
| [11] | 夏美君, 李健, 闫永蚕. 京津冀城市群生态福利绩效时空格局及演进特征[J]. 生态环境学报, 2023, 32(4): 814-824. |
| [12] | 李晖, 李必龙, 葛黎黎, 韩琛惠, 杨倩, 张岳军. 2000-2021年汾河流域植被时空演变特征及地形效应[J]. 生态环境学报, 2023, 32(3): 439-449. |
| [13] | 张鐥文, 杨冉, 侯文星, 王丽丽, 刘爽, 宋汉扬, 赵文吉, 李令军. 生态补水前后永定河两岸植被覆盖度变化及驱动力分析[J]. 生态环境学报, 2023, 32(2): 264-273. |
| [14] | 贾志峰, 刘鹏程, 刘宇, 吴博博, 陈丹姿, 张向飞. 气候变化和人类活动对松辽流域植被覆盖的影响[J]. 生态环境学报, 2023, 32(1): 1-10. |
| [15] | 邓天乐, 谢立勇, 张凤哲, 赵洪亮, 蒋语童. CO2浓度升高条件下稗草与水稻生长空间竞争关系研究[J]. 生态环境学报, 2022, 31(8): 1566-1572. |
| 阅读次数 | ||||||
|
全文 |
|
|||||
|
摘要 |
|
|||||