生态环境学报 ›› 2024, Vol. 33 ›› Issue (8): 1163-1173.DOI: 10.16258/j.cnki.1674-5906.2024.08.001
• 研究论文【生态学】 •
下一篇
戴晓爱1,2,3( ), 马佳欣2, 唐艺菱2, 李为乐1
收稿日期:2024-04-29
出版日期:2024-08-18
发布日期:2024-09-25
作者简介:戴晓爱(1979年生),女,教授,博士,主要从事生态环境监测与评价、生态系统服务等方面的教学和研究工作。E-mail: daixiaoa@cdut.edu.cn
基金资助:
DAI Xiaoai1,2,3(), MA Jiaxin2, TANG Yiling2, LI Weile1
Received:2024-04-29
Online:2024-08-18
Published:2024-09-25
摘要:
甘肃省作为中国西部生态安全屏障的重要组成部分,其植被覆盖变化直接关系中国西部的生态安全。采用2000-2020年植被覆盖度(FVC)数据,并从自然和人文影响方面选取16个影响因子,涵盖气候、地形地貌、土壤、人类活动,利用趋势分析法、地理探测器模型和偏最小二乘结构方程建模(PLS-SEM),从甘肃省不同干湿区、不同时间节点的角度探究其植被覆盖的变化特征及驱动力。结果表明,1)2000-2020年,甘肃省FVC整体持续改善,高植被覆盖度显著增加,其中陇东高原、陇中高原和疏勒河南部地区改善最为明显。2)不同干湿区的植被覆盖变化差异显著。干旱和半干旱区植被改善较慢,受降水量波动和土地利用方式影响大;而半湿润和湿润区植被改善明显,得益于良好的气候条件、生态工程的推动以及土壤有机碳含量的增加。3)降水和土地利用对FVC解释力最大,“退耕还林工程”对FVC的增加起到积极作用,但不合理的土地利用和城市化等也引起植被退化。随着时间推移,气候对FVC的影响一直在积极增加,不合理人类活动对FVC的负面影响相对稳定且较大,部分抵消了退耕还林的正面效果。此外,土壤有机碳含量对FVC的影响显著下降,且间接受到气候的正向影响。4)利用PLS-SEM模型,可有效分离自然与人为因素对植被覆盖的驱动作用,也可探究因素间的作用强度与途径。该研究增强了对区域植被动态变化规律的理解,也为生态恢复和环境管理提供了科学支持。
中图分类号:
戴晓爱, 马佳欣, 唐艺菱, 李为乐. 甘肃省植被时空动态变化及其归因分析[J]. 生态环境学报, 2024, 33(8): 1163-1173.
DAI Xiaoai, MA Jiaxin, TANG Yiling, LI Weile. Spatio-temporal Dynamics and Attribution Analysis of Vegetation in Gansu Province[J]. Ecology and Environment, 2024, 33(8): 1163-1173.

图1 研究区示意图
Figure 1 Schematic diagram of the studied area
| 数据 | 缩写 | 数据源 | 加工方法 | 时间 | 分辨率 |
|---|---|---|---|---|---|
| 降雨量 | Pre | 国家青藏高原科学数据中心 ( | 由逐月降水数据处理后得 | 2000‒2020 | 1 km |
| 平均气温 | Tem | 国家青藏高原科学数据中心 ( | 由逐月降水数据处理后得 | 2000‒2020 | 1 km |
| 空气湿度 | Hum | 中国地面气候资料日值数据集V3.0处理生成 | 将逐日csv文件展点后投影, 采用反距离权重法对其进行插值 | 2000‒2020 | |
| 太阳辐射 | SR | 中国区域地面气象要素驱动数据集 | 2000‒2020 | 0.1° | |
| 风速 | WS | 国家环境信息中心(NCEI) | 将逐日csv文件展点后投影, 采用反距离权重法对其进行插值 | 2000‒2020 | |
| CO2浓度 | CO2 | 中国二氧化碳排放数据1997‒2017 ( | 2000、2005、 2010、2015 | ||
| 中国城市温室气体工作组 (CCG) | 2020 | ||||
| 海拔 | Alt | 美国太空总署 (NASA) 和国防部国家测绘局 (NIMA) 联合测量 ( | 90 m | ||
| 坡度 | SLP | ArcGIS Pro 3.0中坡度工具提取 | |||
| 坡向 | ASP | ArcGIS Pro 3.0中坡向工具提取 | |||
| 土壤类型 | Soilt | 世界土壤数据库 ( | |||
| 土壤有机碳含量 | SC | https://data.isric.org | 250 m | ||
| 到最近路的距离 | DNR | ArcGIS Pro中使用邻近分析工具计算 | |||
| 人口密度 | Popd | LandScan全球人口数据 ( | 2000‒2020 | 1 km | |
| GDP | GDP | 《中国县域统计年鉴》 | 2000‒2020 | ||
| 土地利用 | LUCC | 中国区1990‒2020逐年30 m分辨率土地利用分类数据 ( | 2000‒2020 | 30 m | |
| 夜间灯光密度 | NL | 中国长时间序列夜间灯光数据集 (2000‒2020) [J/DB/OL] ( | 200‒2020 | 1 km | |
| FVC | FVC | 国家青藏高原科学数据中心( | 2000‒2020 | 250 m | |
| 逐年造林数据 | 2000‒2020年统计年鉴 | 2000‒2020 |
表1 数据来源
Table 1 Data sources
| 数据 | 缩写 | 数据源 | 加工方法 | 时间 | 分辨率 |
|---|---|---|---|---|---|
| 降雨量 | Pre | 国家青藏高原科学数据中心 ( | 由逐月降水数据处理后得 | 2000‒2020 | 1 km |
| 平均气温 | Tem | 国家青藏高原科学数据中心 ( | 由逐月降水数据处理后得 | 2000‒2020 | 1 km |
| 空气湿度 | Hum | 中国地面气候资料日值数据集V3.0处理生成 | 将逐日csv文件展点后投影, 采用反距离权重法对其进行插值 | 2000‒2020 | |
| 太阳辐射 | SR | 中国区域地面气象要素驱动数据集 | 2000‒2020 | 0.1° | |
| 风速 | WS | 国家环境信息中心(NCEI) | 将逐日csv文件展点后投影, 采用反距离权重法对其进行插值 | 2000‒2020 | |
| CO2浓度 | CO2 | 中国二氧化碳排放数据1997‒2017 ( | 2000、2005、 2010、2015 | ||
| 中国城市温室气体工作组 (CCG) | 2020 | ||||
| 海拔 | Alt | 美国太空总署 (NASA) 和国防部国家测绘局 (NIMA) 联合测量 ( | 90 m | ||
| 坡度 | SLP | ArcGIS Pro 3.0中坡度工具提取 | |||
| 坡向 | ASP | ArcGIS Pro 3.0中坡向工具提取 | |||
| 土壤类型 | Soilt | 世界土壤数据库 ( | |||
| 土壤有机碳含量 | SC | https://data.isric.org | 250 m | ||
| 到最近路的距离 | DNR | ArcGIS Pro中使用邻近分析工具计算 | |||
| 人口密度 | Popd | LandScan全球人口数据 ( | 2000‒2020 | 1 km | |
| GDP | GDP | 《中国县域统计年鉴》 | 2000‒2020 | ||
| 土地利用 | LUCC | 中国区1990‒2020逐年30 m分辨率土地利用分类数据 ( | 2000‒2020 | 30 m | |
| 夜间灯光密度 | NL | 中国长时间序列夜间灯光数据集 (2000‒2020) [J/DB/OL] ( | 200‒2020 | 1 km | |
| FVC | FVC | 国家青藏高原科学数据中心( | 2000‒2020 | 250 m | |
| 逐年造林数据 | 2000‒2020年统计年鉴 | 2000‒2020 |

图2 流程图
Figure 2 Flow chart
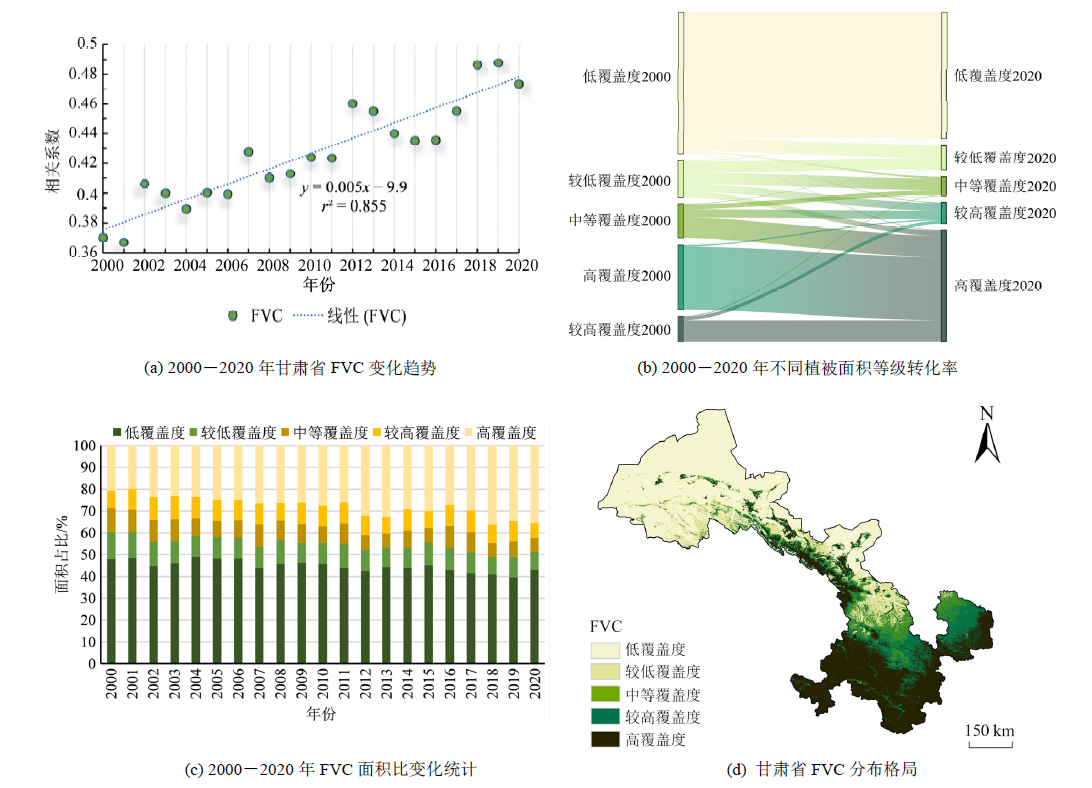
图3 甘肃省植被覆盖时空变化
Figure 3 Temporal and spatial variations of vegetation cover in Gansu Province

图4 甘肃省干旱、半干旱、半湿润、湿润区FVC年际变化、变化趋势及显著区
Figure 4 Interannual variation, variation trend and significant area of FVC in arid, semi-arid, sub-humid and humid regions of Gansu Province
| 趋势斜率 | 标准正态分布Z值 | FVC趋势变化 | 面积占比/% |
|---|---|---|---|
| ≥5×10⁻⁴ | ≥1.96 | 明显改善 | 61.31 |
| ≥5×10⁻⁴ | −1.96‒1.96 | 轻微改善 | 22.90 |
| 1×10⁻³ | −1.96‒1.96 | 稳定不变 | 10.78 |
| <−5×10⁻⁴ | −1.96‒1.96 | 轻微退化 | 4.24 |
| <−5×10⁻⁴ | <−19.96 | 严重退化 | 0.77 |
表2 甘肃省FVC不同变化趋势面积占比
Table 2 Area proportion of different FVC variation trends in Gansu Province
| 趋势斜率 | 标准正态分布Z值 | FVC趋势变化 | 面积占比/% |
|---|---|---|---|
| ≥5×10⁻⁴ | ≥1.96 | 明显改善 | 61.31 |
| ≥5×10⁻⁴ | −1.96‒1.96 | 轻微改善 | 22.90 |
| 1×10⁻³ | −1.96‒1.96 | 稳定不变 | 10.78 |
| <−5×10⁻⁴ | −1.96‒1.96 | 轻微退化 | 4.24 |
| <−5×10⁻⁴ | <−19.96 | 严重退化 | 0.77 |

图5 甘肃省植被覆盖变化地理探测器分析结果
Figure 5 Analysis results of geodetector for vegetation cover change in Gansu Province
| 干湿区 | 降水 | 气温 | 空气湿度 | 太阳辐射 | 风速 | CO2浓度 | 海拔 | 坡度 | 坡向 | 土壤类型 | 土壤有机碳含量 | 到最近道路距离 | 人口密度 | GDP | 土地利用 |
|---|---|---|---|---|---|---|---|---|---|---|---|---|---|---|---|
| 干旱区 | 0.452 | 0.151 | 0.300 | 0.133 | 0.007 | 0.124 | 0.235 | 0.091 | 0.027 | 0.467 | 0.284 | 0.230 | 0.082 | 0.247 | 0.777 |
| 半干旱区 | 0.866 | 0.251 | 0.849 | 0.476 | 0.639 | 0.372 | 0.091 | 0.102 | 0.015 | 0.500 | 0.546 | 0.313 | ‒ | 0.862 | 0.602 |
| 半湿润区 | 0.640 | 0.092 | 0.454 | 0.305 | 0.188 | 0.188 | 0.205 | 0.088 | 0.018 | 0.580 | 0.639 | ‒ | 0.002 | 0.105 | 0.277 |
| 湿润区 | 0.321 | ‒ | ‒ | ‒ | ‒ | ‒ | ‒ | ‒ | ‒ | ‒ | 0.302 | ‒ | ‒ | ‒ | 0.266 |
表3 甘肃省不同干湿区下驱动因子及其q值
Table 3 Driving factors and their q values in different wet and dry regions of Gansu Province
| 干湿区 | 降水 | 气温 | 空气湿度 | 太阳辐射 | 风速 | CO2浓度 | 海拔 | 坡度 | 坡向 | 土壤类型 | 土壤有机碳含量 | 到最近道路距离 | 人口密度 | GDP | 土地利用 |
|---|---|---|---|---|---|---|---|---|---|---|---|---|---|---|---|
| 干旱区 | 0.452 | 0.151 | 0.300 | 0.133 | 0.007 | 0.124 | 0.235 | 0.091 | 0.027 | 0.467 | 0.284 | 0.230 | 0.082 | 0.247 | 0.777 |
| 半干旱区 | 0.866 | 0.251 | 0.849 | 0.476 | 0.639 | 0.372 | 0.091 | 0.102 | 0.015 | 0.500 | 0.546 | 0.313 | ‒ | 0.862 | 0.602 |
| 半湿润区 | 0.640 | 0.092 | 0.454 | 0.305 | 0.188 | 0.188 | 0.205 | 0.088 | 0.018 | 0.580 | 0.639 | ‒ | 0.002 | 0.105 | 0.277 |
| 湿润区 | 0.321 | ‒ | ‒ | ‒ | ‒ | ‒ | ‒ | ‒ | ‒ | ‒ | 0.302 | ‒ | ‒ | ‒ | 0.266 |
| 指标 | 2000 | 2010 | 2020 |
|---|---|---|---|
| 有效样本数 | 32892 | 32873 | 32870 |
| SRMR | 0.069 | 0.075 | 0.053 |
| d_ULS | 0.169 | 0.203 | 0.101 |
| d_G | 0.217 | 0.210 | 0.188 |
表4 不同年份的PLS-SEM样本量及拟合结果
Table 4 Sample size and fitting results of PLE-SEM in different years
| 指标 | 2000 | 2010 | 2020 |
|---|---|---|---|
| 有效样本数 | 32892 | 32873 | 32870 |
| SRMR | 0.069 | 0.075 | 0.053 |
| d_ULS | 0.169 | 0.203 | 0.101 |
| d_G | 0.217 | 0.210 | 0.188 |

图6 2000、2010、2020年概念结构方程模型
Figure 6 Conceptual Structural equation models for 2000, 2010 and 2020
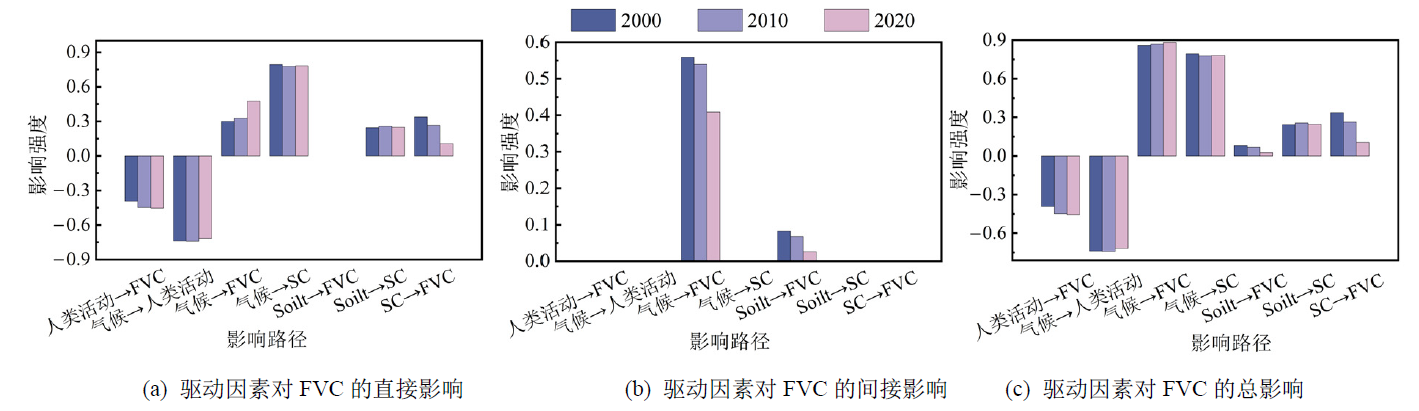
图7 不同潜在变量和可观测变量对每年FVC的直接影响、直接影响和总影响
Figure 7 Direct, direct, and total effects of different potential and observable variables on annual FVC

图8 2000-2020年甘肃省主要植被变化
Figure 8 Main vegetation changes in Gansu Province from 2000 to 2020
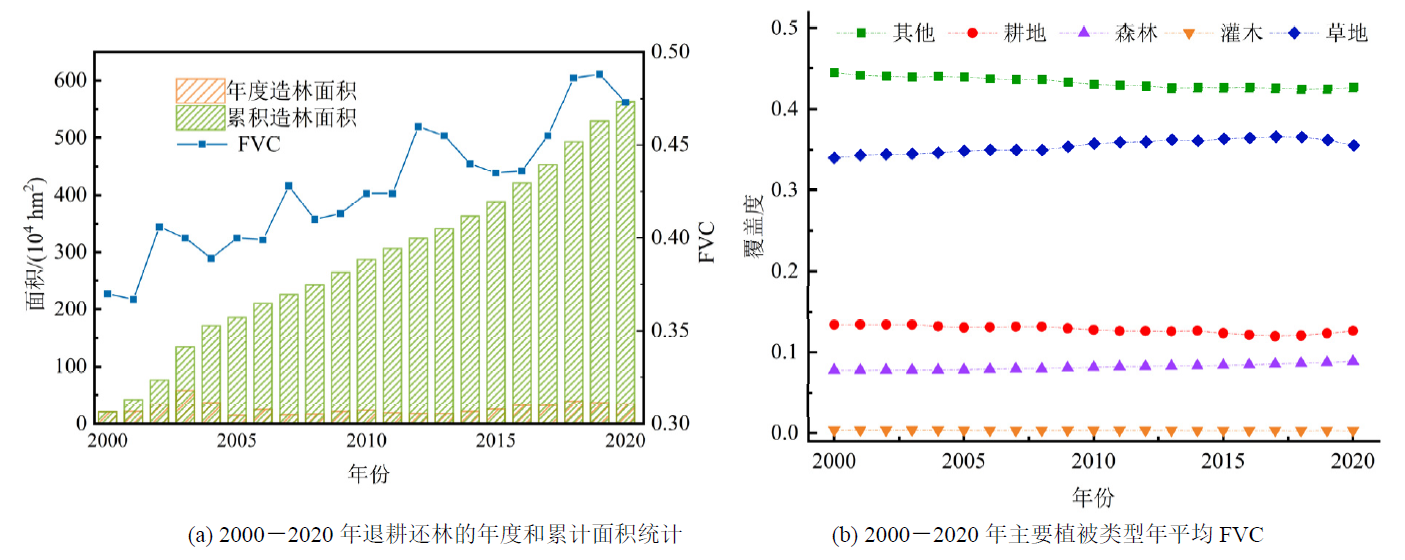
图9 2000-2020年甘肃省退耕还林及植被变化统计
Figure 9 Gansu province afforestation and vegetation change statistics, 2000-2020
| [1] | A D, ZHAO W J, QU X Y, et al., 2016. Spatio-temporal variation of vegetation coverage and its response to climate change in North China plain in the last 33 years[J]. International Journal of Applied Earth Observation and Geoinformation, 53: 103-117. |
| [2] | BRYAN B A, GAO L, YE Y Q, et al., 2018. China’s response to a national land-system sustainability emergency[J]. Nature, 559(7713): 193-204. |
| [3] | CAI Y F, ZHANG F, DUAN P, et al., 2022. Vegetation cover changes in China induced by ecological restoration-protection projects and land-use changes from 2000 to 2020[J]. CATENA, 217: 106530. |
| [4] | CHU D, 2020. Remote sensing of land use and land cover in mountain region: A comprehensive study at the central Tibetan Plateau[M]. Singapore: Springer Singapore: XVI, 227. |
| [5] |
CLELAND E E, COLLINS S L, DICKSON T L, et al., 2013. Sensitivity of grassland plant community composition to spatial vs. temporal variation in precipitation[J]. Ecology, 94(8): 1687-1696.
PMID |
| [6] | CUI F Q, WANG B J, ZHANG Q, et al., 2021. Climate change versus land-use change—What affects the ecosystem services more in the forest-steppe ecotone?[J]. Science of The Total Environment, 759: 143525. |
| [7] | FENG D R, FU M C, SUN Y Y, et al., 2021. How large-scale anthropogenic activities influence vegetation cover change in China? A review[J]. Forests, 12(3): 320. |
| [8] | GAO W D, ZHENG C, LIU X H, et al., 2022. NDVI-based vegetation dynamics and their responses to climate change and human activities from 1982 to 2020: A case study in the Mu Us Sandy Land, China[J]. Ecological Indicators, 137: 108745. |
| [9] | GOCIC M, TRAJKOVIC S, 2013. Analysis of changes in meteorological variables using Mann-Kendall and Sen’s slope estimator statistical tests in Serbia[J]. Global and Planetary Change, 100(1): 172-182. |
| [10] | GUO X Y, WANG T, LI Z B, et al., 2023. Using PLE-SEM to quantify the impacts of natural and human factors on vegetation change: A case study of the Jialing River Basin[J]. Sustainability, 15(17): 13089. |
| [11] | HUANG K, ZHANG Y J, ZHU J T, et al., 2016. The influences of climate change and human activities on vegetation dynamics in the Qinghai-Tibet Plateau[J]. Remote Sensing, 8(10): 876. |
| [12] | JIANG L L, GULI J, BAO A M, et al., 2017. Vegetation dynamics and responses to climate change and human activities in Central Asia[J]. Science of The Total Environment, 599-600: 967-980. |
| [13] | LI S K, LI X B, GONG J R, et al., 2022. Quantitative analysis of natural and anthropogenic factors influencing vegetation NDVI changes in temperate drylands from a spatial stratified heterogeneity perspective: A case study of Inner Mongolia grasslands, China[J]. Remote Sensing, 14(14): 3320. |
| [14] | LOWRY P B, GASKIN J, 2014. Partial least squares (PLS) structural equation modeling (SEM) for building and testing behavioral causal theory: When to choose it and how to use it[J]. IEEE Transactions on Professional Communication, 57(2): 123-146. |
| [15] | OKIN G S, MURRAY B, SCHLESINGER W H, 2001. Degradation of sandy arid shrubland environments: Observations, process modelling, and management implications[J]. Journal of Arid Environments, 47(2): 123-144. |
| [16] | PIAO S L, YIN G D, TAN J G, et al., 2015. Detection and attribution of vegetation greening trend in China over the last 30 years[J]. Global Change Biology, 21(4): 1601-1609. |
| [17] | QU S, WANG L C, LIN A W, et al., 2018. What drives the vegetation restoration in Yangtze River basin, China: Climate change or anthropogenic factors?[J]. Ecological Indicators, 90: 438-450. |
| [18] |
SHENGPEI D, BO Z, HAIJUN W J, et al., 2011. Vegetation cover change and the driving factors over northwest China[J]. Journal of Arid Land, 3(1): 25-33.
DOI |
| [19] | SUN B, LI Z Y, GAO W T, et al., 2019. Identification and assessment of the factors driving vegetation degradation/regeneration in drylands using synthetic high spatiotemporal remote sensing Data: A case study in Zhenglanqi, Inner Mongolia, China[J]. Ecological Indicators, 107: 105614. |
| [20] | VIOLLE C, CHOLER P, BORGY B, et al., 2015. Vegetation ecology meets ecosystem science: Permanent grasslands as a functional biogeography case study[J]. Science of The Total Environment, 534: 43-51. |
| [21] | YU S X, WANG L, ZHAO J S, et al., 2021. Using structural equation modelling to identify regional socio-economic driving forces of soil erosion: A case study of Jiangxi Province, southern China[J]. Journal of Environmental Management, 279: 111616. |
| [22] | ZHANG X F, LIAO C H, LI J, et al., 2013. Fractional vegetation cover estimation in arid and semi-arid environments using HJ-1 satellite hyperspectral data[J]. International Journal of Applied Earth Observation and Geoinformation, 21(1): 506-512. |
| [23] | ZHAO X H, ZHANG F M, LIU Q, et al., 2023. Climate change overshadows human activities in enhancing vegetation activity in Inner Mongolia[J]. Theoretical and Applied Climatology, 154(1-2): 245-259. |
| [24] | 丁海勇, 丁昕玮, 2020. 基于SPOT_NDVI的甘肃省植被覆盖变化及其与气候、地形因子的关系[J]. 长江流域资源与环境, 29(12): 2665-2678. |
| DING H Y, DING X W, 2020. Vegetation cover change and its relationship with climate and topographic factors in Gansu Province based on SPOT_NDVI[J]. Resources and Environment in the Yangtze River Basin, 29(12): 2665-2678. | |
| [25] |
何国兴, 柳小妮, 张德罡, 等, 2021. 甘肃省草地NPP时空变化及对气候因子的响应[J]. 草地学报, 29(4): 788-797.
DOI |
| HE G X, LIU X N, ZHANG D G, et al., 2021. Spatio-temporal variation of NPP and its response to climate factors in grassland, Gansu Province[J]. Acta Grassland Sinica, 29(4): 788-797. | |
| [26] | 胡春艳, 卫伟, 王晓峰, 等, 2016. 甘肃省植被覆盖变化及其对退耕还林工程的响应[J]. 生态与农村环境学报, 32(4): 588-594. |
| HU C Y, WEI W, WANG X F, et al., 2016. Change in vegetation cover as affected by Grain for Green Project in Gansu[J]. Journal of Ecology and Rural Environment, 32(4): 588-594. | |
| [27] | 靳峰, 戈文艳, 秦伟, 等, 2023. 甘肃省植被时空变化及其未来发展潜力[J]. 中国水土保持科学(中英文), 21(1): 110-118. |
| JIN F, GE W Y, QIN W, et al., 2023. Spatiotemporal variation of vegetation and its future development potential in Gansu province[J]. Science of Soil and Water Conservation in China, 21(1): 110-118. | |
| [28] | 李双双, 延军平, 万佳, 2012. 近10年陕甘宁黄土高原区植被覆盖时空变化特征[J]. 地理学报, 67(7): 960-970. |
|
LI S S, YAN J P, WAN J, 2012. The spatial-temporal changes of vegetation restoration on Loess Plateau in Shaanxi-Gansu-Ningxia region[J]. Acta Geographica Sinica, 67(7): 960-970.
DOI |
|
| [29] | 吕泳洁, 丁文广, 邓喆, 等, 2022. 基于地理探测器的甘肃省植被覆盖时空变化及驱动力分析[J]. 地球环境学报, 13(2): 185-195. |
| LÜ Y J, DING W G, DENG Z, et al., 2022. Spatiotemporal variation of vegetation cover and its driving forces in Gansu Province based on geodetector[J]. Journal of Earth Environment, 13(2): 185-195. | |
| [30] |
李帅呈, 龚健, 杨建新, 等, 2023. 兰西城市群土地利用/覆被变化模式特征——基于强度分析框架[J]. 资源科学, 45(3): 480-493.
DOI |
| LI S C GONG J, YANG J X, et al., 2023. Characteristics of LUCC patterns of the Lanzhou-Xining urban agglomeration: Based on an intensity analysis framework[J]. Resources Science, 45(3): 480-493. | |
| [31] | 彭鸿嘉, 傅伯杰, 陈利顶, 等, 2004. 甘肃民勤荒漠区植被演替特征及驱动力研究——以民勤为例[J]. 中国沙漠, 24(5): 628-633. |
| PENG H J, FU B J, CHEN L D, et al., 2004. Study on features of vegetation succession and its driving force in Gansu desert areas: A case study at Minqin County[J]. Journal of Desert Research, 24(5): 628-633. | |
| [32] | 申建秀, 王秀红, 刘羽, 等, 2012. 退耕还林前后甘肃正宁县生态系统服务价值的时空变化特征[J]. 水土保持研究, 19(4): 59-64. |
| SHEN J X, WANG X H, LIU Y, et al., 2012. Spatio-temporal changes of ecosystem service value in Zhengning County, Gansu Province before and after the 'Grain-for-Green' policy[J]. Soil and Water Conservation Research, 19(4): 59-64. | |
| [33] |
王劲峰, 徐成东, 2017. 地理探测器: 原理与展望[J]. 地理学报, 72(1): 116-134.
DOI |
| WANG J F, XU C D, 2017. Geodetectors. Geodetector: Principle and prospective[J]. Journal of Geography, 72(1): 116-134. |
| [1] | 高文明, 宋芊, 张皓翔, 王士如. 基于生态系统服务功能和保护动物栖息地适宜性评价的优先保护区选取——以三江源地区为例[J]. 生态环境学报, 2024, 33(8): 1318-1328. |
| [2] | 王雪融, 龚建周, 俞方圆. 粤港澳大湾区4种生态系统调节服务的互馈关系及机制[J]. 生态环境学报, 2024, 33(7): 1130-1141. |
| [3] | 汪东川, 李亭蓉, 王康健, 孙苗苗, 俞长锦, 杨菲, 杨琳, 张万恒, 刘云绮, 曾孔鹏. 金沙江观音岩库区植被覆盖度时空差异影响机制分析[J]. 生态环境学报, 2024, 33(7): 997-1007. |
| [4] | 张维琛, 王惺琪, 王博杰. 塔布河流域生态系统服务时空格局及影响因素分析[J]. 生态环境学报, 2024, 33(7): 1142-1152. |
| [5] | 徐佳乐, 杨兴川, 赵文吉, 杨志强, 钟一雪, 师乐颜, 马鹏飞. 气候变化背景下内蒙古中西部植被覆盖度演变特征研究[J]. 生态环境学报, 2024, 33(7): 1008-1018. |
| [6] | 李海燕, 杨涛, 廖依琳, 屈亚婕. 渭河流域(陕西段)河流生境质量分布格局及驱动力分析[J]. 生态环境学报, 2024, 33(7): 1153-1162. |
| [7] | 宋小龙, 马明德, 王鹏, 李陇堂, 米文宝, 宋永永. 2000—2022年宁夏不同地理分区生长季植被覆盖度时空非平稳性特征[J]. 生态环境学报, 2024, 33(6): 853-868. |
| [8] | 廖洪圣, 卫伟, 石宇. 黄土丘陵区典型流域土壤侵蚀时空演变特征及其驱动机制:以祖厉河为例[J]. 生态环境学报, 2024, 33(6): 908-918. |
| [9] | 王美娜, 范顺祥, 舒翰俊, 张建杰, 褚力其, 法玉琦. 河南省土壤侵蚀时空分异特征及土壤保持经济价值[J]. 生态环境学报, 2024, 33(5): 730-744. |
| [10] | 杨非凡, 何浩. 基于“EVI-ESV”伊犁河谷生态环境评估及生态分区构建[J]. 生态环境学报, 2024, 33(4): 655-664. |
| [11] | 田叙辰, 魏洪玲, 解胜男, 储启名, 杨婧, 张颖, 肖思秋, 唐中华, 刘英, 李德文. 基于MaxEnt模型的东北地区槭树潜在地理分布[J]. 生态环境学报, 2024, 33(4): 509-519. |
| [12] | 李霞, 陈永昊, 陈喆, 张国壮, 唐梦雅. 中国沿海地区植被NDVI时空变化及驱动力分析[J]. 生态环境学报, 2024, 33(2): 180-191. |
| [13] | 田成诗, 孙瑞欣. 长江经济带市域生态环境质量空间分异与影响因素分析——基于三生空间的土地利用转型[J]. 生态环境学报, 2023, 32(7): 1173-1184. |
| [14] | 王琳, 卫伟. 黄土高原典型县域生态系统服务变化特征及驱动因素[J]. 生态环境学报, 2023, 32(6): 1140-1148. |
| [15] | 李建辉, 党争, 陈琳. 黄河几字弯都市圈PM2.5时空特征及影响因素分析[J]. 生态环境学报, 2023, 32(4): 697-705. |
| 阅读次数 | ||||||
|
全文 |
|
|||||
|
摘要 |
|
|||||