生态环境学报 ›› 2024, Vol. 33 ›› Issue (4): 509-519.DOI: 10.16258/j.cnki.1674-5906.2024.04.002
田叙辰1,2( ), 魏洪玲1,2, 解胜男1,2, 储启名1,2, 杨婧1,2, 张颖1,2, 肖思秋1,2, 唐中华1,2,3, 刘英1,2,3, 李德文1,2,3,*()
收稿日期:2023-12-14
出版日期:2024-04-18
发布日期:2024-05-31
通讯作者:
*李德文。E-mail: lidewen1@126.com作者简介:田叙辰(1998年生),女,硕士研究生,研究方向为植物生理生态。E-mail: 3364871597@qq.com
基金资助:
TIAN Xuchen1,2(), WEI Hongling1,2, XIE Shengnan1,2, CHU Qiming1,2, YANG Jing1,2, ZHANG Ying1,2, XIAO Siqiu1,2, TANG Zonghua1,2,3, LIU Ying1,2,3, LI Dewen1,2,3,*()
Received:2023-12-14
Online:2024-04-18
Published:2024-05-31
摘要:
槭属植物是东北地区针阔混交林的重要组成成分,研究东北地区槭树的地理分布具有重要生态意义。为了解影响槭树潜在分布的关键气候因素,保护槭树的种质资源和可持续发展提供参考,基于野外调查数据,结合19个气候因子,应用 MaxEnt 模型模拟当代(1970-2000年)和未来(2030s、2050s)4种气候情景下槭树(东北槭Acer mandshuricum Maxim、色木槭A. mono Maxim、茶条槭A. ginnala Maxim和紫花槭A. pseudosieboldianum (Pax) Komarov)的潜在地理分布。结果表明,1)AUC值>0.9,表明模型具有较高的准确性。2)在当代气候情景下,4种槭树的地理分布区主要集中在长白山和小兴安岭地区,其中茶条槭分布最广,面积为3.79×10⁵ km2。东北槭与适生区分布相关性最高的气候因子为年降水量,色木槭为降水量季节性变化,茶条槭为最湿季度平均温度,紫花槭为最干季度降水量。3)在未来4种气候情景下,槭树的适生区中心呈向高纬度地区迁移的趋势,适生区分布面积均减少,其中色木槭向北迁移最远,迁移距离为338 km,茶条槭面积缩减最大,减少比例为89.1%。未来气候情景下,影响槭树适生区分布的主要因子为年降水量、降水量季节性变化和最干季度降水量。综上,降水因子是决定槭树分布格局的主要气候条件。气候因子间交互探测分析为非线性增强,表明降水和温度因子交互作用大于降水因子单独作用。该研究考虑了多种气候因素的作用,有助于全面了解影响槭树分布的关键因素,提供了不同气候情景下槭树的潜在分布的情况,为槭树的管理、保护和合理选址提供科学依据。
中图分类号:
田叙辰, 魏洪玲, 解胜男, 储启名, 杨婧, 张颖, 肖思秋, 唐中华, 刘英, 李德文. 基于MaxEnt模型的东北地区槭树潜在地理分布[J]. 生态环境学报, 2024, 33(4): 509-519.
TIAN Xuchen, WEI Hongling, XIE Shengnan, CHU Qiming, YANG Jing, ZHANG Ying, XIAO Siqiu, TANG Zonghua, LIU Ying, LI Dewen. Potential Geographical Distribution of Acer in Northeast China Based on the MaxEnt Model[J]. Ecology and Environment, 2024, 33(4): 509-519.
| 变量 | 变量名称 | 单位 | 东北槭 | 色木槭 | 茶条槭 | 紫花槭 |
|---|---|---|---|---|---|---|
| BIO1 | 年平均气温 | ℃ | 1.26‒4.79 | -0.53‒6.35 | -0.81‒6.35 | 1.52‒6.35 |
| BIO2 | 平均气温日较差 | ℃ | 12.6‒12.7 | 11.9‒13.6 | 11.9‒13.9 | 11.9‒12.7 |
| BIO3 | 等温性 | - | 25.3‒26.9 | 24.1‒25.1 | 23.8‒25.1 | 25.1‒26.4 |
| BIO4 | 气温季节性变动系数 | - | 1256‒1355 | 1273‒1569 | 1273‒1653 | 1273‒1296 |
| BIO5 | 最热月份最高温度 | ℃ | 22.8‒26.5 | 25.2‒27.6 | 26.1‒27.6 | 23.3‒27.6 |
| BIO6 | 最冷月份最低温度 | ℃ | -24.3‒ -23.4 | -31.1‒ -19.9 | -32.2‒ -19.9 | -24.9‒ -19.9 |
| BIO7 | 气温年较差 | ℃ | 47.1‒49.9 | 47.5‒56.3 | 47.5‒58.3 | 47.5‒48.2 |
| BIO8 | 最湿季度平均温度 | ℃ | 16.1‒20.4 | 17.6‒21.2 | 18.2‒21.2 | 16.7‒21.2 |
| BIO9 | 最干季度平均温度 | ℃ | -17.0‒ -12.8 | -21.0‒ -10.0 | -20.9‒ -10.4 | -15.4‒ -10.5 |
| BIO10 | 最暖季度平均温度 | ℃ | 16.1‒20.4 | 17.6‒21.2 | 18.2‒21.2 | 16.7‒21.2 |
| BIO11 | 最冷季度平均温度 | ℃ | -12.8‒ -17.0 | -21.0‒ -10.0 | -22.3‒ -10.4 | -15.4‒10.5 |
| BIO12 | 年降水量 | mm | 791‒824 | 635‒852 | 518‒852 | 758‒852 |
| BIO13 | 最湿月份降水量 | mm | 190‒211 | 154‒213 | 126‒213 | 182‒213 |
| BIO14 | 最干月份降水量 | mm | 6.00‒8.00 | 5.00‒9.00 | 4.00‒9.00 | 7.00‒9.00 |
| BIO15 | 降水量季节性变动系数 | - | 97.9‒99.1 | 98.3‒102 | 99.2‒98.3 | 95.6‒98.3 |
| BIO16 | 最湿季度降水量 | mm | 350‒604 | 331‒606 | 323‒555 | 358‒606 |
| BIO17 | 最干季度降水量 | mm | 11.0‒39.0 | 10.0‒39.0 | 13.0‒38.0 | 13.0‒39.0 |
| BIO18 | 最暖季度降水量 | mm | 350‒604 | 331‒606 | 323‒555 | 358‒606 |
| BIO19 | 最冷季度降水量 | mm | 11.0‒39.0 | 10.0‒39.0 | 13.0‒38.0 | 13.0‒39.0 |
表1 东北地区槭树潜在适宜生境的气候变量
Table 1 The climatic variables of potential suitable habitats of Acer in northeast area
| 变量 | 变量名称 | 单位 | 东北槭 | 色木槭 | 茶条槭 | 紫花槭 |
|---|---|---|---|---|---|---|
| BIO1 | 年平均气温 | ℃ | 1.26‒4.79 | -0.53‒6.35 | -0.81‒6.35 | 1.52‒6.35 |
| BIO2 | 平均气温日较差 | ℃ | 12.6‒12.7 | 11.9‒13.6 | 11.9‒13.9 | 11.9‒12.7 |
| BIO3 | 等温性 | - | 25.3‒26.9 | 24.1‒25.1 | 23.8‒25.1 | 25.1‒26.4 |
| BIO4 | 气温季节性变动系数 | - | 1256‒1355 | 1273‒1569 | 1273‒1653 | 1273‒1296 |
| BIO5 | 最热月份最高温度 | ℃ | 22.8‒26.5 | 25.2‒27.6 | 26.1‒27.6 | 23.3‒27.6 |
| BIO6 | 最冷月份最低温度 | ℃ | -24.3‒ -23.4 | -31.1‒ -19.9 | -32.2‒ -19.9 | -24.9‒ -19.9 |
| BIO7 | 气温年较差 | ℃ | 47.1‒49.9 | 47.5‒56.3 | 47.5‒58.3 | 47.5‒48.2 |
| BIO8 | 最湿季度平均温度 | ℃ | 16.1‒20.4 | 17.6‒21.2 | 18.2‒21.2 | 16.7‒21.2 |
| BIO9 | 最干季度平均温度 | ℃ | -17.0‒ -12.8 | -21.0‒ -10.0 | -20.9‒ -10.4 | -15.4‒ -10.5 |
| BIO10 | 最暖季度平均温度 | ℃ | 16.1‒20.4 | 17.6‒21.2 | 18.2‒21.2 | 16.7‒21.2 |
| BIO11 | 最冷季度平均温度 | ℃ | -12.8‒ -17.0 | -21.0‒ -10.0 | -22.3‒ -10.4 | -15.4‒10.5 |
| BIO12 | 年降水量 | mm | 791‒824 | 635‒852 | 518‒852 | 758‒852 |
| BIO13 | 最湿月份降水量 | mm | 190‒211 | 154‒213 | 126‒213 | 182‒213 |
| BIO14 | 最干月份降水量 | mm | 6.00‒8.00 | 5.00‒9.00 | 4.00‒9.00 | 7.00‒9.00 |
| BIO15 | 降水量季节性变动系数 | - | 97.9‒99.1 | 98.3‒102 | 99.2‒98.3 | 95.6‒98.3 |
| BIO16 | 最湿季度降水量 | mm | 350‒604 | 331‒606 | 323‒555 | 358‒606 |
| BIO17 | 最干季度降水量 | mm | 11.0‒39.0 | 10.0‒39.0 | 13.0‒38.0 | 13.0‒39.0 |
| BIO18 | 最暖季度降水量 | mm | 350‒604 | 331‒606 | 323‒555 | 358‒606 |
| BIO19 | 最冷季度降水量 | mm | 11.0‒39.0 | 10.0‒39.0 | 13.0‒38.0 | 13.0‒39.0 |
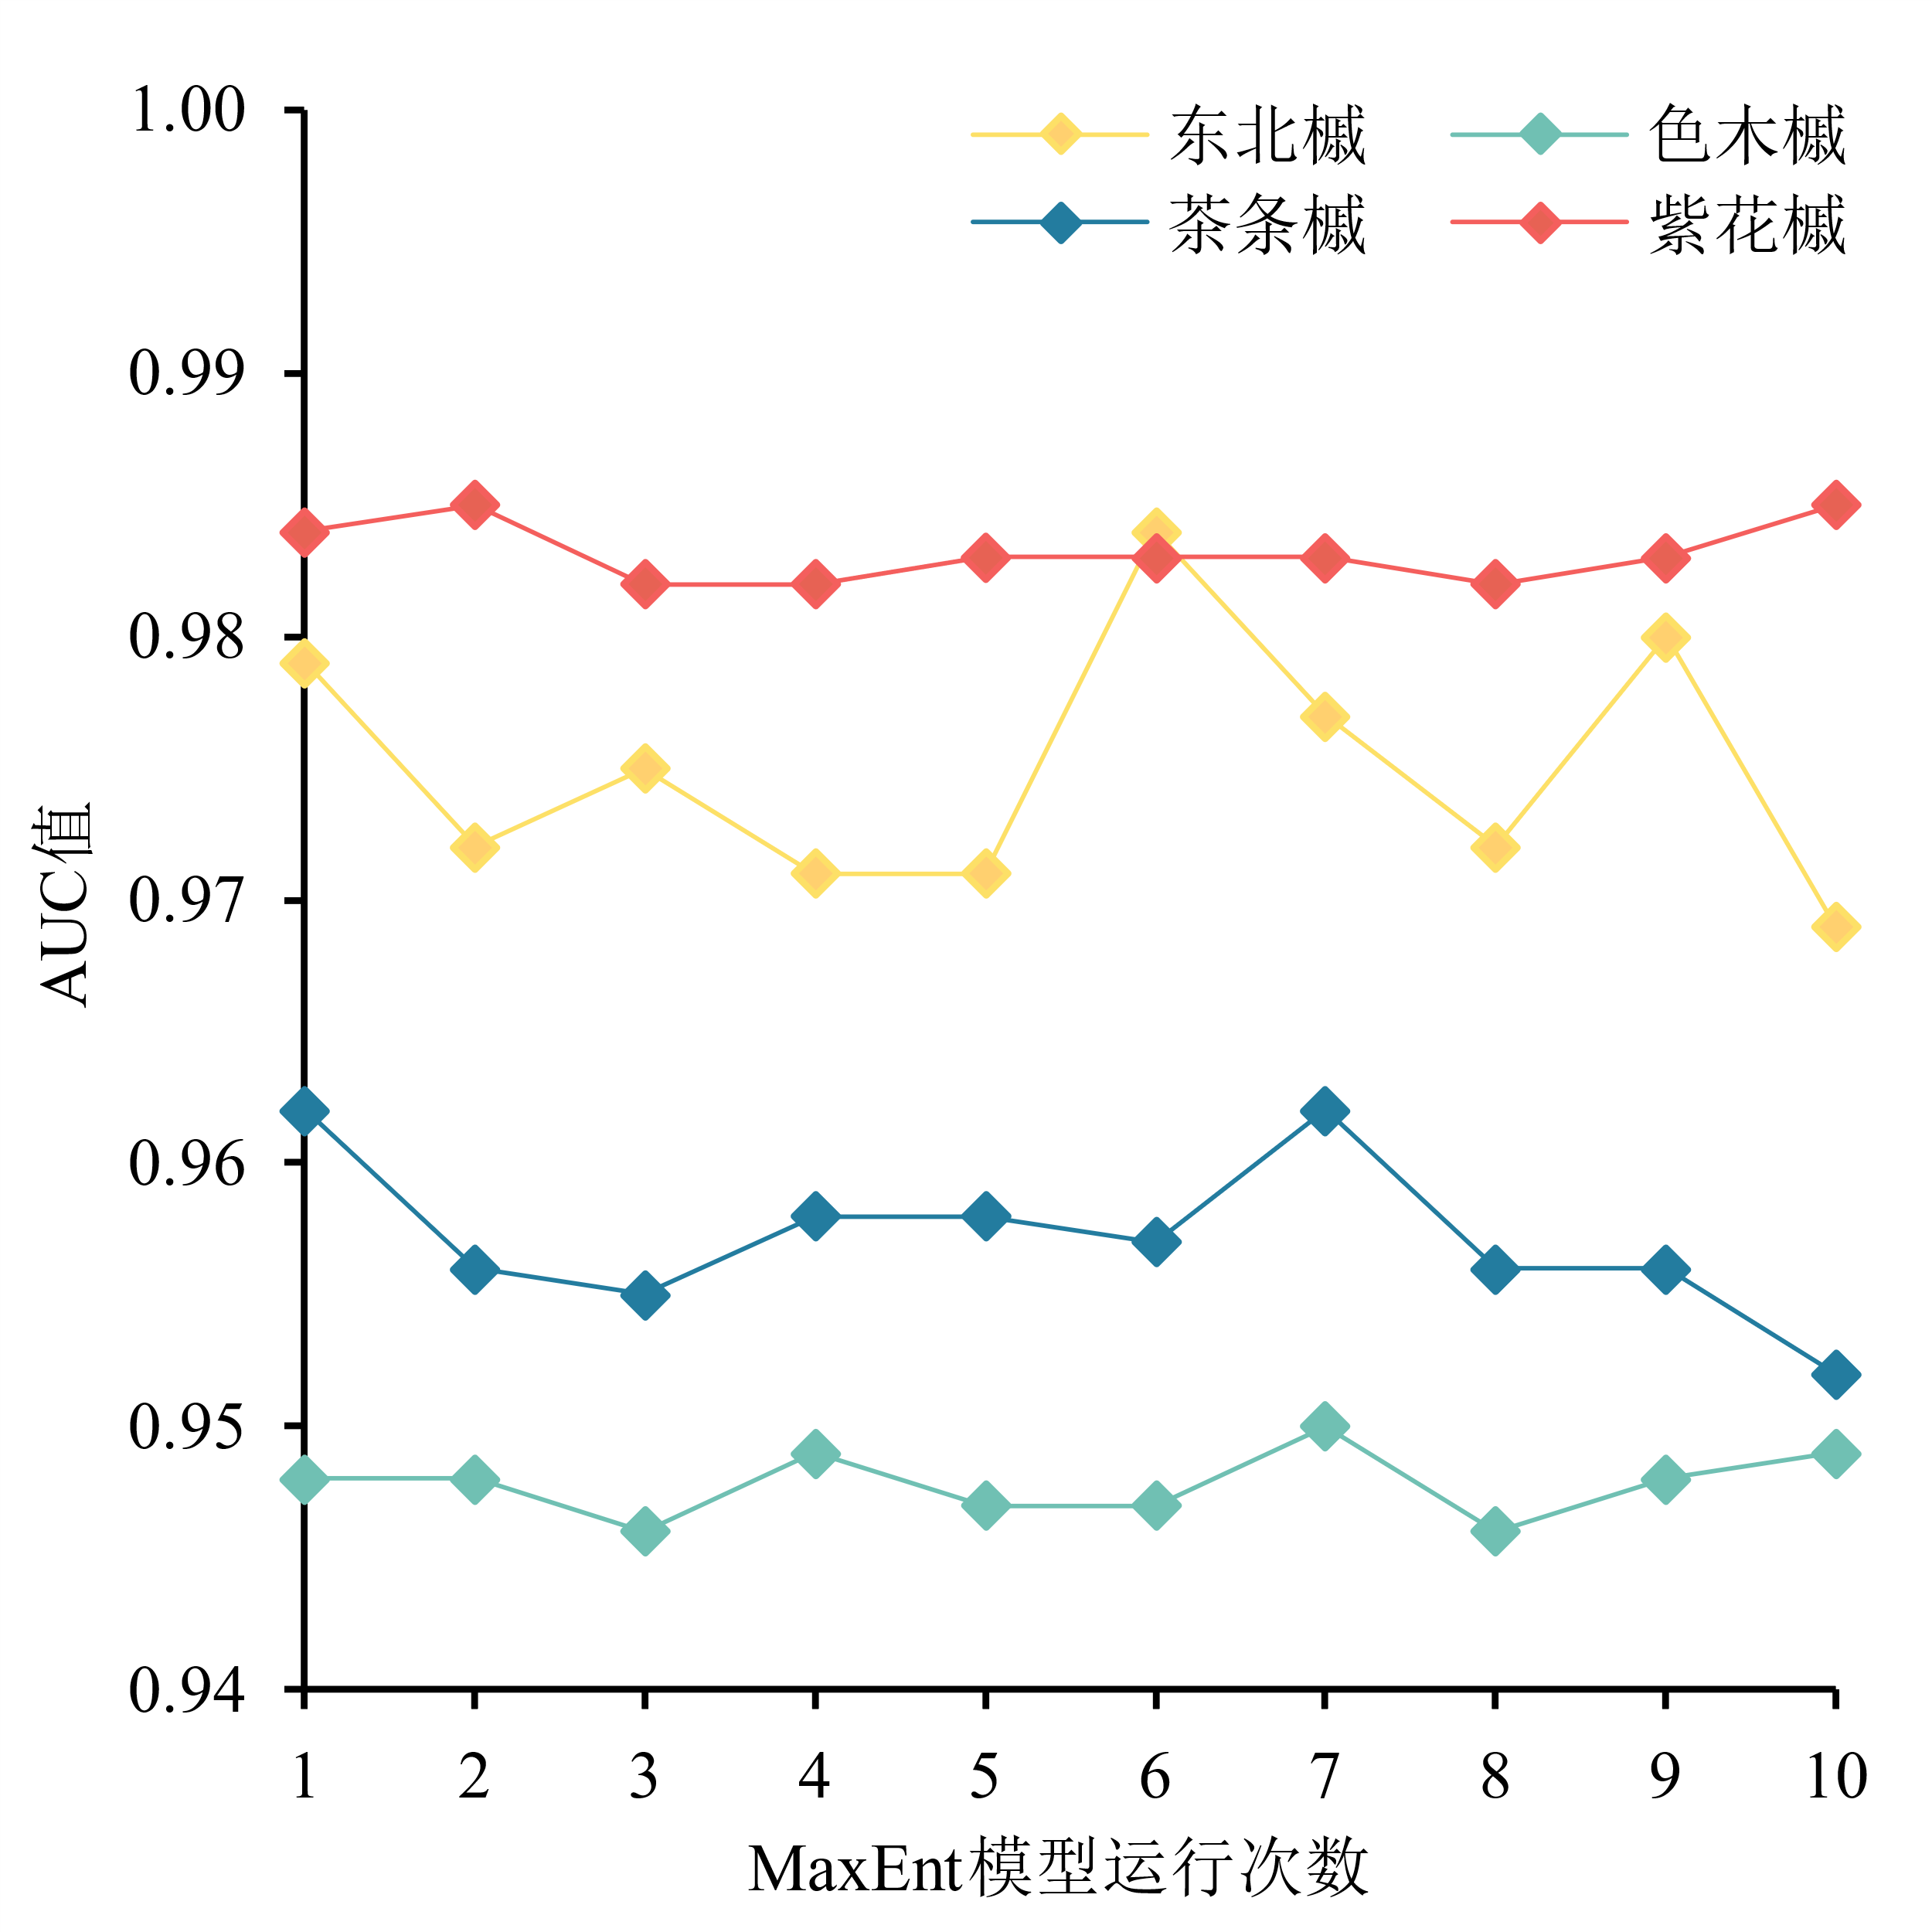
图1 MaxEnt模型预测精度
Figure 1 Prediction accuracy of MaxEnt model
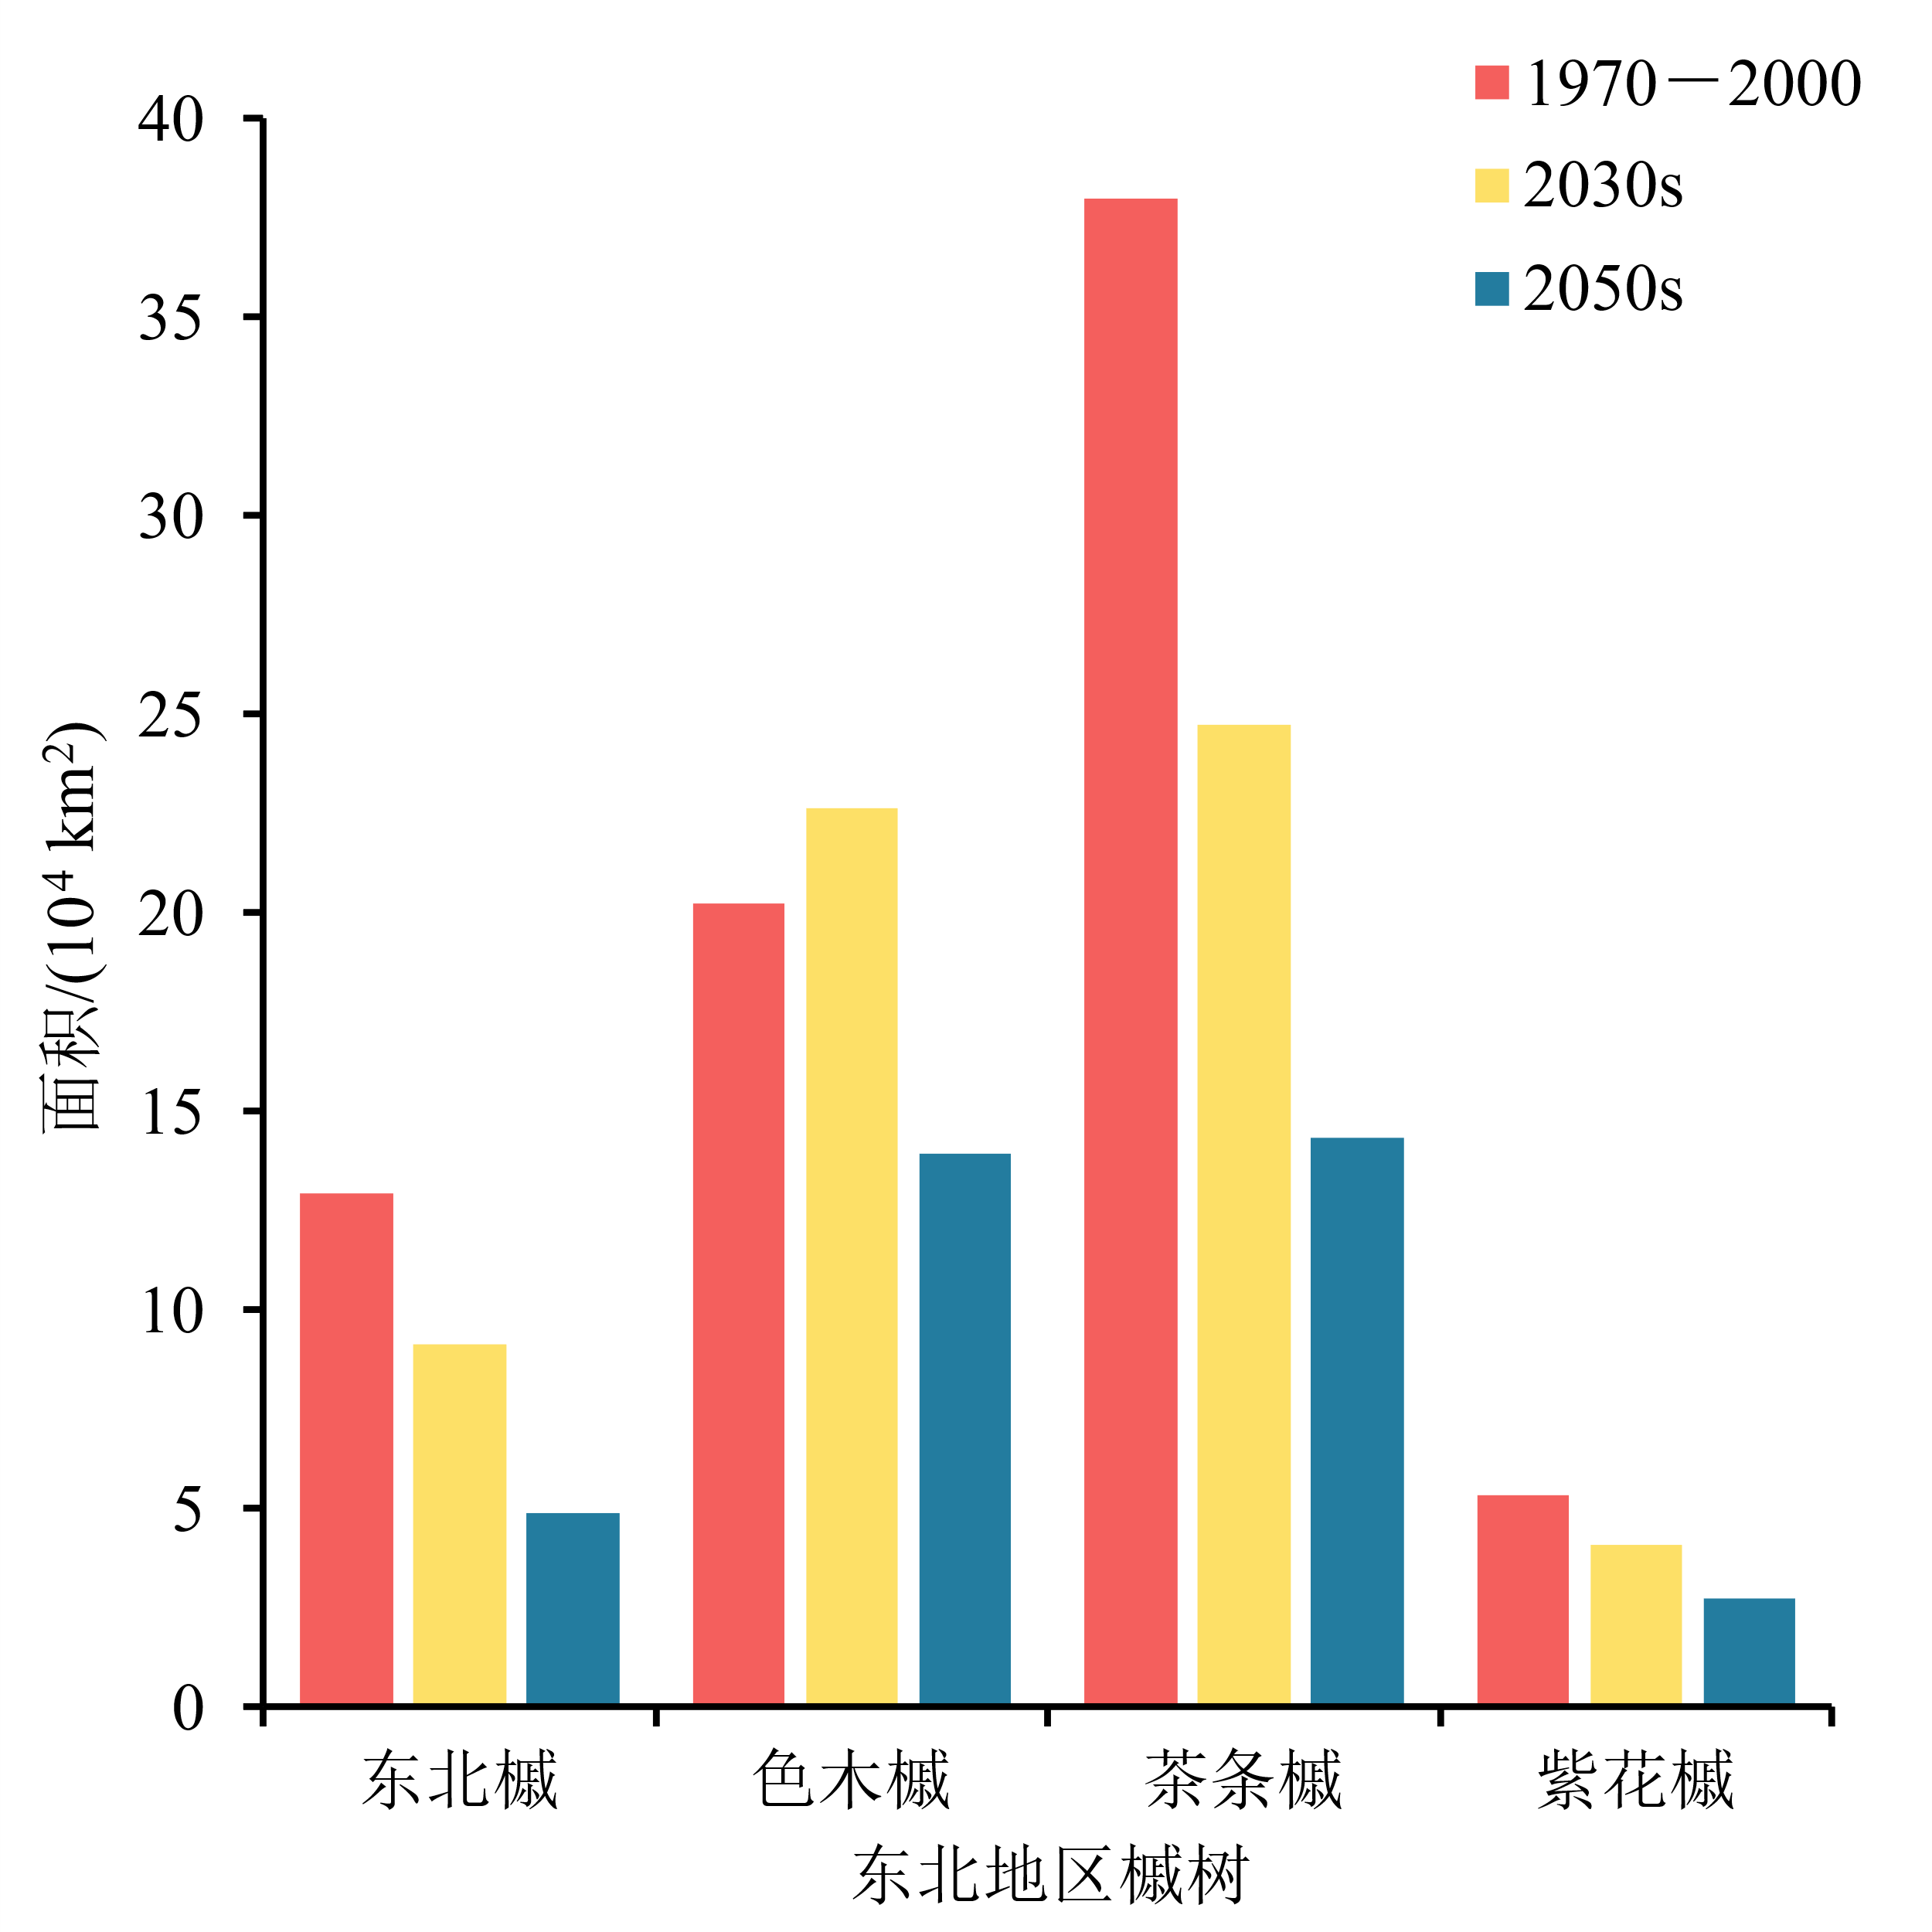
图2 当代及未来气候情景下适生区面积
Figure 2 Areas of suitable zone under current and future climate situation

图3 当代气候情景下东北地区槭树的潜在地理分布及适生区面积 基于自然资源部标准地图服务网站 2019 年发布的 GS(2019)1823 号标准地图制作,底图边界无修改。下同
Figure 3 Potential geographic distribution and suitable area of Acer in northeast region under current climate situation
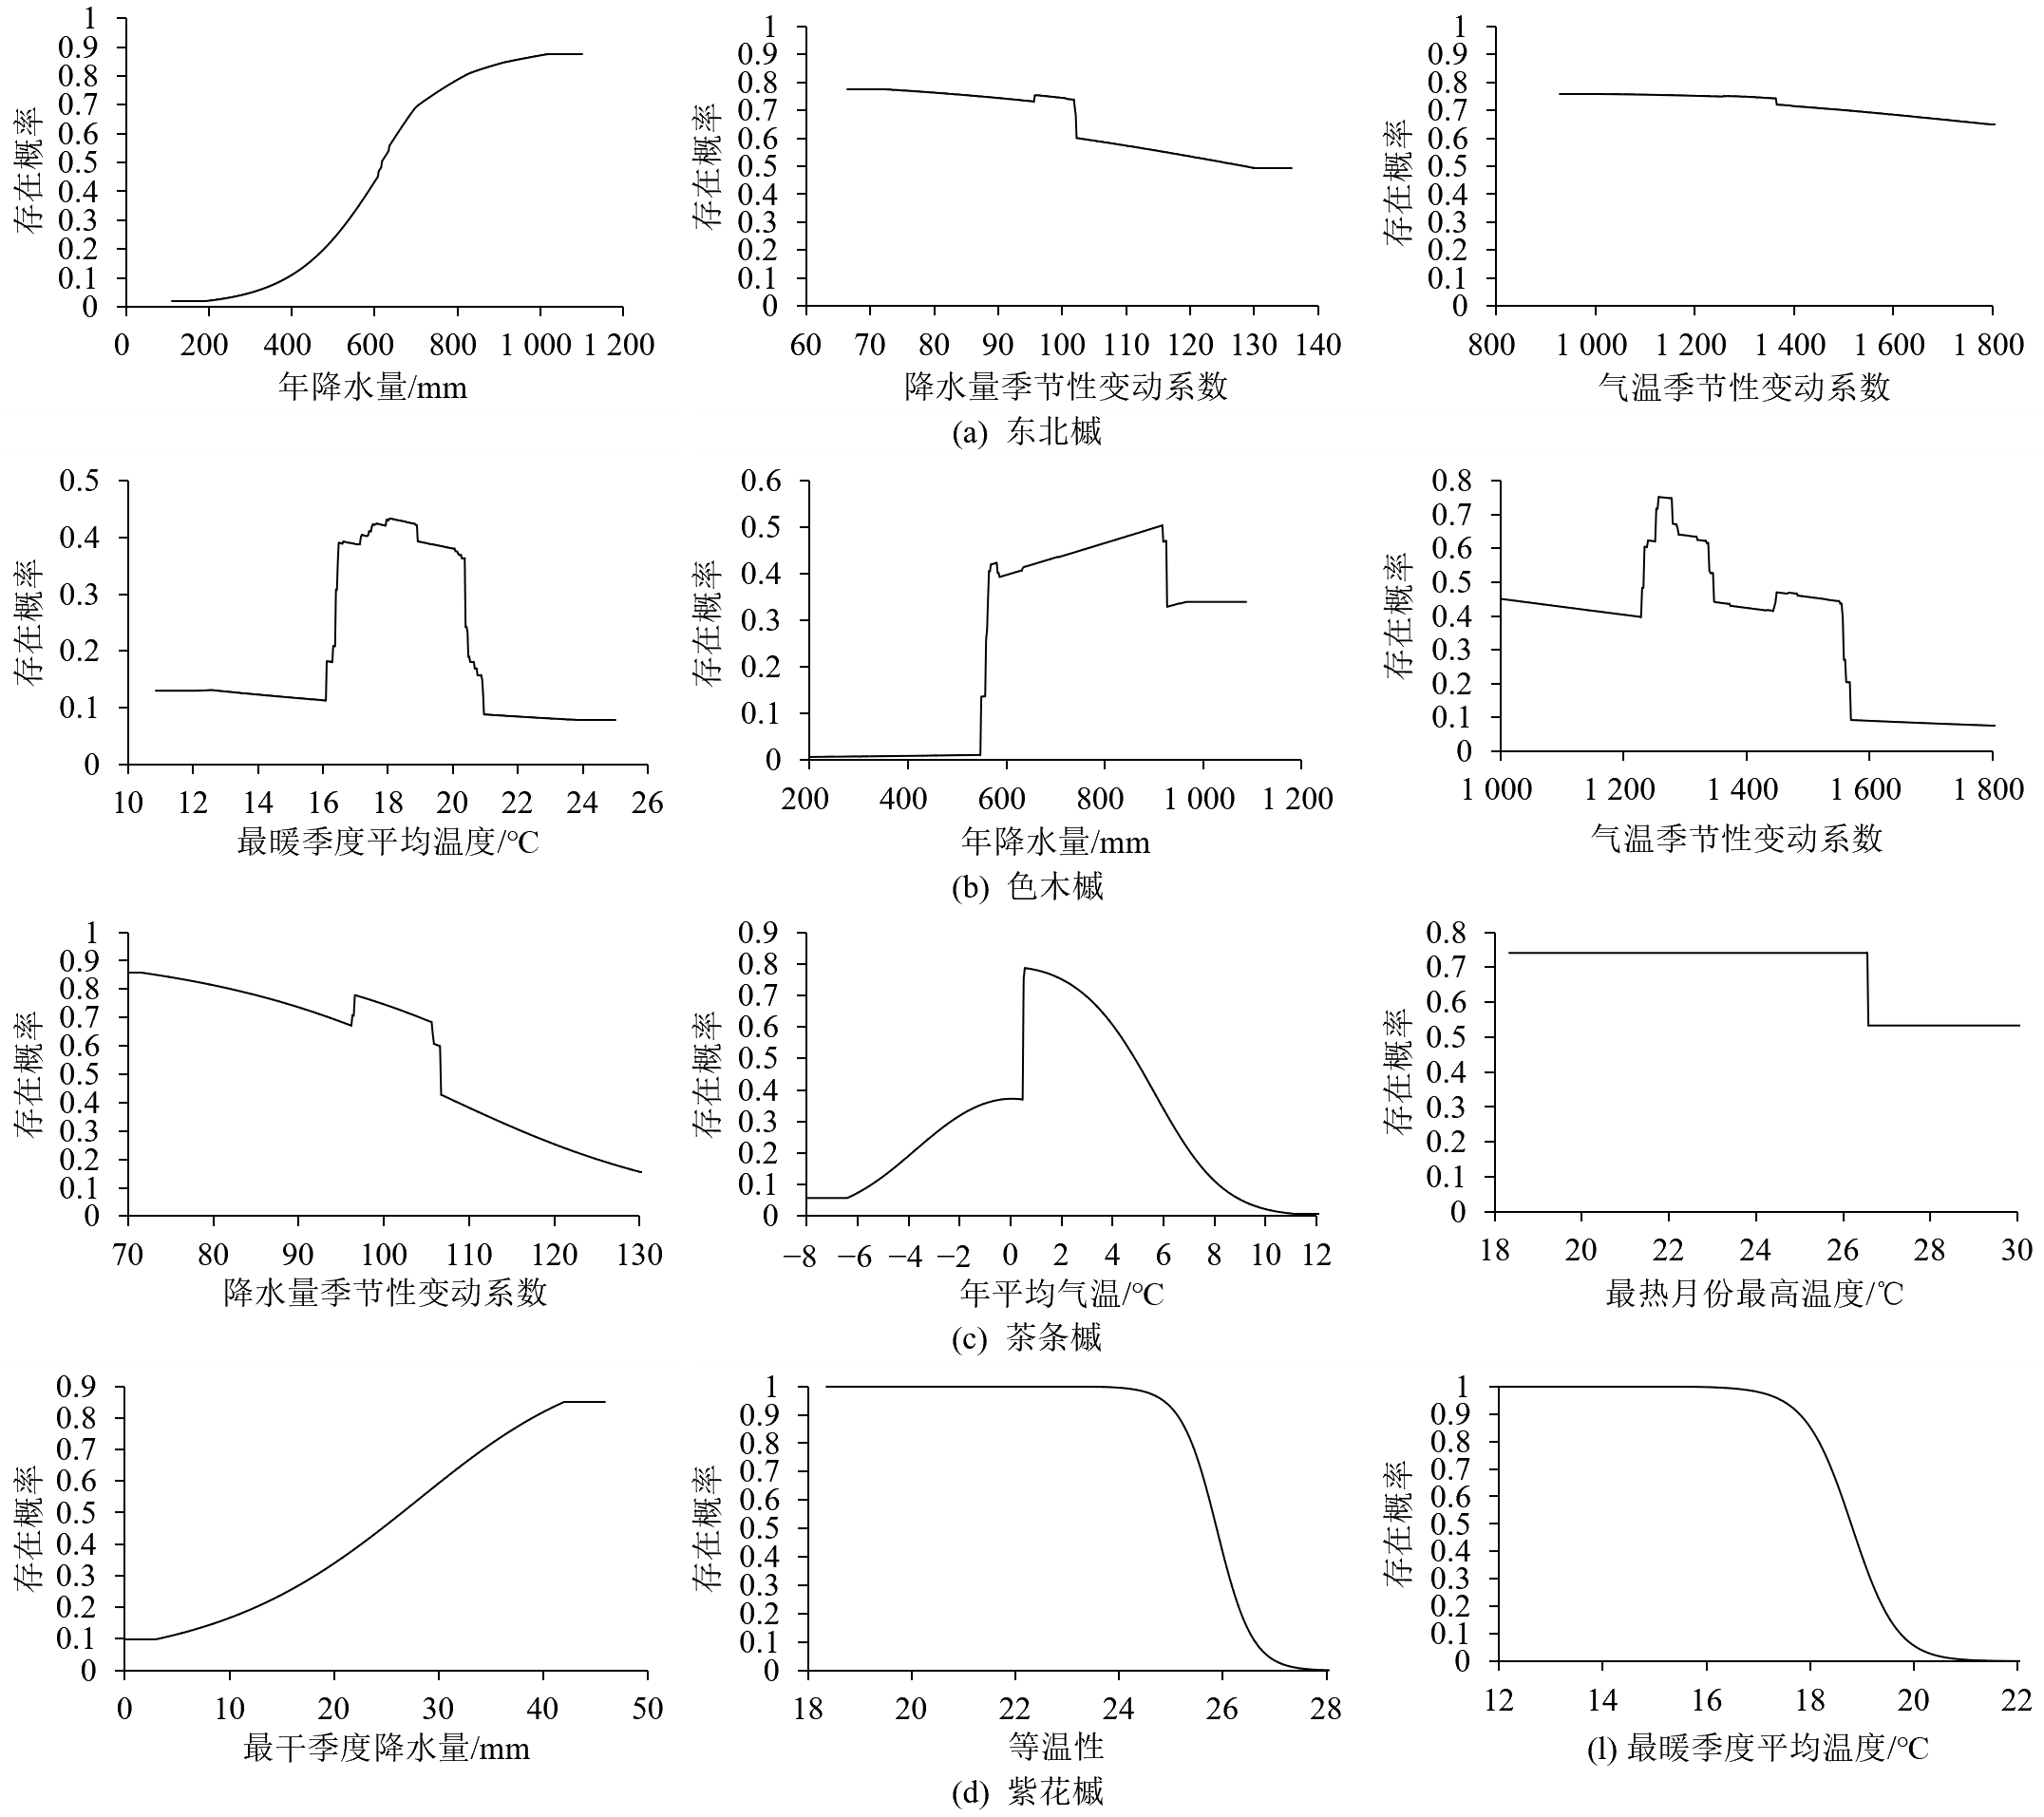
图4 气候变量的响应曲线
Figure 4 The response curve of climate variables
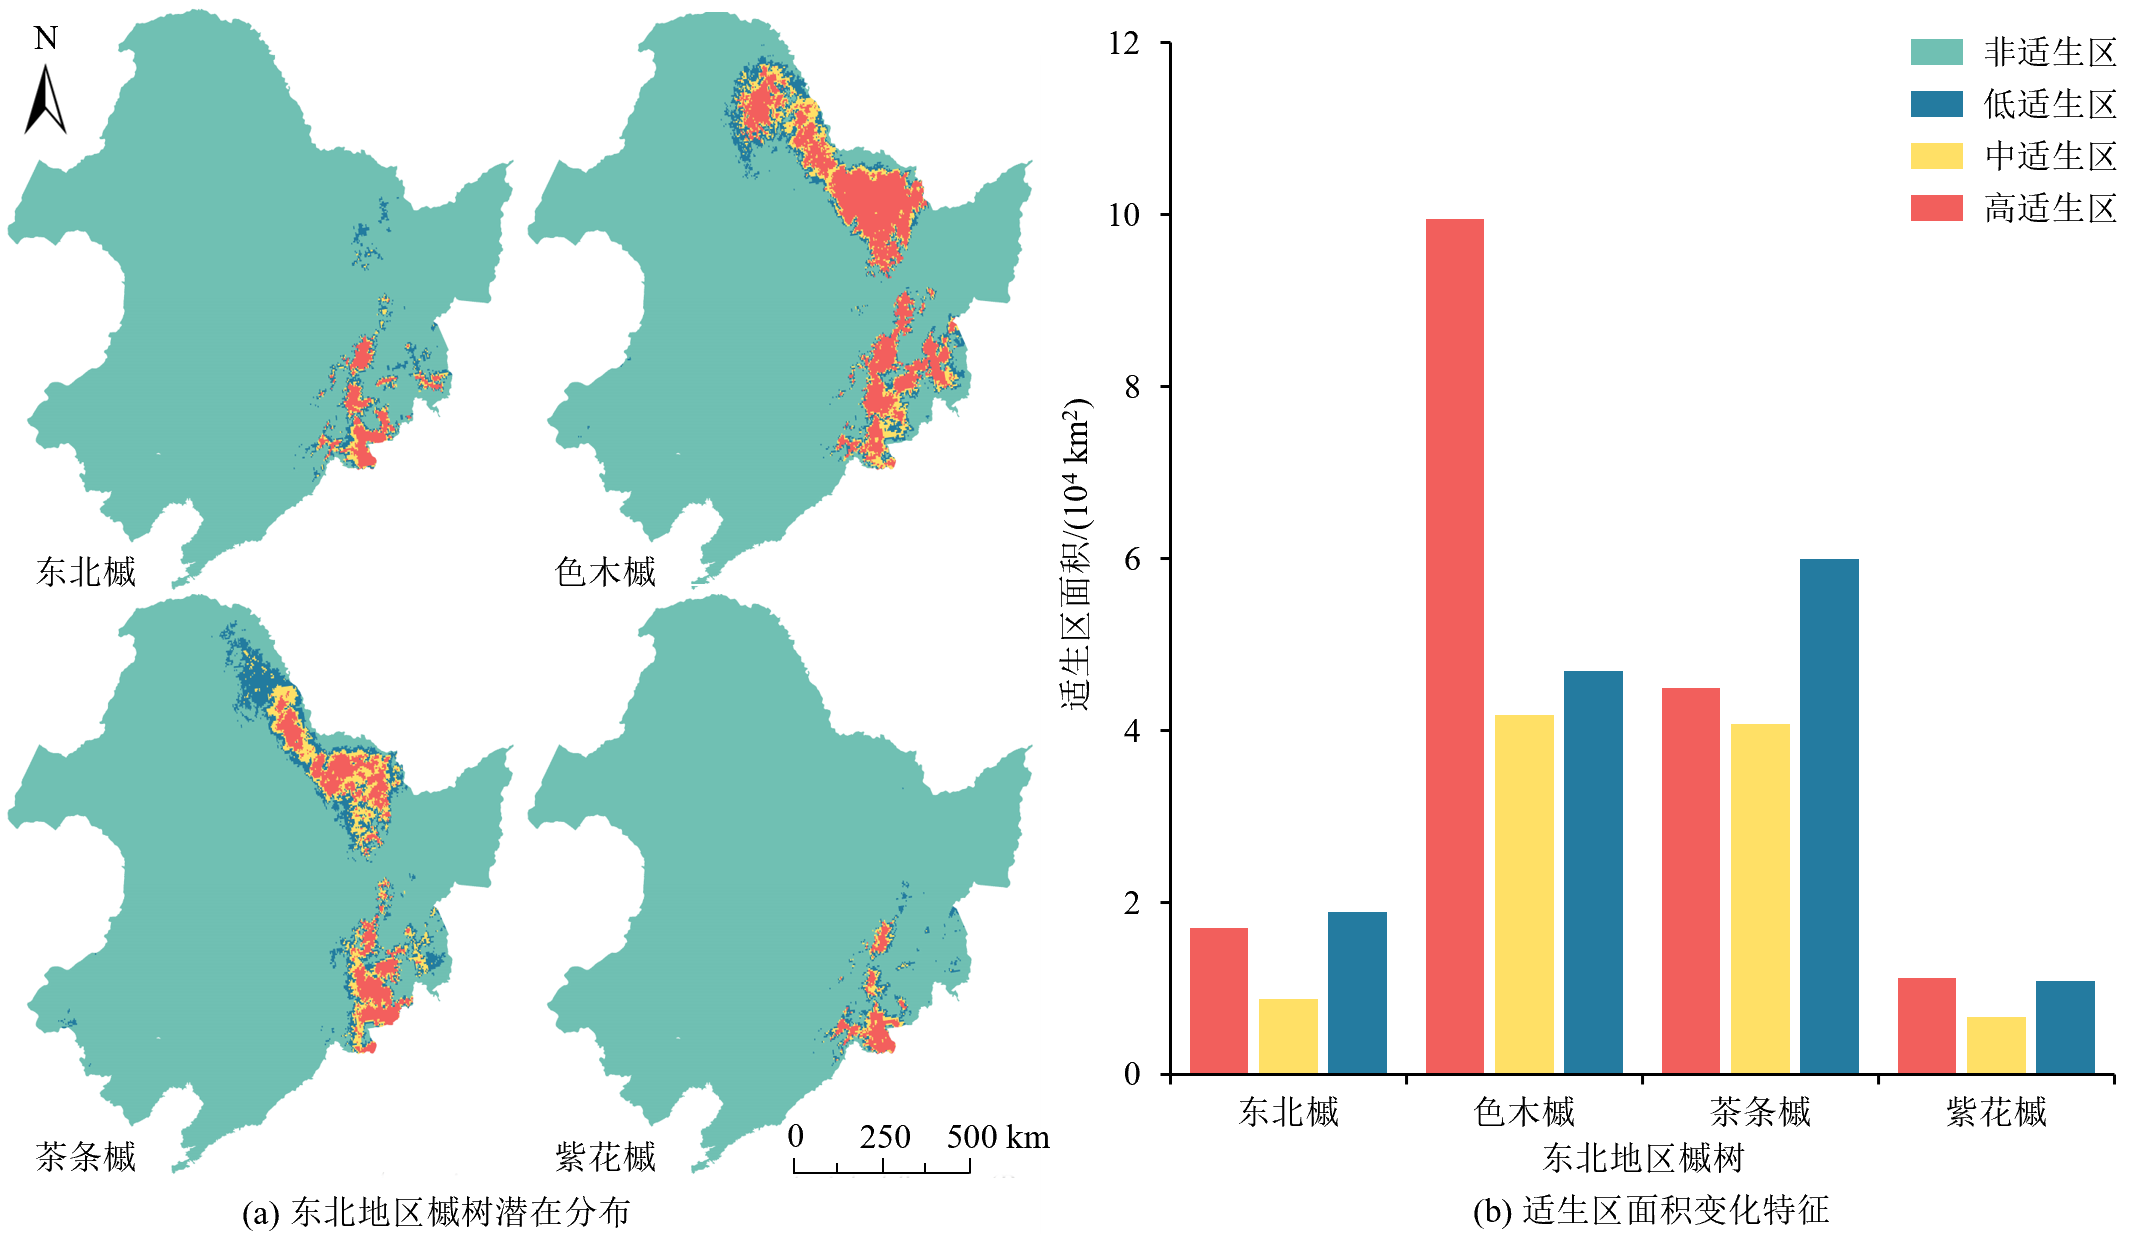
图5 未来SSP1-2.6情景下东北地区槭树的潜在地理分布及适生区面积
Figure 5 Potential geographic distributiont and suitable area of Acer in northeast region under SSP1-2.6 future climate situation
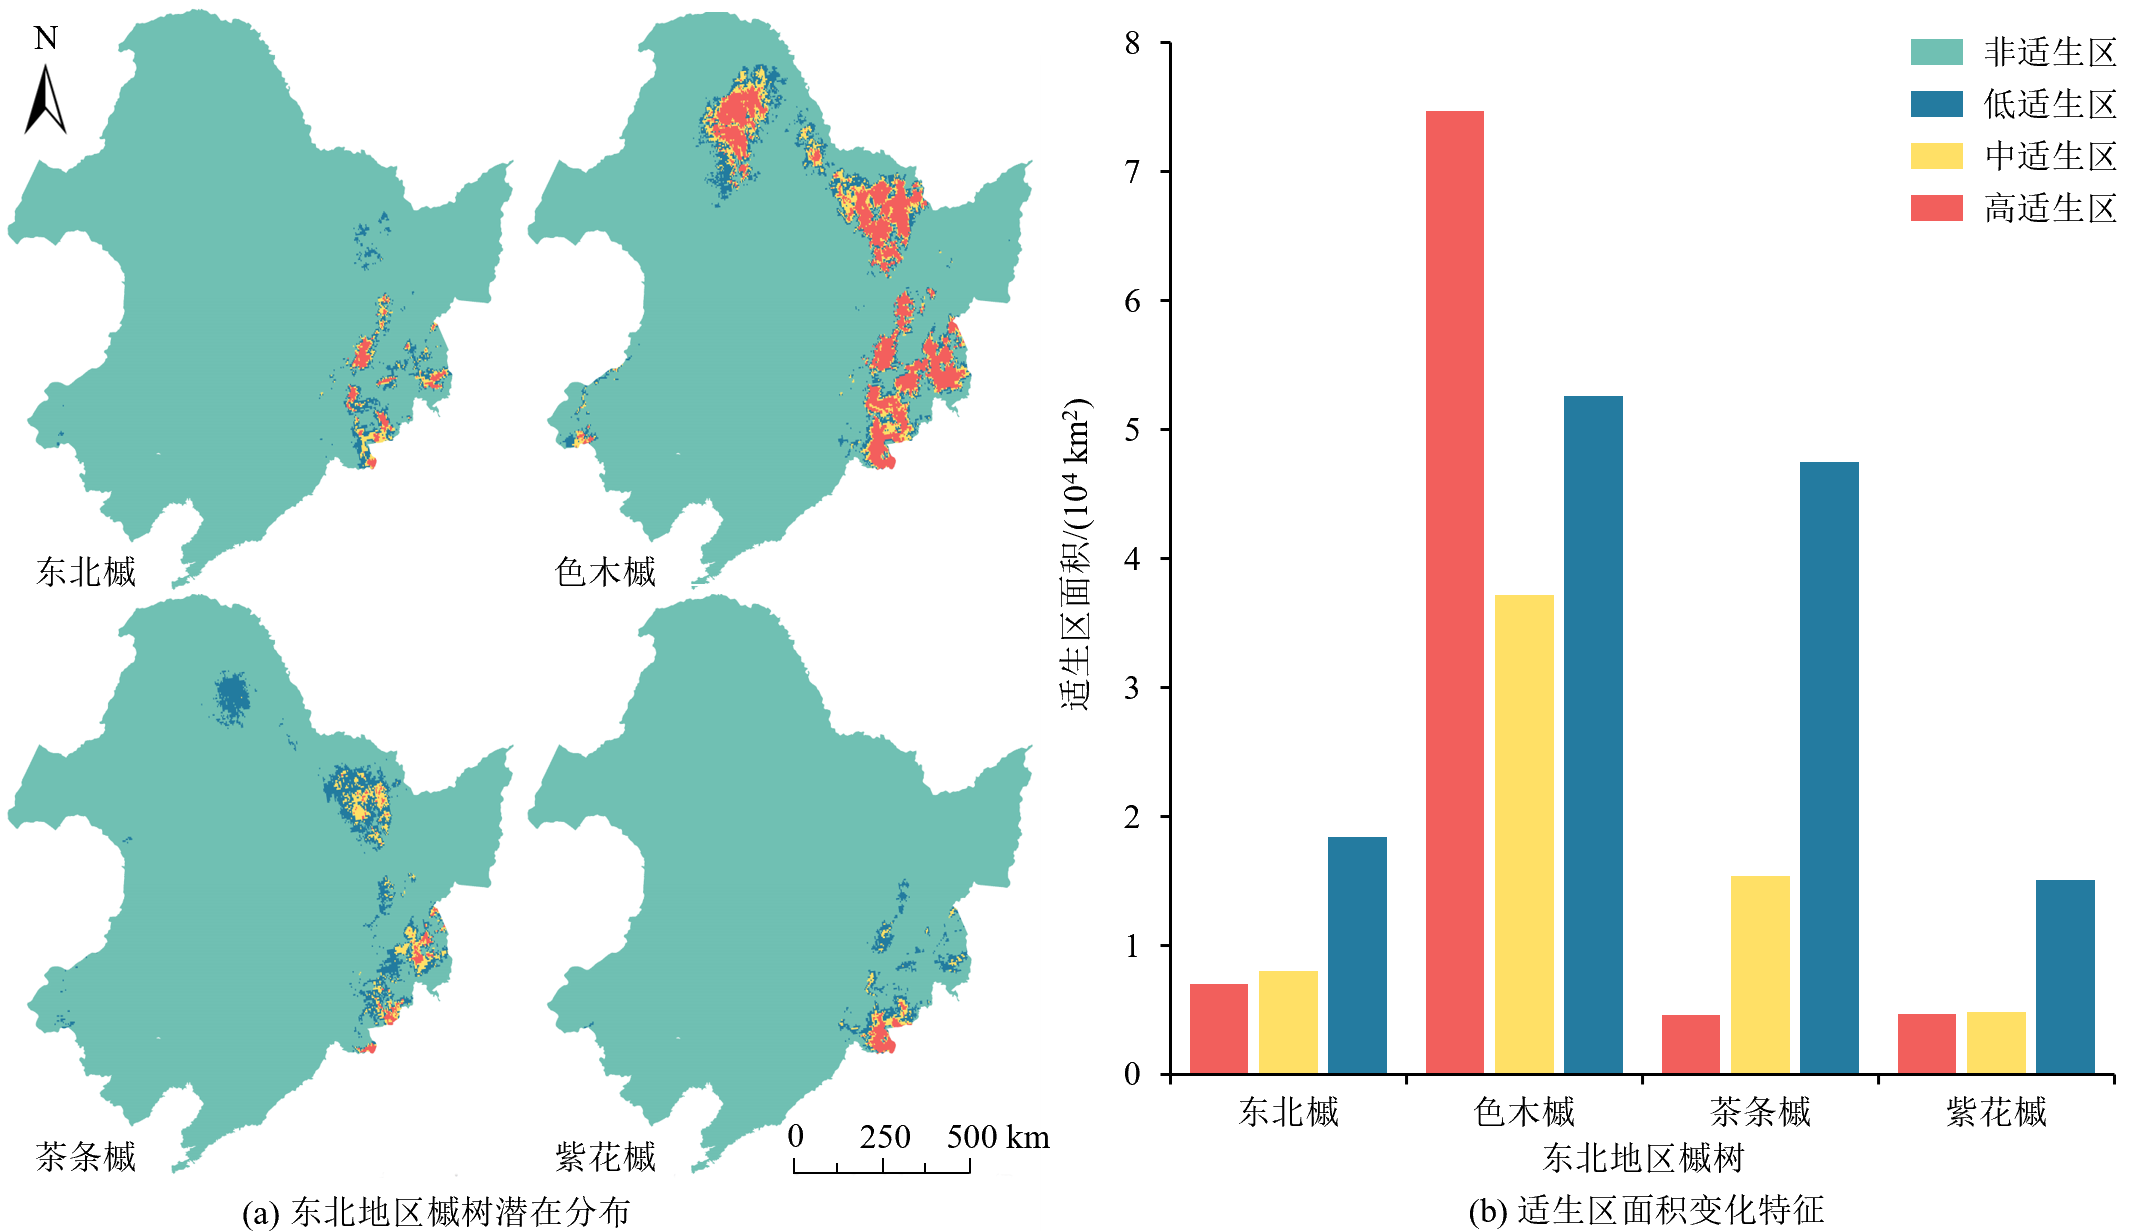
图6 未来SSP2-4.5情景下东北地区槭树的潜在地理分布及适生区面积
Figure 6 Potential geographic distributiont and suitable area of Acer in northeast region under SSP2-4.5 future climate situation
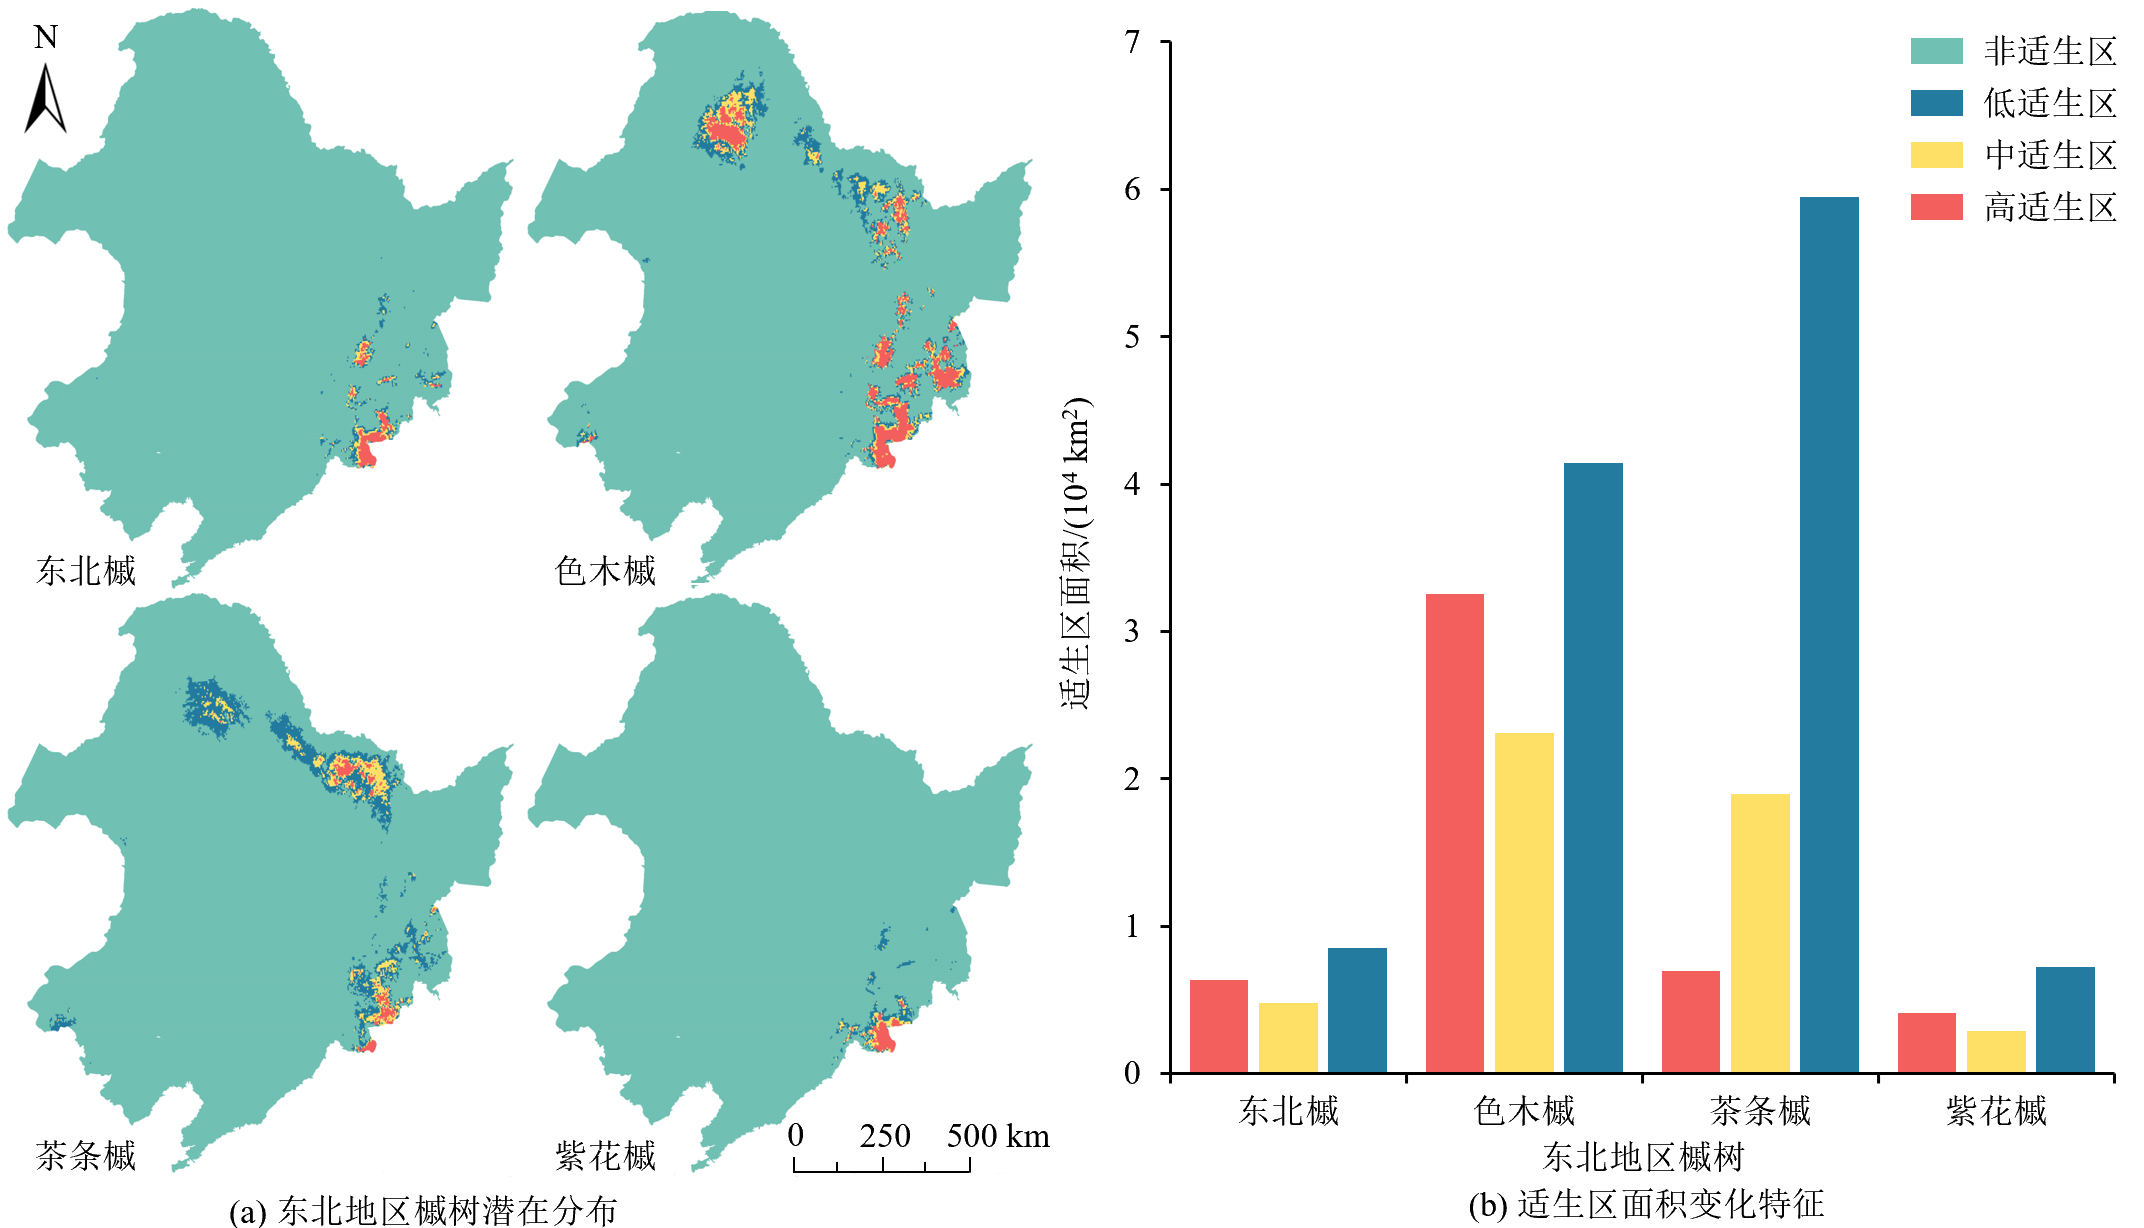
图7 未来SSP3-7.0情景下东北地区槭树的潜在地理分布及适生区面积
Figure 7 Potential geographic distribution and suitable area of Acer in northeast region under SSP3-7.0 future climate situation
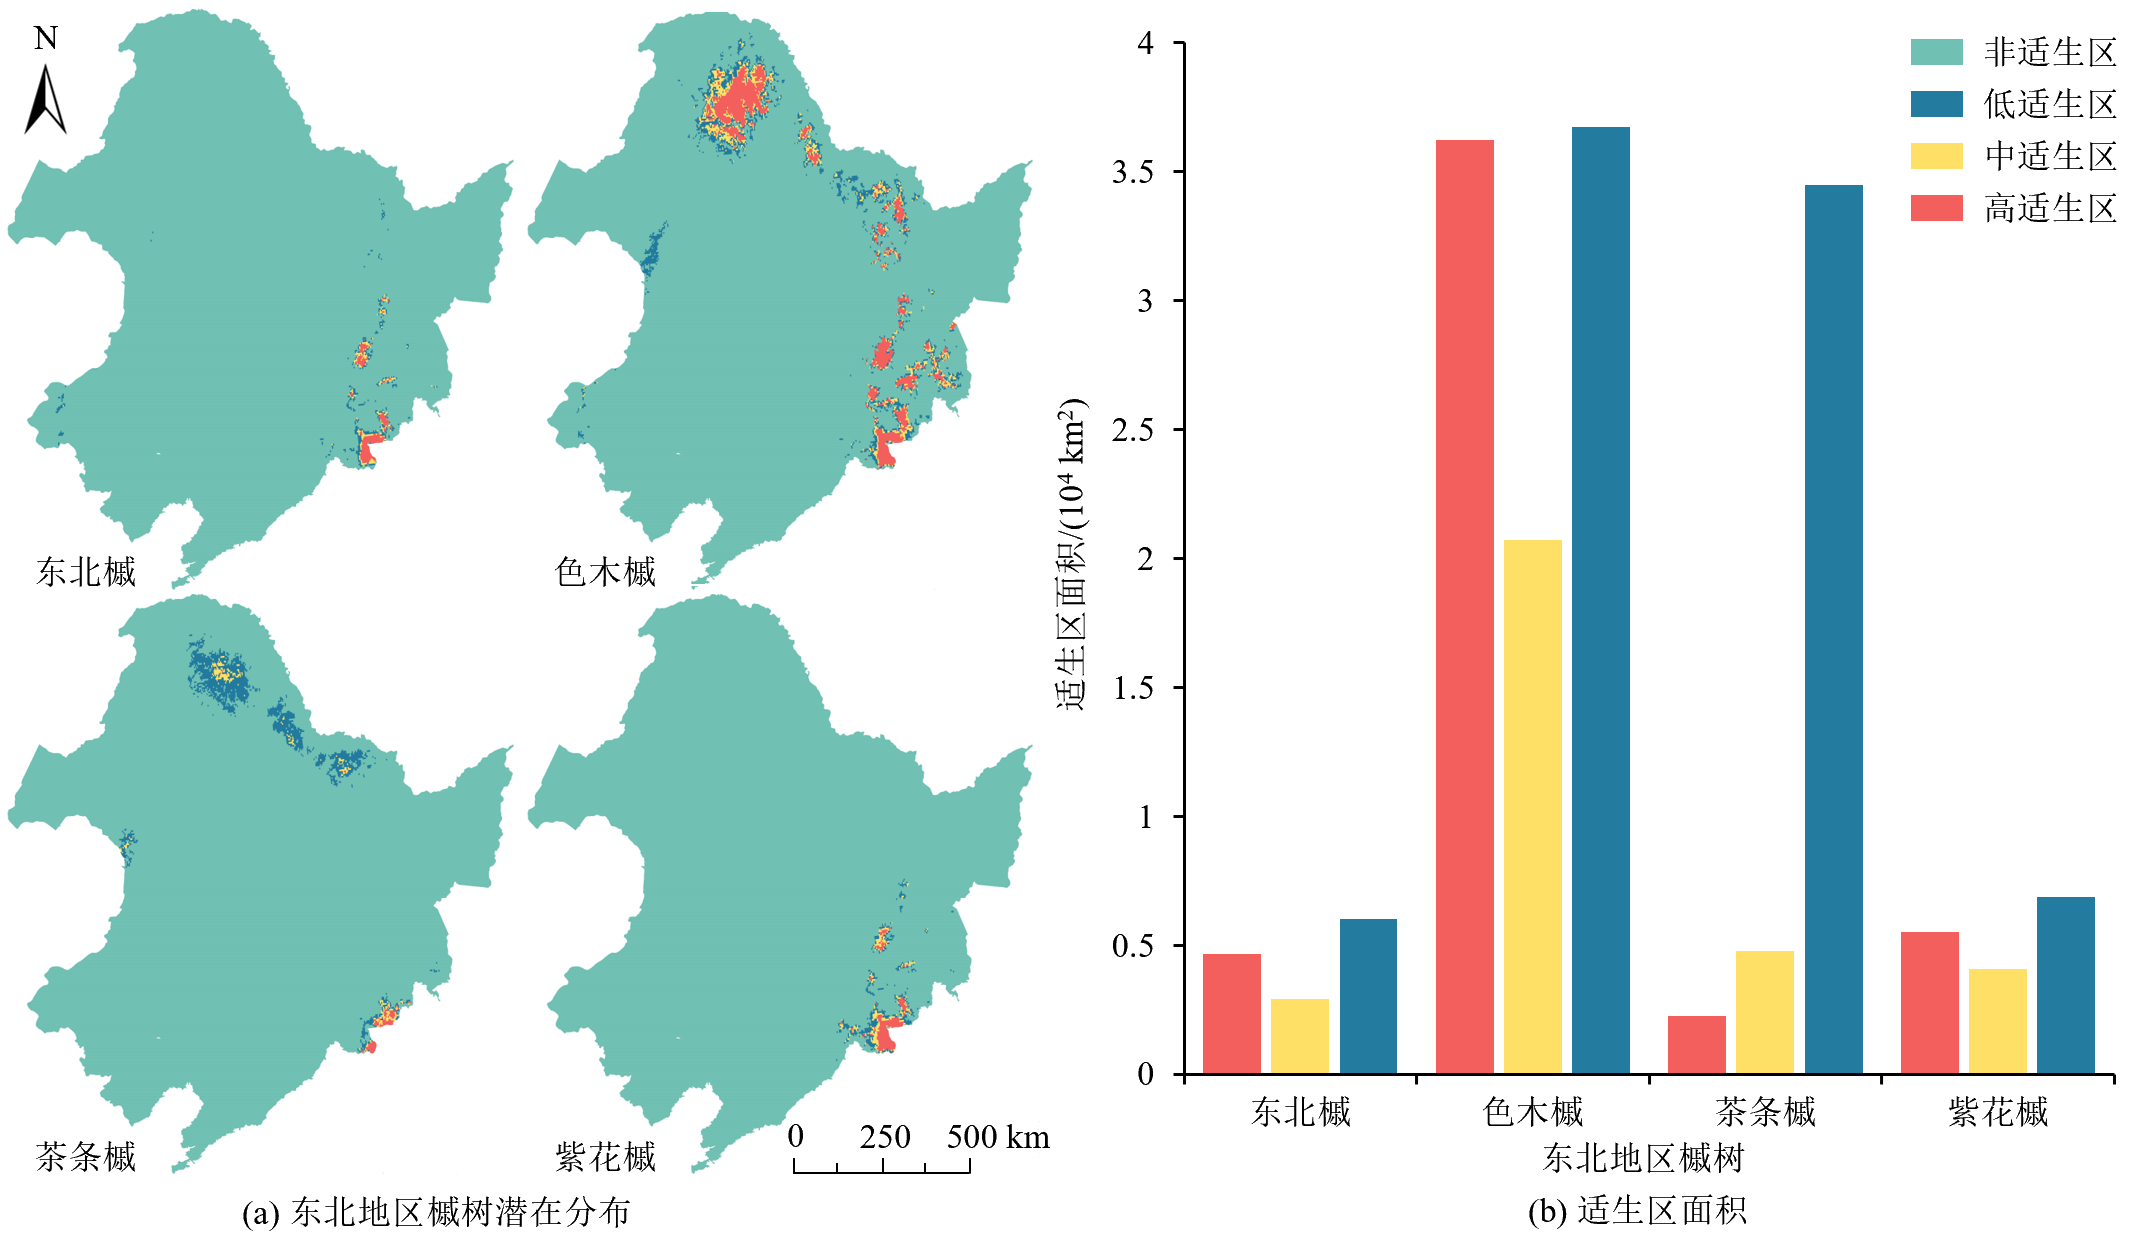
图8 未来 SSP5-8.5情景下东北地区槭树的潜在地理分布及适生区面积
Figure 8 Potential geographic distribution and suitable area of Acer in northeast region under SSP5-8.5 future climate situation
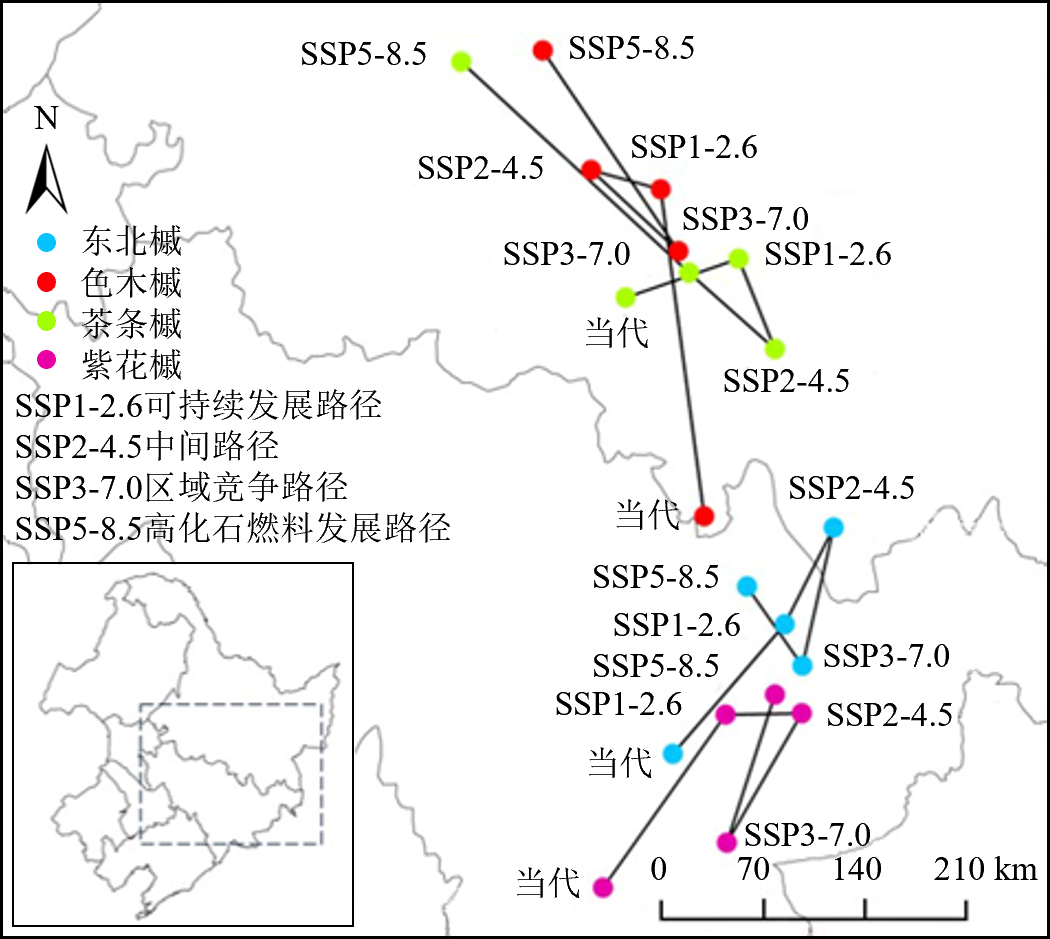
图9 当代及未来气候情景下槭树适生区中心迁移特征
Figure 9 Characteristic of central migration in suitable area of Acer under current and future climate situation
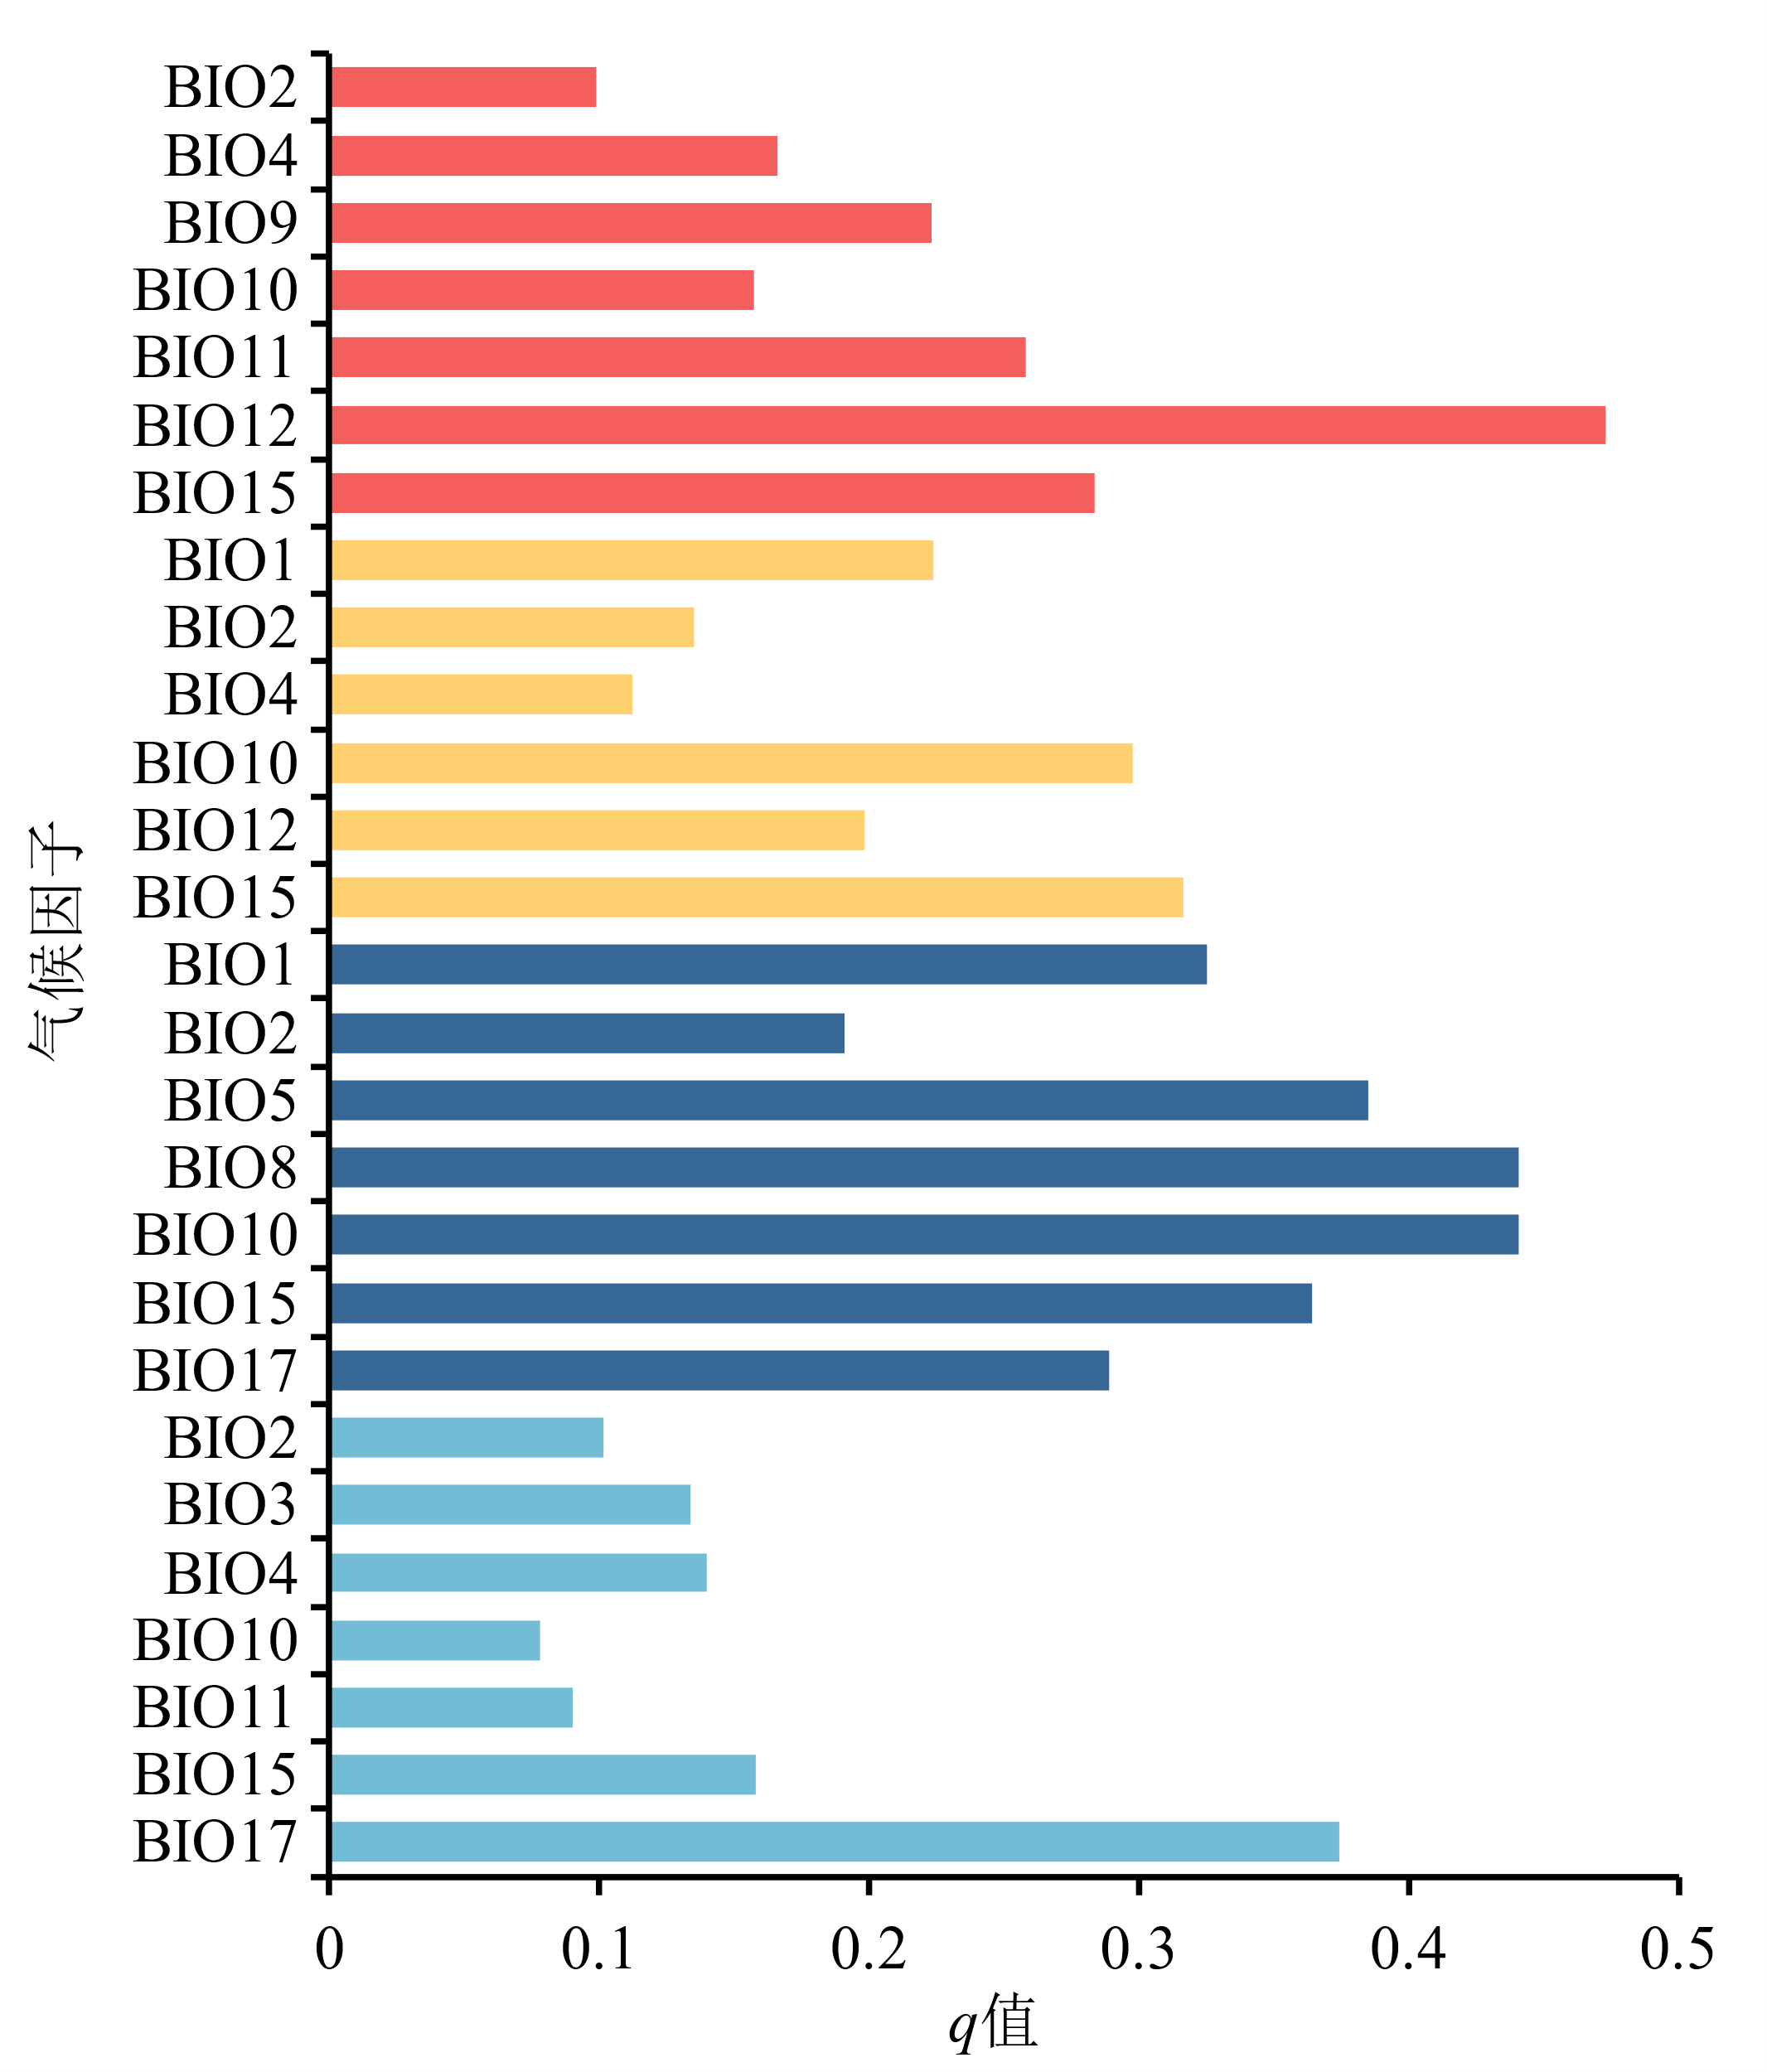
图10 当代情景下气候因子与适生区空间分化之间的相关性
Figure 10 Correlation between climatic factors and spatial differentiation of suitable area under current climate situation
| 槭树 | 交互因子 | q值 | 交互结果 |
|---|---|---|---|
| 东北槭 | BIO12∩BIO10 | 0.82 | 非线性增强 |
| 东北槭 | BIO12∩BIO9 | 0.78 | 非线性增强 |
| 东北槭 | BIO12∩BIO11 | 0.77 | 非线性增强 |
| 色木槭 | BIO15∩BIO1 | 0.69 | 非线性增强 |
| 色木槭 | BIO12∩BIO10 | 0.68 | 非线性增强 |
| 色木槭 | BIO15∩BIO10 | 0.67 | 非线性增强 |
| 茶条槭 | BIO15∩BIO1 | 0.80 | 非线性增强 |
| 茶条槭 | BIO15∩BIO8 | 0.77 | 双因子增强 |
| 茶条槭 | BIO15∩BIO10 | 0.77 | 双因子增强 |
| 紫花槭 | BIO17∩BIO2 | 0.75 | 非线性增强 |
| 紫花槭 | BIO17∩BIO10 | 0.73 | 非线性增强 |
| 紫花槭 | BIO17∩BIO3 | 0.69 | 非线性增强 |
表2 当代情景下气候因子交互探测结果
Table 2 Interaction detector results of climate factors under current situation
| 槭树 | 交互因子 | q值 | 交互结果 |
|---|---|---|---|
| 东北槭 | BIO12∩BIO10 | 0.82 | 非线性增强 |
| 东北槭 | BIO12∩BIO9 | 0.78 | 非线性增强 |
| 东北槭 | BIO12∩BIO11 | 0.77 | 非线性增强 |
| 色木槭 | BIO15∩BIO1 | 0.69 | 非线性增强 |
| 色木槭 | BIO12∩BIO10 | 0.68 | 非线性增强 |
| 色木槭 | BIO15∩BIO10 | 0.67 | 非线性增强 |
| 茶条槭 | BIO15∩BIO1 | 0.80 | 非线性增强 |
| 茶条槭 | BIO15∩BIO8 | 0.77 | 双因子增强 |
| 茶条槭 | BIO15∩BIO10 | 0.77 | 双因子增强 |
| 紫花槭 | BIO17∩BIO2 | 0.75 | 非线性增强 |
| 紫花槭 | BIO17∩BIO10 | 0.73 | 非线性增强 |
| 紫花槭 | BIO17∩BIO3 | 0.69 | 非线性增强 |
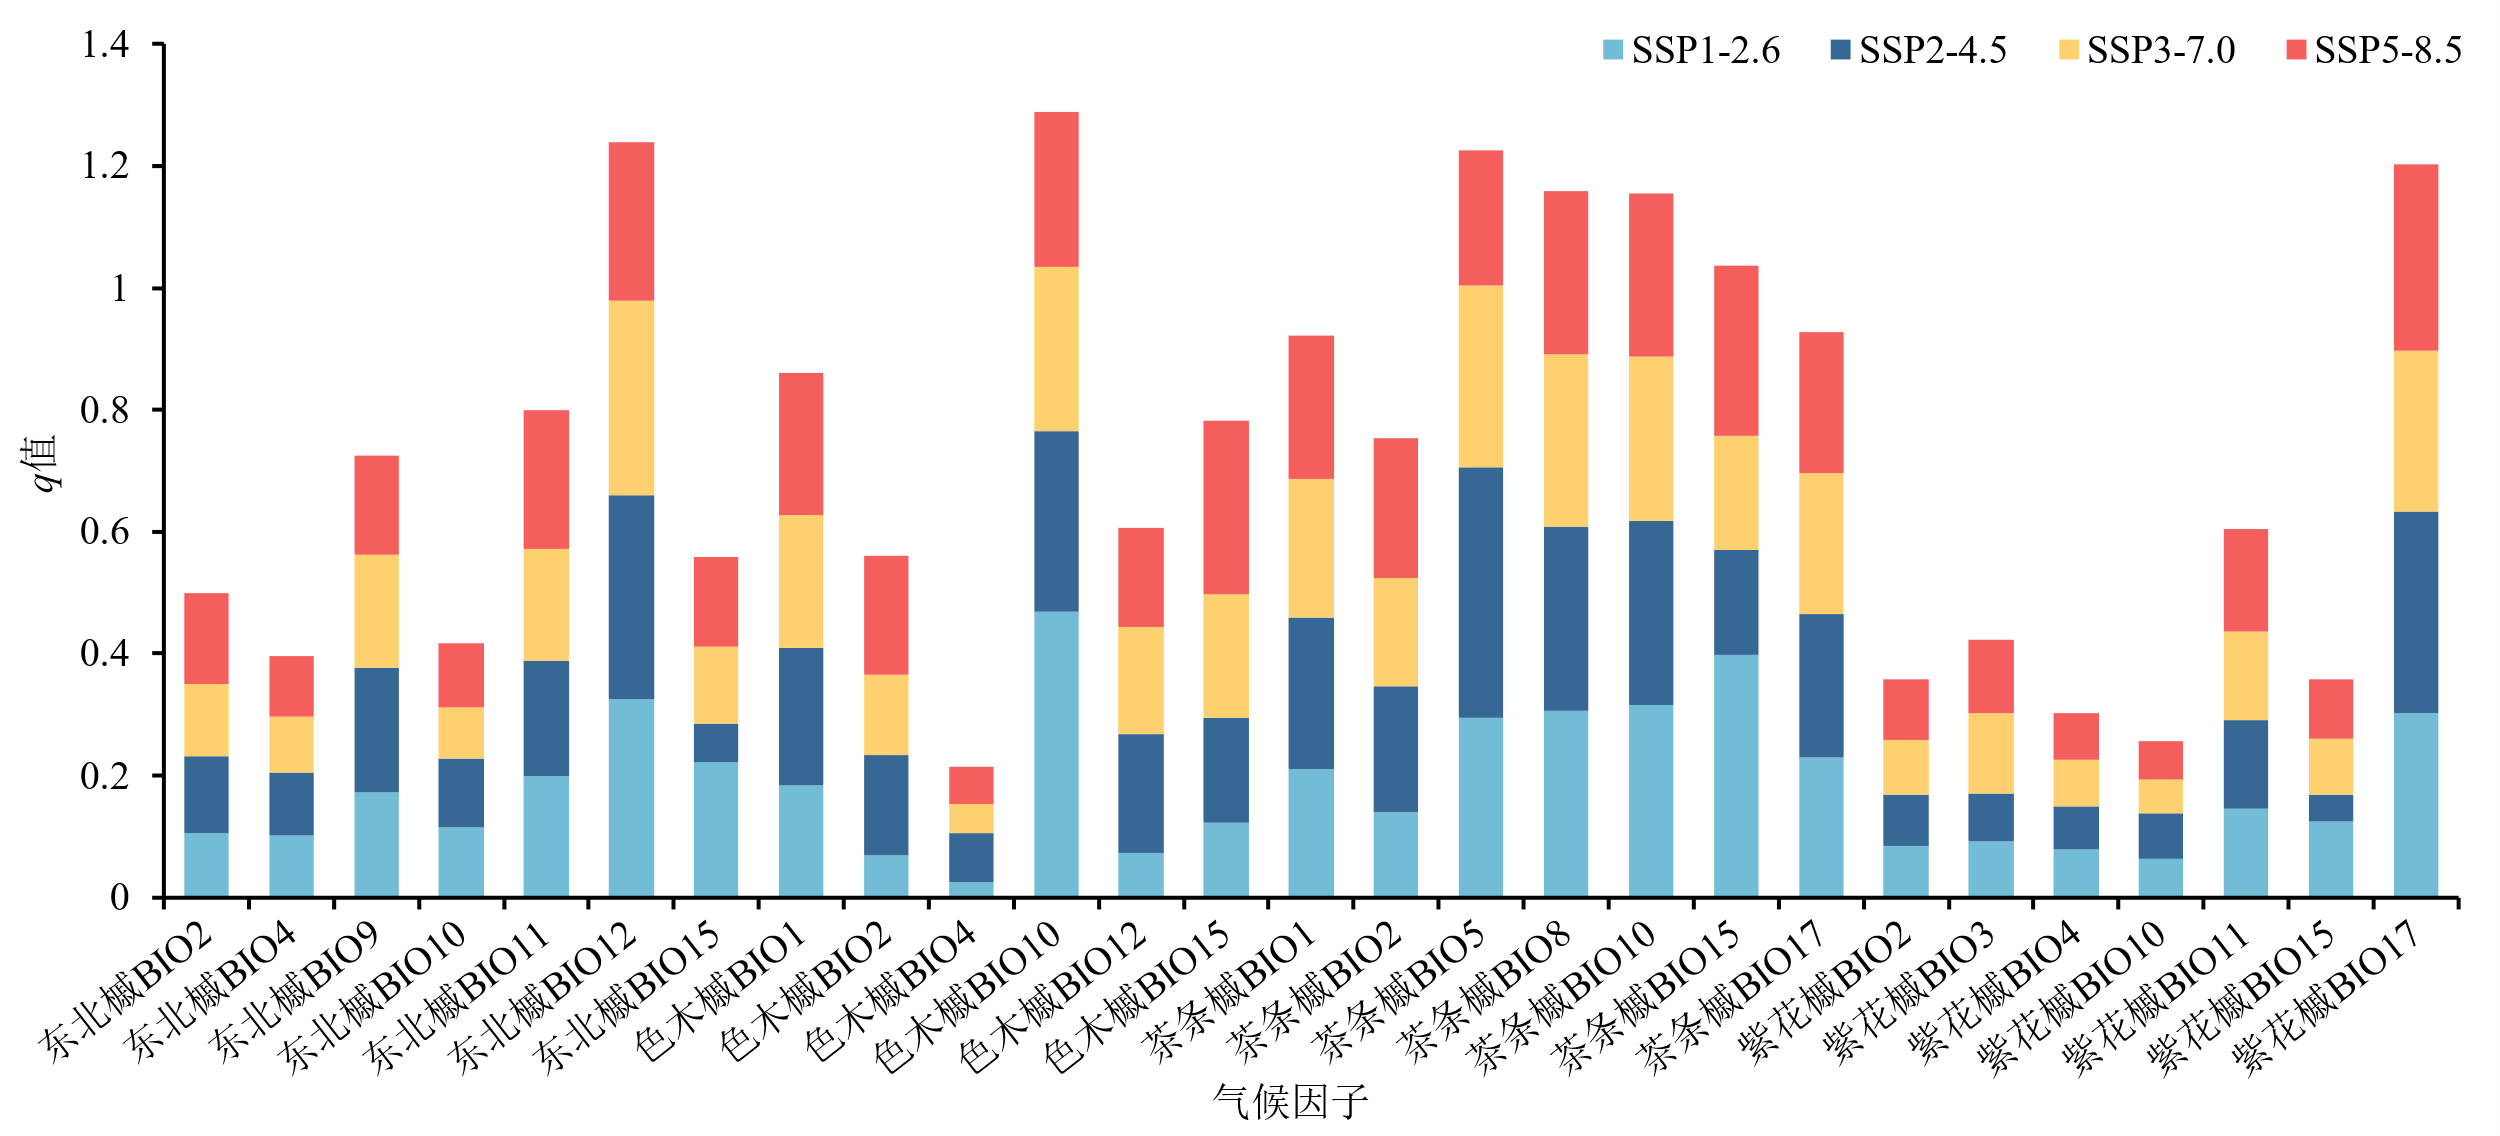
图11 未来情景下气候因子与适生区空间分化之间的相关性
Figure 11 Correlation between climatic factors and spatial differentiation of suitable area under future climate situation
| 槭树 | 气候情景 | 交互因子 | q值 | 交互结果 |
|---|---|---|---|---|
| 东北槭 | SSP1-2.6 | BIO12∩BIO10 | 0.75 | 非线性增强 |
| 东北槭 | SSP2-4.5 | BIO12∩BIO10 | 0.83 | 非线性增强 |
| 东北槭 | SSP3-7.0 | BIO12∩BIO10 | 0.71 | 非线性增强 |
| 东北槭 | SSP5-8.5 | BIO12∩BIO10 | 0.75 | 非线性增强 |
| 色木槭 | SSP1-2.6 | BIO12∩BIO10 | 0.72 | 非线性增强 |
| 色木槭 | SSP2-4.5 | BIO12∩BIO10 | 0.72 | 非线性增强 |
| 色木槭 | SSP3-7.0 | BIO15∩BIO1 | 0.67 | 非线性增强 |
| 色木槭 | SSP5-8.5 | BIO15∩BIO10 | 0.67 | 非线性增强 |
| 茶条槭 | SSP1-2.6 | BIO15∩BIO10 | 0.73 | 非线性增强 |
| 茶条槭 | SSP2-4.5 | BIO5∩BIO2 | 0.72 | 非线性增强 |
| 茶条槭 | SSP3-7.0 | BIO15∩BIO1 | 0.67 | 非线性增强 |
| 茶条槭 | SSP5-8.5 | BIO15∩BIO8 | 0.74 | 非线性增强 |
| 紫花槭 | SSP1-2.6 | BIO17∩BIO10 | 0.71 | 非线性增强 |
| 紫花槭 | SSP2-4.5 | BIO17∩BIO10 | 0.77 | 非线性增强 |
| 紫花槭 | SSP3-7.0 | BIO17∩BIO2 | 0.69 | 非线性增强 |
| 紫花槭 | SSP5-8.5 | BIO17∩BIO11 | 0.71 | 非线性增强 |
表3 未来情景下气候因子交互探测结果
Table 3 Interaction detector results of climate factors under future situation
| 槭树 | 气候情景 | 交互因子 | q值 | 交互结果 |
|---|---|---|---|---|
| 东北槭 | SSP1-2.6 | BIO12∩BIO10 | 0.75 | 非线性增强 |
| 东北槭 | SSP2-4.5 | BIO12∩BIO10 | 0.83 | 非线性增强 |
| 东北槭 | SSP3-7.0 | BIO12∩BIO10 | 0.71 | 非线性增强 |
| 东北槭 | SSP5-8.5 | BIO12∩BIO10 | 0.75 | 非线性增强 |
| 色木槭 | SSP1-2.6 | BIO12∩BIO10 | 0.72 | 非线性增强 |
| 色木槭 | SSP2-4.5 | BIO12∩BIO10 | 0.72 | 非线性增强 |
| 色木槭 | SSP3-7.0 | BIO15∩BIO1 | 0.67 | 非线性增强 |
| 色木槭 | SSP5-8.5 | BIO15∩BIO10 | 0.67 | 非线性增强 |
| 茶条槭 | SSP1-2.6 | BIO15∩BIO10 | 0.73 | 非线性增强 |
| 茶条槭 | SSP2-4.5 | BIO5∩BIO2 | 0.72 | 非线性增强 |
| 茶条槭 | SSP3-7.0 | BIO15∩BIO1 | 0.67 | 非线性增强 |
| 茶条槭 | SSP5-8.5 | BIO15∩BIO8 | 0.74 | 非线性增强 |
| 紫花槭 | SSP1-2.6 | BIO17∩BIO10 | 0.71 | 非线性增强 |
| 紫花槭 | SSP2-4.5 | BIO17∩BIO10 | 0.77 | 非线性增强 |
| 紫花槭 | SSP3-7.0 | BIO17∩BIO2 | 0.69 | 非线性增强 |
| 紫花槭 | SSP5-8.5 | BIO17∩BIO11 | 0.71 | 非线性增强 |
| [1] | BABST F, BOURIAUD O, POULTER B, et al., 2019. Twentieth century redistribution in climatic drivers of global tree growth[J]. Science Advances, 5(1): eaat4313. |
| [2] | CHOI J, LEE S, 2022. Principal bioclimatic variables of ten dominant plant species in Korea wetland using the Maxent model[J]. Ecological Engineering: The Journal of Ecotechnology. 183: 106729. |
| [3] |
CHRISTIAN J I, BASARA J B, HUNT E D, et al., 2021. Global distribution, trends, and drivers of flash drought occurrence[J]. Nature Communications, 12(1): 6330.
DOI PMID |
| [4] | COBOS M E, PETERSON A T, BARVE N, et al., 2019. Kuenm: An R package for detailed development of ecological niche models using Maxent[J]. PeerJ Computer Science, 7: e6281. |
| [5] |
GANTOIS J, 2022. New tree-level temperature response curves document sensitivity of tree growth to high temperatures across a US-wide climatic gradient[J]. Global Change Biology, 28(20): 6002-6020.
DOI PMID |
| [6] | HE Y L, MA J M, CHEN G S, 2023. Potential geographical distribution and its multi-factor analysis of Pinus massoniana in China based on the maxent model[J]. Ecological Indicators, 154: 110790. |
| [7] | HIGGINS S I, CONRADI T, MUHOKO E, 2023. Shifts in vegetation activity of terrestrial ecosystems attributable to climate trends[J]. Nature Geoscience, 16(2): 147-153. |
| [8] | KRAMER-SCHADT S, NIEDBALLA J, PILGRIM J D, et al., 2013. The importance of correcting for sampling bias in MaxEnt species distribution models[J]. Diversity and Distributions, 19(11): 1366-1379. |
| [9] | LAMCHIN M, LEE W K, JEON S W, et al., 2017. Long-term trend and correlation between vegetation greenness and climate variables in Asia based on satellite data[J]. Science of the Total Environment, 618: 1089-1095. |
| [10] | LI J J, FAN G, HE Y, 2020. Predicting the current and future distribution of three Coptis herbs in China under climate change conditions, using the MaxEnt model and chemical analysis[J]. The Science of the Total Environment, 698: 134141. |
| [11] | LIU D T, YANG J B, CHEN S Y, et al., 2022. Potential distribution of threatened maples in China under climate change: Implications for conservation[J]. Global Ecology and Conservation, 40: e02337. |
| [12] | MEROW C, SMITH M J, SILANDER J J, 2013. A practical guide to MaxEnt for modeling species distributions: What it does, and why inputs and settings matter[J]. Ecography, 36(10): 1058-1069. |
| [13] | MOYA W, JACOME G, YOO C K, 2017. Past, current, and future trends of red spiny lobster based on PCA with MaxEnt model in Galapagos Islands Ecuador[J]. Ecology and Evolution, 7(13): 4881-4890. |
| [14] | MURPHY S J, SMITH A, 2021. What can community ecologists learn from species distribution models?[J]. Ecosphere, 12(12): e03864. |
| [15] | PARVEEN S, KAUR S, BAISHYA R, et al., 2022. Predicting the potential suitable habitats of genus Nymphaea in India using MaxEnt modeling[J]. Environmental Monitoring and Assessment, 194(12): 1-17. |
| [16] | PHILLIPS S J, ANDERSON R P, SCHAPIRE R E, 2006. Maximum entropy modeling of species geographic distributions[J]. Ecological Modelling, 190(3-4): 231-259. |
| [17] |
QUETIN G R, ANDEREGG L D L, BOVING I, et al., 2023. Observed forest trait velocities have not kept pace with hydraulic stress from climate change[J]. Global Change Biology, 29(18): 5415-5428.
DOI PMID |
| [18] | REICH P B, SENDALL K M, STEFANSKI A, et al., 2018. Effects of climate warming on photosynthesis in boreal tree species depend on soil moisture[J]. Nature, 562(7726): 263-267. |
| [19] | SANG Y H, REN H L, SHI X L, et al., 2021. Improvement of soil moisture simulation in Eurasia by the Beijing Climate Center climate system model from CMIP5 to CMIP6[J]. Advances in Atmospheric Sciences, 38(2): 237-252. |
| [20] | SILLERO N, ARENAS-CASTRO S, ENRIQUEZ-URZELAI U, et al., 2021. Want to model a species niche? A step-by-step guideline on correlative ecological niche modelling[J]. Ecological Modelling, 456: 109671. |
| [21] | TREVES A, TERENZIANI A, ANGST C, et al., 2022. Predicting habitat suitability for Castor fiber reintroduction: MaxEnt vs SWOT-Spatial multicriteria approach[J]. Ecological Informatics, 72: 101895. |
| [22] |
VALLADARES F, MATESANZ S, GUILHAUMON F, et al., 2014. The effects of phenotypic plasticity and local adaptation on forecasts of species range shifts under climate change[J]. Ecology Letters, 17(11): 1351-1364.
DOI PMID |
| [23] | WARREN D L, GLOR R E, 2010. ENMTools: A toolbox for comparative studies of environmental niche models[J]. Ecogrphy, 33(3): 607-611. |
| [24] | WARREN D L, WRIGHT A N, SEIFERT S N, et al., 2014. Incorporating model complexity and spatial sampling bias into ecological niche models of climate change risks faced by 90 California vertebrate species of concern[J]. Diversity and Distributions, 20(3): 334-343. |
| [25] | WIENS J J, 2016. Climate-related local extinctions are already widespread among plant and animal species[J]. Plos Biology, 14(12): e2001104. |
| [26] | WILLIAMS S E, SHOO L P, ISAAC J L, et al., 2009. Towards an integrated framework for assessing the vulnerability of species to climate change[J]. PLos Biology, 6(12): 2621-2626. |
| [27] | YU L F, LENG G Y, PYTHON A, 2021. Varying response of vegetation to sea ice dynamics over the Arctic[J]. Science of the Total Environment, 799(4): 149378. |
| [28] |
ZHENG L L, GAIRE N P, SHI P L, 2021. High-altitude tree growth responses to climate change across the Hindu Kush Himalaya[J]. Journal of Plant Ecology, 14(5): 829-842.
DOI |
| [29] | ZHENG P F, WANG D D, JIA G D, et al., 2022. Variation in water supply leads to different responses of tree growth to warming[J]. Forest Ecosystems, 9: 100003. |
| [30] | ZHU Y K, ZHANG J T, ZHANG Y Q, et al., 2019. Responses of vegetation to climatic variations in the desert region of northern China[J]. Catena, 175: 27-36. |
| [31] | ZUIDEMA P A, BABST F, GROENENDIJK P, et al., 2022. Tropical tree growth driven by dry season climate variability[J]. Nature Geoscience, 15(4): 269-276. |
| [32] |
郭杰, 刘小平, 张琴, 等, 2017. 基于Maxent模型的党参全球潜在分布区预测[J]. 应用生态学报, 28(3): 992-1000.
DOI |
|
GUO J, LIU X P, ZHANG Q, et al., 2017. Prediction for the potential distribution area of Codonopsis pilosula at global scale based on maxent model[J]. Chinese Journal of Applied Ecology, 28(3): 992-1000.
DOI |
|
| [33] | 李文庆, 徐洲锋, 史鸣明, 等, 2019. 不同气候情景下四子柳的亚洲潜在地理分布格局变化预测[J]. 生态学报, 39(9): 3224-3234. |
| LI W Q, XU Z F, SHI M M, et al., 2019. Prediction of potential geographical distribution patterns of Salix tetrasperma Roxb in Asia under different climate situation[J]. Acta Ecologica Sinica, 39(9): 3224-3234. | |
| [34] | 孟影, 马姜明, 王永琪, 等, 2020. 基于Maxent模型的檵木分布格局模拟[J]. 生态学报, 40(22): 8287-8296. |
| MENG Y, MA J M, WANG Y Q, et al., 2020. Prediction of distribution area of Loropetalum chinese based on maxent model[J]. Acta Ecologica Sinica, 40(22): 8287-8296. | |
| [35] | 彭仲韬, 郭嘉兴, 王艺璇, 等, 2023. 小兴安岭3种槭树不同生长期叶性状变异及相关性分析[J]. 南京林业大学学报(自然科学版), 48(1): 131-139. |
| PENG Z T, GUO J X, WANG Y X, et al., 2023. Variation and correlation analysis of leaf traits of three Acer species in different growth periods in the Xiaoxing’an Mountains of northeast China[J]. Journal of Nanjing Forestry University (Natural Science Edition), 48(1): 131-139. | |
| [36] | 邱浩杰, 孙杰杰, 徐达, 等, 2020. 基于MaxEnt模型预测鹅掌楸在中国的潜在分布区[J]. 浙江农林大学学报, 37(1): 1-8. |
| QIU H J, XU J J, XU D, et al., 2020. MaxEnt model based prediction of potential distribution of Liriodendron chinese in China[J]. Journal of Zhejiang A & F University, 37(1): 1-8. | |
| [37] |
王劲峰, 徐成东, 2017. 地理探测器: 原理与展望[J]. 地理学报, 72(1): 116-134.
DOI |
|
WANG J F, XU C D, 2017. Geodetector: Principle and prospective[J]. Acta Geographica Sinica, 72(1): 116-134.
DOI |
|
| [38] | 魏俊, 朱坤, 陈文德, 等, 2021. 基于Maxent模型的西南地区香果树地理分布预测研究[J]. 中国野生植物资源, 40(8): 86-95. |
| WEI J, ZHU K, CHEN W D, et al., 2021. Prediction of geographical distribution of Emmenopterys henryi in southwest China based on maxent model[J]. Chinese Wild Plant Resources, 40(8): 86-95. | |
| [39] | 谢朋, 徐丹, 于海媛, 等, 2014. 假色槭种子透水性及内源抑制物质的初步研究[J]. 中国农学通报, 30(22): 53-58. |
| XIE P, XU D, YU H Y, et al., 2014. Effects of seed permability and endogenesis inhibitory substances of Acer pseudosieboldanum seeds[J]. Chinese Agricultural Science Bulletin, 30(22): 53-58. | |
| [40] | 徐小琼, 鲁燕云, 朱颖, 等, 2024. 基于最大熵模型的我国黄芩生态适宜性研究[J]. 中国中医药信息杂志, 31(2): 1-5. |
| XU X Q, LU Y Y, ZHU Y, et al., 2024. Study on ecological suitability of Scutellaria baicalensis Georgi in China based on maxent model[J]. Chinese Journal of Information on Traditional Chinese Medicine, 31(2): 1-5. | |
| [41] | 张金峰, 葛树森, 李玉堂, 等, 2022. 长白山9种槭树的翅果扩散及种子萌发研究[J]. 生态学报, 42(4): 1441-1449. |
| ZHANG J F, GE S S, LI Y T, et al., 2022. Dispersal and germination of nine Acer L (Acer, spp) trees in Changbai Mountain area[J]. Acta Oecologica, 42(4): 1441-1449. | |
| [42] | 张军保, 张振全, 沈海龙, 等, 2008. 色木槭种皮透水性与种子浸提液生物效应的研究[J]. 安徽农业科学, 36(20): 8571-8574. |
| ZHANG J B, ZHANG Z Q, SHEN H L, et al., 2008. Water permeability of seed coat and bio-effect of seed extracting solution of Acer mono maxim[J]. Journal of Anhui Agricultural Sciences, 36(20): 8571-8574. | |
| [43] | 赵儒楠, 何倩倩, 褚晓洁, 等, 2019. 气候变化下千金榆在我国潜在分布区预测[J]. 应用生态学报, 30(11): 3833-3843. |
| ZHAO R N, HE Q Q, CHU X J, et al., 2019. Prediction of potential distribution of Carpinus cordata in China under climate change[J]. Chinese Journal of Applied Ecology, 30(11): 3833-3843. |
| [1] | 李霞, 陈永昊, 陈喆, 张国壮, 唐梦雅. 中国沿海地区植被NDVI时空变化及驱动力分析[J]. 生态环境学报, 2024, 33(2): 180-191. |
| [2] | 田成诗, 孙瑞欣. 长江经济带市域生态环境质量空间分异与影响因素分析——基于三生空间的土地利用转型[J]. 生态环境学报, 2023, 32(7): 1173-1184. |
| [3] | 王琳, 卫伟. 黄土高原典型县域生态系统服务变化特征及驱动因素[J]. 生态环境学报, 2023, 32(6): 1140-1148. |
| [4] | 郝蕾, 翟涌光, 戚文超, 兰穹穹. 2001-2020年内蒙古植被碳源/碳汇时空动态及对气候因子的响应[J]. 生态环境学报, 2023, 32(5): 825-834. |
| [5] | 陈俊芳, 吴宪, 刘啸林, 刘娟, 杨佳绒, 刘宇. 不同土壤水分下元素化学计量对微生物多样性的塑造特征[J]. 生态环境学报, 2023, 32(5): 898-909. |
| [6] | 李建辉, 党争, 陈琳. 黄河几字弯都市圈PM2.5时空特征及影响因素分析[J]. 生态环境学报, 2023, 32(4): 697-705. |
| [7] | 李晖, 李必龙, 葛黎黎, 韩琛惠, 杨倩, 张岳军. 2000-2021年汾河流域植被时空演变特征及地形效应[J]. 生态环境学报, 2023, 32(3): 439-449. |
| [8] | 王成武, 罗俊杰, 唐鸿湖. 基于InVEST模型的太行山沿线地区生态系统碳储量时空分异驱动力分析[J]. 生态环境学报, 2023, 32(2): 215-225. |
| [9] | 肖成志, 计扬, 李建忠, 张志, 巴仁基, 曹亚廷. 岷江上游生态脆弱性时空分异及驱动因子交互效应分析——以杂谷脑河流域为例[J]. 生态环境学报, 2023, 32(10): 1760-1770. |
| [10] | 叶深, 王鹏, 黄祎, 折远洋, 丁明军. 长三角城市群城市空间形态对PM2.5与O3污染空间异质性特征的影响研究[J]. 生态环境学报, 2023, 32(10): 1771-1784. |
| [11] | 贾志峰, 刘鹏程, 刘宇, 吴博博, 陈丹姿, 张向飞. 气候变化和人类活动对松辽流域植被覆盖的影响[J]. 生态环境学报, 2023, 32(1): 1-10. |
| [12] | 付蓉, 武新梅, 陈斌. 城市地表温度空间分异及驱动因子差异性分析——以合肥市为例[J]. 生态环境学报, 2023, 32(1): 110-122. |
| [13] | 齐月, 张强, 胡淑娟, 蔡迪花, 赵福年, 陈斐, 张凯, 王鹤龄, 王润元. 黄土高原地区气候变化及其对冬小麦生产潜力的影响[J]. 生态环境学报, 2022, 31(8): 1521-1529. |
| [14] | 邓天乐, 谢立勇, 张凤哲, 赵洪亮, 蒋语童. CO2浓度升高条件下稗草与水稻生长空间竞争关系研究[J]. 生态环境学报, 2022, 31(8): 1566-1572. |
| [15] | 卢燕宇, 孙维, 方砚秋, 唐为安, 邓汗青, 何冬燕. 基于种植结构的安徽省气候生产潜力估算及粮食安全气候承载力分析[J]. 生态环境学报, 2022, 31(7): 1293-1305. |
| 阅读次数 | ||||||
|
全文 |
|
|||||
|
摘要 |
|
|||||