Ecology and Environment ›› 2022, Vol. 31 ›› Issue (10): 2058-2069.DOI: 10.16258/j.cnki.1674-5906.2022.10.014
• Research Articles • Previous Articles Next Articles
CHEN Jinghui1,2( ), GUO Yi3, YANG Bo1,4, QU Chengtun1,4,5
Received:2022-07-23
Online:2022-10-18
Published:2022-12-09
陈景辉1,2(), 郭毅3, 杨博1,4, 屈撑囤1,4,5
作者简介:陈景辉(1985年生),男,讲师,硕士,研究方向为环境污染与修复。E-mail: jhchen@xsyu.edu.cn
基金资助:CLC Number:
CHEN Jinghui, GUO Yi, YANG Bo, QU Chengtun. Pollution Level of Heavy Metals in Soil and Health Risk Assessment in Provincial Capital Cities of China[J]. Ecology and Environment, 2022, 31(10): 2058-2069.
陈景辉, 郭毅, 杨博, 屈撑囤. 省会城市土壤重金属污染水平与健康风险评价[J]. 生态环境学报, 2022, 31(10): 2058-2069.
Add to citation manager EndNote|Ris|BibTeX
URL: https://www.jeesci.com/EN/10.16258/j.cnki.1674-5906.2022.10.014
| 参数含义 Parameter meaning | 符号和单位 Symbols and units | 儿童 Children | 成人 Adults |
|---|---|---|---|
| 每日摄取率 Daily intake rate | Ring/(mg·d-1) | 200 | 100 |
| 暴露频率 Exposure frequency | EF/(d·a-1) | 350 | 350 |
| 暴露时长 Exposure duration | ED/a | 6 | 25 |
| 平均体重 Average body weight | BW/kg | 15.9 | 56.8 |
| 平均时间 Average time | AT/d | 26280 | 26280 |
| 每日吸入率 Daily inhalation rate | Rinh/(m3·d-1) | 7.5 | 14.5 |
| 颗粒物释放因子 Particulate matter release factor | PEF/(m3·kg) | 1.36×10⁹ | 1.36×10⁹ |
| 皮肤暴露面积 Skin exposure area | SA/cm2 | 2800 | 5700 |
| 皮肤粘附因子 Skin adhesion factor | SL/(mg·cm-2) | 0.2 | 0.07 |
| 皮肤吸附因子 Skin adsorption factor | ABF | 0.001 | 0.001 |
Table 1 Health risk assessment exposure parameters
| 参数含义 Parameter meaning | 符号和单位 Symbols and units | 儿童 Children | 成人 Adults |
|---|---|---|---|
| 每日摄取率 Daily intake rate | Ring/(mg·d-1) | 200 | 100 |
| 暴露频率 Exposure frequency | EF/(d·a-1) | 350 | 350 |
| 暴露时长 Exposure duration | ED/a | 6 | 25 |
| 平均体重 Average body weight | BW/kg | 15.9 | 56.8 |
| 平均时间 Average time | AT/d | 26280 | 26280 |
| 每日吸入率 Daily inhalation rate | Rinh/(m3·d-1) | 7.5 | 14.5 |
| 颗粒物释放因子 Particulate matter release factor | PEF/(m3·kg) | 1.36×10⁹ | 1.36×10⁹ |
| 皮肤暴露面积 Skin exposure area | SA/cm2 | 2800 | 5700 |
| 皮肤粘附因子 Skin adhesion factor | SL/(mg·cm-2) | 0.2 | 0.07 |
| 皮肤吸附因子 Skin adsorption factor | ABF | 0.001 | 0.001 |
| 重金属 Heavy metal | 斜率致癌因子 SF/ (kg·d·mg-1) | 参考剂量RfD/(mg·kg-1·d-1) | ||
|---|---|---|---|---|
| 经口摄入ADDing | 呼吸摄入ADD inh | 皮肤摄入ADDdermal | ||
| As | 15.1 | 3.00×10⁻⁴ | 1.23×10⁻⁴ | 1.23×10⁻⁴ |
| Cr | 42 | 3.00×10⁻³ | 2.86×10⁻⁵ | 6.00×10⁻⁵ |
| Cu | — | 4.00×10⁻² | 4.02×10⁻² | 1.20×10⁻² |
| Mn | 15.1 | 4.60×10⁻² | 1.43×10⁻⁵ | 1.84×10⁻³ |
| Ni | 0.84 | 2.00×10⁻² | 2.06×10⁻² | 5.40×10⁻³ |
| Pb | — | 3.50×10⁻³ | 3.52×10⁻³ | 5.25×10⁻⁴ |
| Zn | — | 3.00×10⁻¹ | 3.00×10⁻¹ | 6.00×10⁻² |
| Cd | 6.30 | 1.00×10⁻³ | 1.00×10⁻⁵ | 1.00×10⁻⁵ |
| Hg | — | 3.00×10⁻⁴ | 8.57×10⁻⁵ | 2.10×10⁻⁵ |
Table 2 Reference dose and slope carcinogens of heavy metals in soils exposed to different pathways
| 重金属 Heavy metal | 斜率致癌因子 SF/ (kg·d·mg-1) | 参考剂量RfD/(mg·kg-1·d-1) | ||
|---|---|---|---|---|
| 经口摄入ADDing | 呼吸摄入ADD inh | 皮肤摄入ADDdermal | ||
| As | 15.1 | 3.00×10⁻⁴ | 1.23×10⁻⁴ | 1.23×10⁻⁴ |
| Cr | 42 | 3.00×10⁻³ | 2.86×10⁻⁵ | 6.00×10⁻⁵ |
| Cu | — | 4.00×10⁻² | 4.02×10⁻² | 1.20×10⁻² |
| Mn | 15.1 | 4.60×10⁻² | 1.43×10⁻⁵ | 1.84×10⁻³ |
| Ni | 0.84 | 2.00×10⁻² | 2.06×10⁻² | 5.40×10⁻³ |
| Pb | — | 3.50×10⁻³ | 3.52×10⁻³ | 5.25×10⁻⁴ |
| Zn | — | 3.00×10⁻¹ | 3.00×10⁻¹ | 6.00×10⁻² |
| Cd | 6.30 | 1.00×10⁻³ | 1.00×10⁻⁵ | 1.00×10⁻⁵ |
| Hg | — | 3.00×10⁻⁴ | 8.57×10⁻⁵ | 2.10×10⁻⁵ |
| 城市 City | 发表时间 Published time/a | w/(mg·kg-1) | 参考文献 Reference | |||||||||
|---|---|---|---|---|---|---|---|---|---|---|---|---|
| As | Co | Cr | Cu | Mn | Ni | Pb | Zn | Cd | Hg | |||
| 北京 Beijing | 2020 | 11.97 | — | 63.57 | 35.49 | — | 27.12 | 36.43 | 145.68 | 0.49 | 0.87 | 刘玲玲, |
| 上海 Shanghai | 2017 | — | — | 128.00 | 55.00 | 719.00 | 56.00 | 119.00 | 229.00 | 0.33 | — | 2017 |
| 天津 Tianjin | 2021 | 11.00 | — | 81.00 | 45.00 | — | 33.00 | 44.00 | 148.00 | 0.39 | 0.18 | 2021 |
| 重庆 Chongqing | 2021 | — | — | 86.77 | 24.87 | — | 33.19 | 28.89 | 126.02 | 0.28 | 0.08 | 2021 |
| 哈尔滨 Harbin | 2017 | 8.87 | — | 61.28 | 22.33 | — | 25.73 | 26.74 | 72.03 | 0.17 | 0.08 | 2017 |
| 长春 Changchun | 2021 | 28.63 | — | 124.75 | 22.19 | — | 23.19 | 33.34 | 48.33 | 0.11 | — | 王天欣, |
| 沈阳 Shenyang | 2020 | 8.09 | — | 67.30 | 44.80 | — | 38.10 | 59.14 | 206.60 | 0.49 | — | 2020 |
| 石家庄 Shijiazhuang | 2019 | 9.42 | — | 71.85 | 27.39 | — | 28.20 | 31.00 | 104.48 | 0.28 | 0.11 | 柴立立等, |
| 兰州 Lanzhou | 2019 | 13.62 | 59.14 | 60.86 | 41.12 | — | 37.47 | 36.49 | 108.25 | — | — | 李春艳, |
| 西宁 Xining | 2016 | 7.70 | 17.18 | 200.73 | 20.85 | — | — | 34.85 | 48.60 | — | — | 2016 |
| 西安 Xi’an | 2018 | 12.20 | 18.00 | 70.80 | 36.20 | 643.00 | 32.50 | 48.00 | 129.70 | — | — | 2018 |
| 郑州 Zhengzhou | 2021 | — | 8.84 | 63.40 | 21.67 | 461.03 | 26.82 | 48.19 | 80.04 | 0.31 | 0.15 | 2021 |
| 济南 Ji’nan | 2020 | 11.93 | — | 71.87 | 26.08 | — | 32.18 | — | 72.08 | 0.20 | 0.05 | 2020 |
| 太原 Taiyuan | 2020 | 11.46 | 8.11 | 42.17 | 16.47 | 403.85 | 20.18 | 20.95 | 40.26 | 0.13 | — | 2020 |
| 合肥 Hefei | 2021 | 23.91 | — | 59.92 | 26.62 | 457.88 | 34.06 | 17.93 | 115.17 | 0.10 | — | 2021 |
| 武汉 Wuhan | 2018 | 13.00 | — | 87.80 | 35.60 | — | 35.00 | 37.00 | 109.00 | 0.30 | 0.11 | 2018 |
| 长沙 Changsha | 2021 | 15.31 | 14.40 | 134.09 | 27.58 | — | 14.87 | 56.03 | 149.47 | 1.24 | — | 2021 |
| 南京 Nanjing | 2021 | — | 87.29 | 36.89 | — | 46.30 | 80.37 | 0.62 | 2021 | |||
| 成都 Chengdu | 2021 | — | — | 71.78 | 29.10 | — | — | 20.45 | 198.47 | 0.53 | 2021 | |
| 贵阳 Guiyang | 2012 | — | — | - | 66.10 | — | — | 79.50 | 243.00 | 0.98 | 2012 | |
| 昆明 Kunming | 2022 | 9.72 | — | 51.09 | 249.03 | 1160.15 | 43.00 | 62.27 | 381.79 | 1.10 | 2022 | |
| 杭州 Hangzhou | 2020 | 13.78 | — | 47.94 | 39.96 | — | 44.20 | 48.70 | 96.09 | 0.19 | 0.42 | 2020 |
| 南昌 Nanchang | 2019 | — | — | — | 27.48 | — | — | 60.92 | 156.16 | 0.20 | — | 2019 |
| 广州 Guangzhou | 2021 | 16.07 | — | 62.21 | 25.42 | — | 19.92 | 57.19 | 140.21 | 0.30 | 0.25 | 2021 |
| 福州 Fuzhou | 2017 | 16.00 | — | 21.30 | 45.50 | — | — | 55.00 | 147.00 | 0.60 | — | 2017 |
| 海口 Haikou | 2016 | 2.65 | — | 59.25 | 19.82 | — | 53.22 | 21.73 | 55.31 | 0.23 | 0.16 | 2016 |
| 乌鲁木齐 Urumqi | 2008 | — | — | — | 47.30 | — | — | 50.90 | 152.00 | 0.58 | — | 2008 |
| 呼和浩特 Huhhot | 2022 | 6.38 | — | 103.63 | 26.04 | 888.40 | 28.33 | 39.05 | 115.84 | 0.20 | — | 2022 |
| 银川 Yinchuan | 2020 | 11.90 | — | 60.26 | 21.17 | 25.66 | 22.78 | 55.48 | 0.15 | 0.04 | 2020 | |
| 南宁 Nanning | 2020 | 7.05 | — | 46.00 | 45.60 | — | 18.00 | 65.60 | 105.00 | 0.77 | 0.37 | 2020 |
| 拉萨 Lhasa | 2022 | 25.64 | — | 35.90 | 20.25 | — | 17.35 | 22.70 | 66.07 | 0.10 | 0.07 | 2022 |
| 香港 Hong Kong | 1997 | — | — | — | 17.10 | — | — | 56.90 | 55.20 | 1.04 | — | 1997 |
| 澳门 Macao | 2021 | 4.09 | 3.84 | 24.00 | 16.60 | — | 9.56 | 72.50 | 73.70 | 0.13 | 0.07 | 2021 |
| 最大值 Maximum | — | 28.63 | 59.14 | 200.73 | 249.03 | 1160.15 | 56.00 | 119.00 | 381.79 | 1.24 | 0.87 | — |
| 最小值 Minimum | — | 2.65 | 3.84 | 21.30 | 16.47 | 403.85 | 9.56 | 17.93 | 40.26 | 0.10 | 0.04 | — |
| 平均值 Average value | — | 12.52 | 18.50 | 74.03 | 38.26 | 676.19 | 30.27 | 45.64 | 122.86 | 0.42 | 0.20 | — |
| 标准偏差 Standard deviation | — | 5.34 | 8.08 | 34.33 | 39.70 | 118.63 | 9.74 | 20.83 | 70.30 | 0.31 | 0.14 | — |
| 变异系数 Coefficient of variation | — | 0.43 | 0.44 | 0.46 | 1.04 | 0.18 | 0.32 | 0.46 | 0.57 | 0.73 | 0.70 | — |
| 中位值 Median value | — | 12.52 | 18.50 | 70.80 | 27.48 | 676.19 | 30.27 | 45.64 | 109.00 | 0.31 | 0.20 | |
| 中国土壤背景值Background values of soil elements in China | — | 11.20 | 10.60 | 61.00 | 22.60 | 583.00 | 26.90 | 26.00 | 74.20 | 0.10 | 0.07 | 1990 |
| 全球背景值 Global background value | — | 11.40 | — | 70.90 | 28.20 | — | 17.80 | 28.40 | 67.80 | 0.49 | 0.06 | Xiao et al., |
Table 3 Content of heavy metals in soils of provincial capitals in China
| 城市 City | 发表时间 Published time/a | w/(mg·kg-1) | 参考文献 Reference | |||||||||
|---|---|---|---|---|---|---|---|---|---|---|---|---|
| As | Co | Cr | Cu | Mn | Ni | Pb | Zn | Cd | Hg | |||
| 北京 Beijing | 2020 | 11.97 | — | 63.57 | 35.49 | — | 27.12 | 36.43 | 145.68 | 0.49 | 0.87 | 刘玲玲, |
| 上海 Shanghai | 2017 | — | — | 128.00 | 55.00 | 719.00 | 56.00 | 119.00 | 229.00 | 0.33 | — | 2017 |
| 天津 Tianjin | 2021 | 11.00 | — | 81.00 | 45.00 | — | 33.00 | 44.00 | 148.00 | 0.39 | 0.18 | 2021 |
| 重庆 Chongqing | 2021 | — | — | 86.77 | 24.87 | — | 33.19 | 28.89 | 126.02 | 0.28 | 0.08 | 2021 |
| 哈尔滨 Harbin | 2017 | 8.87 | — | 61.28 | 22.33 | — | 25.73 | 26.74 | 72.03 | 0.17 | 0.08 | 2017 |
| 长春 Changchun | 2021 | 28.63 | — | 124.75 | 22.19 | — | 23.19 | 33.34 | 48.33 | 0.11 | — | 王天欣, |
| 沈阳 Shenyang | 2020 | 8.09 | — | 67.30 | 44.80 | — | 38.10 | 59.14 | 206.60 | 0.49 | — | 2020 |
| 石家庄 Shijiazhuang | 2019 | 9.42 | — | 71.85 | 27.39 | — | 28.20 | 31.00 | 104.48 | 0.28 | 0.11 | 柴立立等, |
| 兰州 Lanzhou | 2019 | 13.62 | 59.14 | 60.86 | 41.12 | — | 37.47 | 36.49 | 108.25 | — | — | 李春艳, |
| 西宁 Xining | 2016 | 7.70 | 17.18 | 200.73 | 20.85 | — | — | 34.85 | 48.60 | — | — | 2016 |
| 西安 Xi’an | 2018 | 12.20 | 18.00 | 70.80 | 36.20 | 643.00 | 32.50 | 48.00 | 129.70 | — | — | 2018 |
| 郑州 Zhengzhou | 2021 | — | 8.84 | 63.40 | 21.67 | 461.03 | 26.82 | 48.19 | 80.04 | 0.31 | 0.15 | 2021 |
| 济南 Ji’nan | 2020 | 11.93 | — | 71.87 | 26.08 | — | 32.18 | — | 72.08 | 0.20 | 0.05 | 2020 |
| 太原 Taiyuan | 2020 | 11.46 | 8.11 | 42.17 | 16.47 | 403.85 | 20.18 | 20.95 | 40.26 | 0.13 | — | 2020 |
| 合肥 Hefei | 2021 | 23.91 | — | 59.92 | 26.62 | 457.88 | 34.06 | 17.93 | 115.17 | 0.10 | — | 2021 |
| 武汉 Wuhan | 2018 | 13.00 | — | 87.80 | 35.60 | — | 35.00 | 37.00 | 109.00 | 0.30 | 0.11 | 2018 |
| 长沙 Changsha | 2021 | 15.31 | 14.40 | 134.09 | 27.58 | — | 14.87 | 56.03 | 149.47 | 1.24 | — | 2021 |
| 南京 Nanjing | 2021 | — | 87.29 | 36.89 | — | 46.30 | 80.37 | 0.62 | 2021 | |||
| 成都 Chengdu | 2021 | — | — | 71.78 | 29.10 | — | — | 20.45 | 198.47 | 0.53 | 2021 | |
| 贵阳 Guiyang | 2012 | — | — | - | 66.10 | — | — | 79.50 | 243.00 | 0.98 | 2012 | |
| 昆明 Kunming | 2022 | 9.72 | — | 51.09 | 249.03 | 1160.15 | 43.00 | 62.27 | 381.79 | 1.10 | 2022 | |
| 杭州 Hangzhou | 2020 | 13.78 | — | 47.94 | 39.96 | — | 44.20 | 48.70 | 96.09 | 0.19 | 0.42 | 2020 |
| 南昌 Nanchang | 2019 | — | — | — | 27.48 | — | — | 60.92 | 156.16 | 0.20 | — | 2019 |
| 广州 Guangzhou | 2021 | 16.07 | — | 62.21 | 25.42 | — | 19.92 | 57.19 | 140.21 | 0.30 | 0.25 | 2021 |
| 福州 Fuzhou | 2017 | 16.00 | — | 21.30 | 45.50 | — | — | 55.00 | 147.00 | 0.60 | — | 2017 |
| 海口 Haikou | 2016 | 2.65 | — | 59.25 | 19.82 | — | 53.22 | 21.73 | 55.31 | 0.23 | 0.16 | 2016 |
| 乌鲁木齐 Urumqi | 2008 | — | — | — | 47.30 | — | — | 50.90 | 152.00 | 0.58 | — | 2008 |
| 呼和浩特 Huhhot | 2022 | 6.38 | — | 103.63 | 26.04 | 888.40 | 28.33 | 39.05 | 115.84 | 0.20 | — | 2022 |
| 银川 Yinchuan | 2020 | 11.90 | — | 60.26 | 21.17 | 25.66 | 22.78 | 55.48 | 0.15 | 0.04 | 2020 | |
| 南宁 Nanning | 2020 | 7.05 | — | 46.00 | 45.60 | — | 18.00 | 65.60 | 105.00 | 0.77 | 0.37 | 2020 |
| 拉萨 Lhasa | 2022 | 25.64 | — | 35.90 | 20.25 | — | 17.35 | 22.70 | 66.07 | 0.10 | 0.07 | 2022 |
| 香港 Hong Kong | 1997 | — | — | — | 17.10 | — | — | 56.90 | 55.20 | 1.04 | — | 1997 |
| 澳门 Macao | 2021 | 4.09 | 3.84 | 24.00 | 16.60 | — | 9.56 | 72.50 | 73.70 | 0.13 | 0.07 | 2021 |
| 最大值 Maximum | — | 28.63 | 59.14 | 200.73 | 249.03 | 1160.15 | 56.00 | 119.00 | 381.79 | 1.24 | 0.87 | — |
| 最小值 Minimum | — | 2.65 | 3.84 | 21.30 | 16.47 | 403.85 | 9.56 | 17.93 | 40.26 | 0.10 | 0.04 | — |
| 平均值 Average value | — | 12.52 | 18.50 | 74.03 | 38.26 | 676.19 | 30.27 | 45.64 | 122.86 | 0.42 | 0.20 | — |
| 标准偏差 Standard deviation | — | 5.34 | 8.08 | 34.33 | 39.70 | 118.63 | 9.74 | 20.83 | 70.30 | 0.31 | 0.14 | — |
| 变异系数 Coefficient of variation | — | 0.43 | 0.44 | 0.46 | 1.04 | 0.18 | 0.32 | 0.46 | 0.57 | 0.73 | 0.70 | — |
| 中位值 Median value | — | 12.52 | 18.50 | 70.80 | 27.48 | 676.19 | 30.27 | 45.64 | 109.00 | 0.31 | 0.20 | |
| 中国土壤背景值Background values of soil elements in China | — | 11.20 | 10.60 | 61.00 | 22.60 | 583.00 | 26.90 | 26.00 | 74.20 | 0.10 | 0.07 | 1990 |
| 全球背景值 Global background value | — | 11.40 | — | 70.90 | 28.20 | — | 17.80 | 28.40 | 67.80 | 0.49 | 0.06 | Xiao et al., |
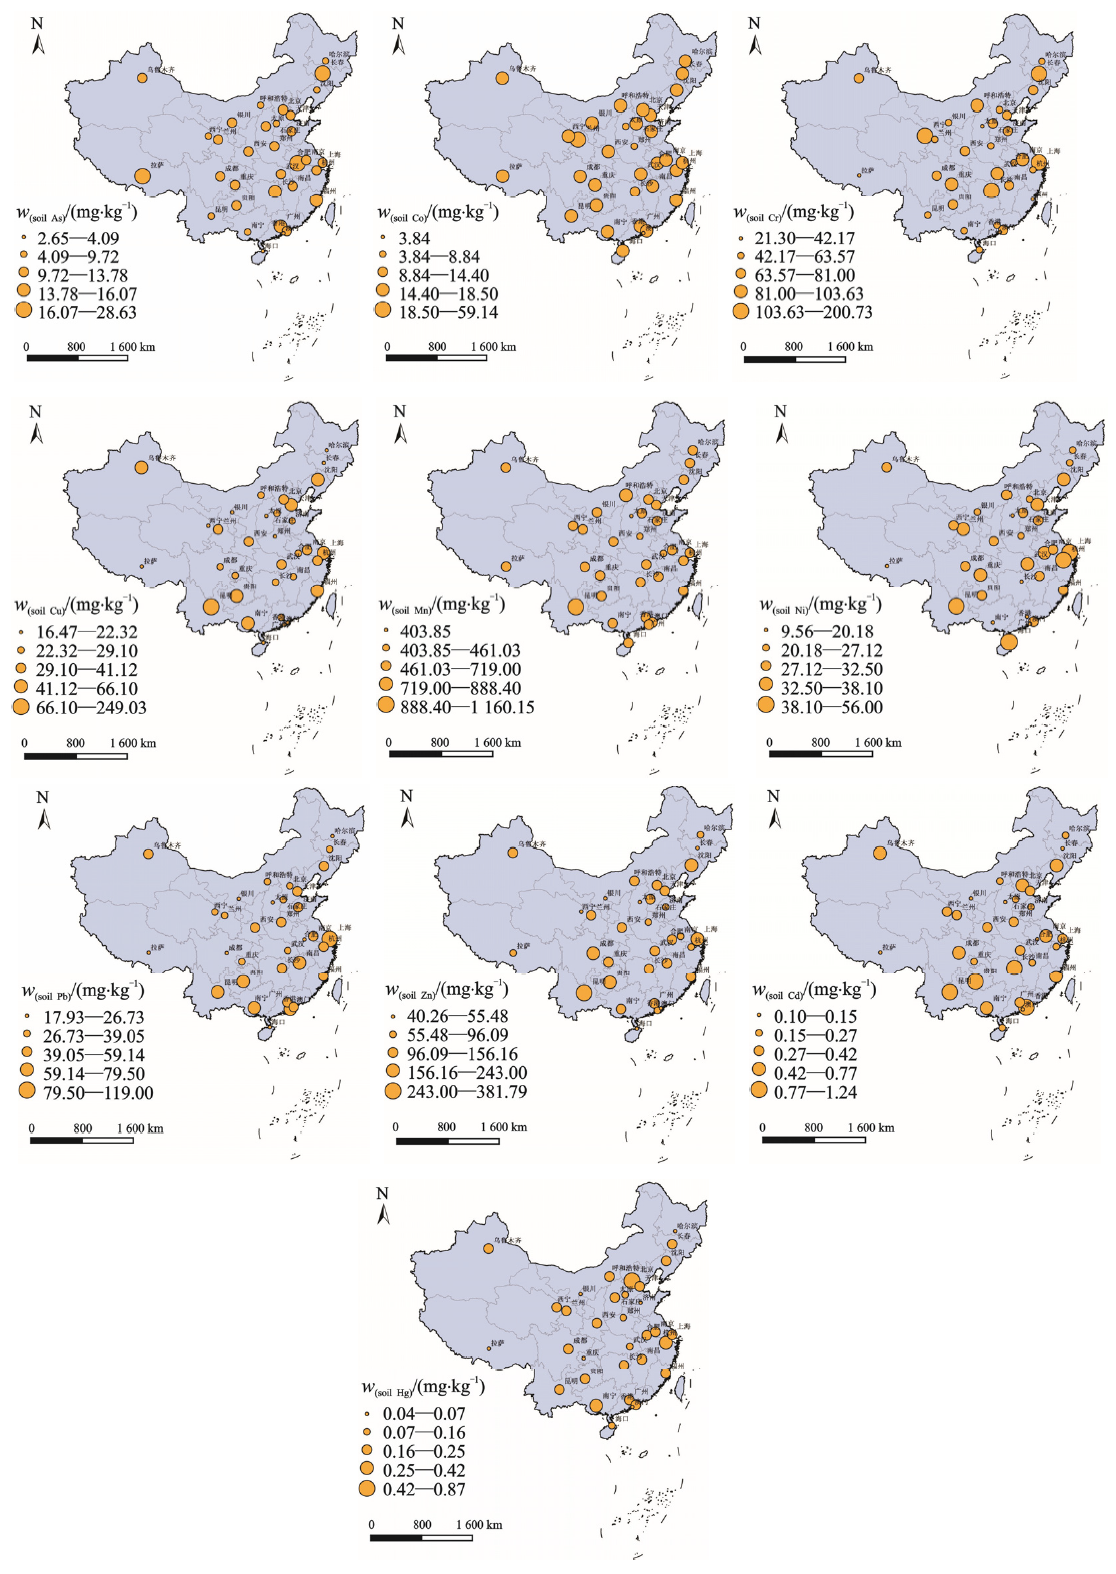
Figure 1 Spatial distribution characteristics of heavy metals in soils of provincial capitals in China Drawing No.: GS (2016) No. 2556
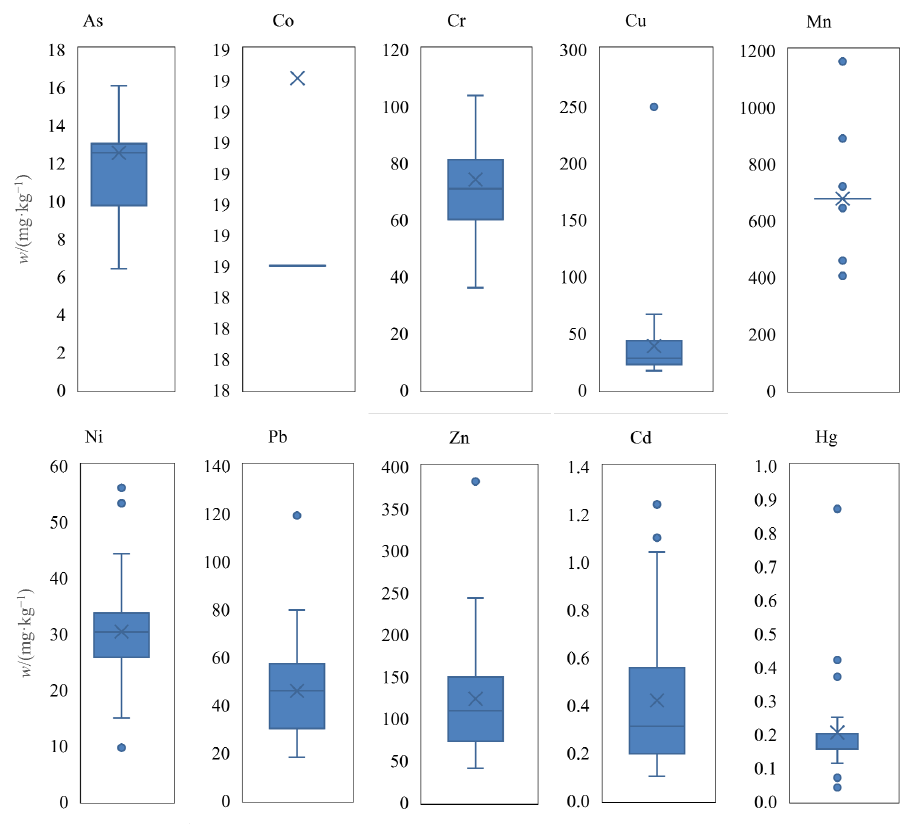
Figure 2 Box diagram of heavy metal content in soils of provincial capital cities
| 城市 (国家) City (Country) | 发表时间 Published time | w/(mg·kg-1) | 参考文献 Reference | ||||
|---|---|---|---|---|---|---|---|
| As | Cu | Pb | Zn | Cd | |||
| Tucson (美国) | 2015 | 96.70 | — | 145.00 | — | 5.33 | 2015 |
| Karabash (俄罗斯) | 2013 | 285.00 | 2669.00 | 620.00 | 1216.00 | 7.75 | 2013 |
| Prescot (英国) | 2008 | 77.30 | 661.00 | 565.00 | 144.00 | 22.00 | 2008 |
| Sudbury (加拿大) | 2002 | — | 557.00 | 33.00 | 63.00 | 2.80 | 2002 |
| Kembla (澳大利亚) | 2004 | 4.10 | 76.00 | 29.00 | 63.00 | — | 2004 |
| Huelva (西班牙) | 2007 | 14.00 | 110.00 | 45.00 | 100.00 | — | 2007 |
| Glogow (波兰) | 2001 | — | 297.00 | 111.00 | 47.50 | — | 2001 |
| Baia Mare (罗马尼亚) | 2017 | 87.90 | 248.00 | 864.00 | 394.00 | — | 2017 |
| Kerman (伊朗) | 2019 | 23.80 | 92.00 | 13.70 | 55.00 | 0.30 | 2019 |
| Puchuncaví (智利) | 2014 | 45.10 | 571.00 | 84.40 | 165.00 | 1.00 | 2014 |
| 省会城市均值 (中国) | 2022 | 12.52 | 38.26 | 45.64 | 122.86 | 0.42 | 本研究 This study |
| 最小值 Minimum | — | 4.10 | 38.26 | 13.70 | 47.50 | 0.30 | — |
| 最大值 Maximum | — | 285.00 | 2669.00 | 864.00 | 1216.00 | 22.00 | — |
| 平均值 Average value | — | 71.82 | 531.93 | 232.34 | 237.04 | 5.66 | — |
| 中位值 Median value | — | 45.10 | 272.50 | 84.40 | 111.43 | 2.80 | — |
| 标准偏差 Standard deviation | — | 87.19 | 784.92 | 300.50 | 358.75 | 7.72 | — |
| 变异系数 Coefficient of variation | — | 1.21 | 1.48 | 1.29 | 1.51 | 1.36 | — |
| 上地壳元素质量分数 Element content of upper crust | — | 5.70 | 27.00 | 25.00 | 75.00 | 0.06 | Xiao et al., |
| 全球背景值 Global background value | — | 11.40 | 28.20 | 28.40 | 67.80 | 0.06 | Xiao et al., |
Table 4 Contents of heavy metals in soils of some cities at home and abroad
| 城市 (国家) City (Country) | 发表时间 Published time | w/(mg·kg-1) | 参考文献 Reference | ||||
|---|---|---|---|---|---|---|---|
| As | Cu | Pb | Zn | Cd | |||
| Tucson (美国) | 2015 | 96.70 | — | 145.00 | — | 5.33 | 2015 |
| Karabash (俄罗斯) | 2013 | 285.00 | 2669.00 | 620.00 | 1216.00 | 7.75 | 2013 |
| Prescot (英国) | 2008 | 77.30 | 661.00 | 565.00 | 144.00 | 22.00 | 2008 |
| Sudbury (加拿大) | 2002 | — | 557.00 | 33.00 | 63.00 | 2.80 | 2002 |
| Kembla (澳大利亚) | 2004 | 4.10 | 76.00 | 29.00 | 63.00 | — | 2004 |
| Huelva (西班牙) | 2007 | 14.00 | 110.00 | 45.00 | 100.00 | — | 2007 |
| Glogow (波兰) | 2001 | — | 297.00 | 111.00 | 47.50 | — | 2001 |
| Baia Mare (罗马尼亚) | 2017 | 87.90 | 248.00 | 864.00 | 394.00 | — | 2017 |
| Kerman (伊朗) | 2019 | 23.80 | 92.00 | 13.70 | 55.00 | 0.30 | 2019 |
| Puchuncaví (智利) | 2014 | 45.10 | 571.00 | 84.40 | 165.00 | 1.00 | 2014 |
| 省会城市均值 (中国) | 2022 | 12.52 | 38.26 | 45.64 | 122.86 | 0.42 | 本研究 This study |
| 最小值 Minimum | — | 4.10 | 38.26 | 13.70 | 47.50 | 0.30 | — |
| 最大值 Maximum | — | 285.00 | 2669.00 | 864.00 | 1216.00 | 22.00 | — |
| 平均值 Average value | — | 71.82 | 531.93 | 232.34 | 237.04 | 5.66 | — |
| 中位值 Median value | — | 45.10 | 272.50 | 84.40 | 111.43 | 2.80 | — |
| 标准偏差 Standard deviation | — | 87.19 | 784.92 | 300.50 | 358.75 | 7.72 | — |
| 变异系数 Coefficient of variation | — | 1.21 | 1.48 | 1.29 | 1.51 | 1.36 | — |
| 上地壳元素质量分数 Element content of upper crust | — | 5.70 | 27.00 | 25.00 | 75.00 | 0.06 | Xiao et al., |
| 全球背景值 Global background value | — | 11.40 | 28.20 | 28.40 | 67.80 | 0.06 | Xiao et al., |
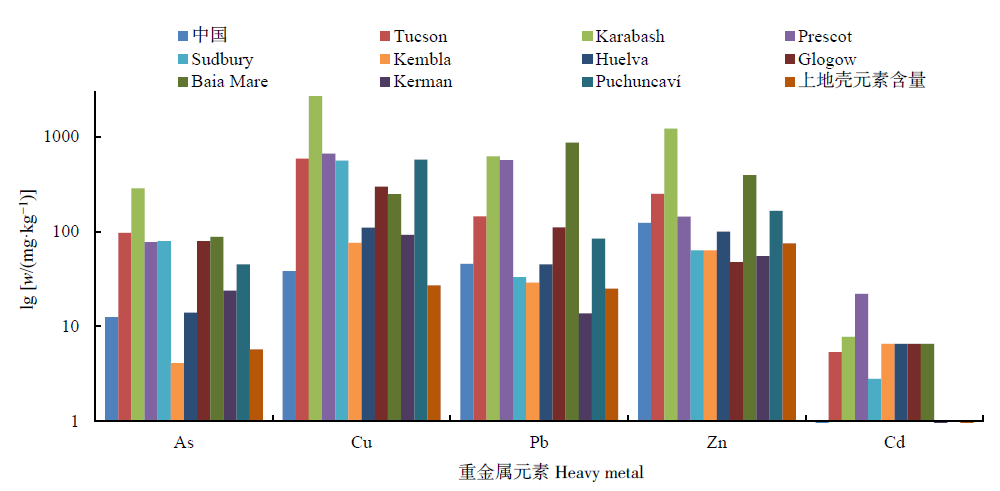
Figure 3 Comparison of heavy metal mass fraction (logarithm) in urban soil
| 暴露人群 Exposed population | 摄入方式 Ingestion mode | As | Cr | Cu | Mn | Ni | Pb | Zn | Cd | Hg |
|---|---|---|---|---|---|---|---|---|---|---|
| 儿童 Children | 手口摄入 ADDing | 1.25×10⁻⁵ | 7.44×10⁻⁵ | 3.84×10⁻⁵ | 6.79×10⁻⁴ | 3.04×10⁻⁵ | 4.58×10⁻⁵ | 1.23×10⁻⁴ | 4.20×10⁻⁷ | 2.04×10⁻⁷ |
| 呼吸摄入 ADD inh | 3.46×10⁻¹⁶ | 2.05×10⁻¹⁵ | 1.06×10⁻¹⁵ | 1.87×10⁻¹⁴ | 8.39×10⁻¹⁶ | 1.26×10⁻¹⁵ | 3.40×10⁻¹⁵ | 1.15×10⁻¹⁷ | 5.65×10⁻¹⁸ | |
| 皮肤摄入 ADDdermal | 3.52×10⁻⁸ | 2.08×10⁻⁷ | 1.07×10⁻⁷ | 1.90×10⁻⁶ | 8.51×10⁻⁸ | 1.28×10⁻⁷ | 3.45×10⁻⁷ | 1.17×10⁻⁹ | 5.73×10⁻¹⁰ | |
| 成人 Adult | 手口摄入 ADDing | 7.33×10⁻⁶ | 4.33×10⁻⁵ | 2.24×10⁻⁵ | 3.96×10⁻⁴ | 1.77×10⁻⁵ | 2.67×10⁻⁵ | 7.20×10⁻⁵ | 2.45×10⁻⁷ | 1.19×10⁻⁷ |
| 呼吸摄入 ADD inh | 7.82×10⁻¹⁶ | 4.62×10⁻¹⁵ | 2.39×10⁻¹⁵ | 4.22×10⁻¹⁴ | 1.89×10⁻¹⁵ | 2.85×10⁻¹⁵ | 7.67×10⁻¹⁵ | 2.61×10⁻¹⁷ | 1.27×10⁻¹⁷ | |
| 皮肤摄入 ADDdermal | 2.92×10⁻⁸ | 1.73×10⁻⁷ | 8.94×10⁻⁸ | 1.58×10⁻⁶ | 7.08×10⁻⁸ | 1.06×10⁻⁷ | 2.87×10⁻⁷ | 9.77×10⁻¹⁰ | 4.76×10⁻¹⁰ |
Table 5 Exposure dose of heavy metals in soil by different exposure routes mg·kg-1·d-1
| 暴露人群 Exposed population | 摄入方式 Ingestion mode | As | Cr | Cu | Mn | Ni | Pb | Zn | Cd | Hg |
|---|---|---|---|---|---|---|---|---|---|---|
| 儿童 Children | 手口摄入 ADDing | 1.25×10⁻⁵ | 7.44×10⁻⁵ | 3.84×10⁻⁵ | 6.79×10⁻⁴ | 3.04×10⁻⁵ | 4.58×10⁻⁵ | 1.23×10⁻⁴ | 4.20×10⁻⁷ | 2.04×10⁻⁷ |
| 呼吸摄入 ADD inh | 3.46×10⁻¹⁶ | 2.05×10⁻¹⁵ | 1.06×10⁻¹⁵ | 1.87×10⁻¹⁴ | 8.39×10⁻¹⁶ | 1.26×10⁻¹⁵ | 3.40×10⁻¹⁵ | 1.15×10⁻¹⁷ | 5.65×10⁻¹⁸ | |
| 皮肤摄入 ADDdermal | 3.52×10⁻⁸ | 2.08×10⁻⁷ | 1.07×10⁻⁷ | 1.90×10⁻⁶ | 8.51×10⁻⁸ | 1.28×10⁻⁷ | 3.45×10⁻⁷ | 1.17×10⁻⁹ | 5.73×10⁻¹⁰ | |
| 成人 Adult | 手口摄入 ADDing | 7.33×10⁻⁶ | 4.33×10⁻⁵ | 2.24×10⁻⁵ | 3.96×10⁻⁴ | 1.77×10⁻⁵ | 2.67×10⁻⁵ | 7.20×10⁻⁵ | 2.45×10⁻⁷ | 1.19×10⁻⁷ |
| 呼吸摄入 ADD inh | 7.82×10⁻¹⁶ | 4.62×10⁻¹⁵ | 2.39×10⁻¹⁵ | 4.22×10⁻¹⁴ | 1.89×10⁻¹⁵ | 2.85×10⁻¹⁵ | 7.67×10⁻¹⁵ | 2.61×10⁻¹⁷ | 1.27×10⁻¹⁷ | |
| 皮肤摄入 ADDdermal | 2.92×10⁻⁸ | 1.73×10⁻⁷ | 8.94×10⁻⁸ | 1.58×10⁻⁶ | 7.08×10⁻⁸ | 1.06×10⁻⁷ | 2.87×10⁻⁷ | 9.77×10⁻¹⁰ | 4.76×10⁻¹⁰ |
| 指数 Index | 暴露人群 Exposed population | 摄入方式 Ingestion mode | As | Cr | Cu | Mn | Ni | Pb | Zn | Cd | Hg |
|---|---|---|---|---|---|---|---|---|---|---|---|
| 非致癌风险 指数HQ | 儿童 Children | 手口摄入 ADDing | 4.19×10⁻² | 2.48×10⁻² | 9.61×10⁻⁴ | 1.47×10⁻² | 1.52×10⁻³ | 1.31×10⁻² | 4.11×10⁻⁴ | 4.20×10⁻⁴ | 6.83×10⁻⁴ |
| 呼吸摄入 ADD inh | 2.82×10⁻¹² | 7.17×10⁻¹¹ | 2.63×10⁻¹⁴ | 1.31×10⁻⁹ | 4.07×10⁻¹⁴ | 3.59×10⁻¹³ | 1.13×10⁻¹⁴ | 1.15×10⁻¹² | 6.59×10⁻¹⁴ | ||
| 皮肤摄入 ADDdermal | 2.86×10⁻⁴ | 3.47×10⁻³ | 8.97×10⁻⁶ | 1.03×10⁻³ | 1.57×10⁻⁵ | 2.44×10⁻⁴ | 5.76×10⁻⁶ | 1.17×10⁻⁴ | 2.73×10⁻⁵ | ||
| 成人 Adult | 手足摄入 ADDing | 2.44×10⁻² | 1.44×10⁻² | 5.60×10⁻⁴ | 8.61×10⁻³ | 8.87×10⁻⁴ | 7.64×10⁻³ | 2.40×10⁻⁴ | 2.45×10⁻⁴ | 3.98×10⁻⁴ | |
| 呼吸摄入 ADD inh | 6.36×10⁻¹² | 1.61×10⁻¹⁰ | 5.94×10⁻¹⁴ | 2.95×10⁻⁹ | 9.18×10⁻¹⁴ | 8.10×10⁻¹³ | 2.55×10⁻¹⁴ | 2.61×10⁻¹² | 1.48×10⁻¹³ | ||
| 皮肤摄入 ADDdermal | 2.38×10⁻⁴ | 2.88×10⁻³ | 7.45×10⁻⁶ | 8.59×10⁻⁴ | 1.31×10⁻⁵ | 2.03×10⁻⁴ | 4.78×10⁻⁶ | 9.77×10⁻⁵ | 2.27×10⁻⁵ | ||
| 非致癌风险 总指数HI | 儿童 Children | 4.22×10⁻² | 2.82×10⁻² | 9.70×10⁻⁴ | 1.58×10⁻² | 1.53×10⁻³ | 1.33×10⁻² | 4.17×10⁻⁴ | 5.37×10⁻⁴ | 7.10×10⁻⁴ | |
| 成人 Adult | 2.46×10⁻² | 1.73×10⁻² | 5.68×10⁻⁴ | 9.47×10⁻³ | 9.00×10⁻⁴ | 7.84×10⁻³ | 2.44×10⁻⁴ | 3.42×10⁻⁴ | 4.21×10⁻⁴ | ||
Table 6 Non carcinogenic risk index of heavy metals in soil
| 指数 Index | 暴露人群 Exposed population | 摄入方式 Ingestion mode | As | Cr | Cu | Mn | Ni | Pb | Zn | Cd | Hg |
|---|---|---|---|---|---|---|---|---|---|---|---|
| 非致癌风险 指数HQ | 儿童 Children | 手口摄入 ADDing | 4.19×10⁻² | 2.48×10⁻² | 9.61×10⁻⁴ | 1.47×10⁻² | 1.52×10⁻³ | 1.31×10⁻² | 4.11×10⁻⁴ | 4.20×10⁻⁴ | 6.83×10⁻⁴ |
| 呼吸摄入 ADD inh | 2.82×10⁻¹² | 7.17×10⁻¹¹ | 2.63×10⁻¹⁴ | 1.31×10⁻⁹ | 4.07×10⁻¹⁴ | 3.59×10⁻¹³ | 1.13×10⁻¹⁴ | 1.15×10⁻¹² | 6.59×10⁻¹⁴ | ||
| 皮肤摄入 ADDdermal | 2.86×10⁻⁴ | 3.47×10⁻³ | 8.97×10⁻⁶ | 1.03×10⁻³ | 1.57×10⁻⁵ | 2.44×10⁻⁴ | 5.76×10⁻⁶ | 1.17×10⁻⁴ | 2.73×10⁻⁵ | ||
| 成人 Adult | 手足摄入 ADDing | 2.44×10⁻² | 1.44×10⁻² | 5.60×10⁻⁴ | 8.61×10⁻³ | 8.87×10⁻⁴ | 7.64×10⁻³ | 2.40×10⁻⁴ | 2.45×10⁻⁴ | 3.98×10⁻⁴ | |
| 呼吸摄入 ADD inh | 6.36×10⁻¹² | 1.61×10⁻¹⁰ | 5.94×10⁻¹⁴ | 2.95×10⁻⁹ | 9.18×10⁻¹⁴ | 8.10×10⁻¹³ | 2.55×10⁻¹⁴ | 2.61×10⁻¹² | 1.48×10⁻¹³ | ||
| 皮肤摄入 ADDdermal | 2.38×10⁻⁴ | 2.88×10⁻³ | 7.45×10⁻⁶ | 8.59×10⁻⁴ | 1.31×10⁻⁵ | 2.03×10⁻⁴ | 4.78×10⁻⁶ | 9.77×10⁻⁵ | 2.27×10⁻⁵ | ||
| 非致癌风险 总指数HI | 儿童 Children | 4.22×10⁻² | 2.82×10⁻² | 9.70×10⁻⁴ | 1.58×10⁻² | 1.53×10⁻³ | 1.33×10⁻² | 4.17×10⁻⁴ | 5.37×10⁻⁴ | 7.10×10⁻⁴ | |
| 成人 Adult | 2.46×10⁻² | 1.73×10⁻² | 5.68×10⁻⁴ | 9.47×10⁻³ | 9.00×10⁻⁴ | 7.84×10⁻³ | 2.44×10⁻⁴ | 3.42×10⁻⁴ | 4.21×10⁻⁴ | ||
| 暴露人群 Exposed population | 统计结果 Statistical results | As | Cr | Ni | Cd |
|---|---|---|---|---|---|
| 儿童 Children | 最小值 Minimum | 3.19×10⁻¹⁵ | 7.14×10⁻¹⁴ | 6.40×10⁻¹⁶ | 5.02×10⁻¹⁷ |
| 最大值 Maximum | 3.45×10⁻¹⁴ | 6.72×10⁻¹³ | 3.75×10⁻¹⁵ | 6.23×10⁻¹⁶ | |
| 平均值 Average value | 1.50×10⁻¹⁴ | 2.48×10⁻¹³ | 2.02×10⁻¹⁵ | 2.10×10⁻¹⁶ | |
| 中位值 Median value | 1.50×10⁻¹⁴ | 2.37×10⁻¹³ | 2.02×10⁻¹⁵ | 1.55×10⁻¹⁶ | |
| 标准差 Standard deviation | 6.43×10⁻¹⁵ | 1.15×10⁻¹³ | 6.52×10⁻¹⁶ | 1.54×10⁻¹⁶ | |
| 成人 Adult | 最小值 Minimum | 7.20×10⁻¹⁵ | 1.61×10⁻¹³ | 1.44×10⁻¹⁵ | 1.13×10⁻¹⁶ |
| 最大值 Maximum | 7.78×10⁻¹⁴ | 1.51×10⁻¹² | 8.46×10⁻¹⁵ | 1.40×10⁻¹⁵ | |
| 平均值 Average value | 3.40×10⁻¹⁴ | 5.59×10⁻¹³ | 4.57×10⁻¹⁵ | 4.73×10⁻¹⁶ | |
| 中位值 Median value | 3.40×10⁻¹⁴ | 5.35×10⁻¹³ | 4.57×10⁻¹⁵ | 3.51×10⁻¹⁶ | |
| 标准差 Standard deviation | 1.45×10⁻¹⁴ | 2.59×10⁻¹³ | 1.47×10⁻¹⁵ | 3.47×10⁻¹⁶ |
Table 7 Statistics of carcinogenic risk index of heavy metals in soil
| 暴露人群 Exposed population | 统计结果 Statistical results | As | Cr | Ni | Cd |
|---|---|---|---|---|---|
| 儿童 Children | 最小值 Minimum | 3.19×10⁻¹⁵ | 7.14×10⁻¹⁴ | 6.40×10⁻¹⁶ | 5.02×10⁻¹⁷ |
| 最大值 Maximum | 3.45×10⁻¹⁴ | 6.72×10⁻¹³ | 3.75×10⁻¹⁵ | 6.23×10⁻¹⁶ | |
| 平均值 Average value | 1.50×10⁻¹⁴ | 2.48×10⁻¹³ | 2.02×10⁻¹⁵ | 2.10×10⁻¹⁶ | |
| 中位值 Median value | 1.50×10⁻¹⁴ | 2.37×10⁻¹³ | 2.02×10⁻¹⁵ | 1.55×10⁻¹⁶ | |
| 标准差 Standard deviation | 6.43×10⁻¹⁵ | 1.15×10⁻¹³ | 6.52×10⁻¹⁶ | 1.54×10⁻¹⁶ | |
| 成人 Adult | 最小值 Minimum | 7.20×10⁻¹⁵ | 1.61×10⁻¹³ | 1.44×10⁻¹⁵ | 1.13×10⁻¹⁶ |
| 最大值 Maximum | 7.78×10⁻¹⁴ | 1.51×10⁻¹² | 8.46×10⁻¹⁵ | 1.40×10⁻¹⁵ | |
| 平均值 Average value | 3.40×10⁻¹⁴ | 5.59×10⁻¹³ | 4.57×10⁻¹⁵ | 4.73×10⁻¹⁶ | |
| 中位值 Median value | 3.40×10⁻¹⁴ | 5.35×10⁻¹³ | 4.57×10⁻¹⁵ | 3.51×10⁻¹⁶ | |
| 标准差 Standard deviation | 1.45×10⁻¹⁴ | 2.59×10⁻¹³ | 1.47×10⁻¹⁵ | 3.47×10⁻¹⁶ |
| [1] |
ADAMO P, DUDKA S, WILSON M J, et al., 2002. Distribution of trace elements in soils from the Sudbury smelting area (Ontario, Canada)[J]. Water, Air, and Soil Pollution, 137(1-4): 95-116.
DOI URL |
| [2] |
BI X Y, LIANG S Y, LI X D, 2013. A novel in situ method for sampling urban soil dust: particle size distribution,trace metal concentrations and stable lead isotopes[J]. Environmental Pollution, 177: 48-57.
DOI URL |
| [3] |
CHAKRABORTY S, MAN T, PAULETTE L, et al., 2017. Rapid assessment of smelter/mining soil contamination via portable X-ray fluorescence spectrometry and indicator kriging[J]. Geoderma, 306: 108-119.
DOI URL |
| [4] |
CHOPIN E, ALLOWAY B J, 2007. Trace element partitioning and soil particle characterisation around mining and smelting areas at Tharsis, Ríotinto and Huelva, SW Spain[J]. Science of the Total Environment, 373(2-3): 488-500.
PMID |
| [5] |
CLEMENTE R, DICKINSON N M, LEPP N W, 2008. Mobility of metals and metalloids in a multi-element contaminated soil 20 years after cessation of the pollution source activity[J]. Environmental Pollution, 155(2): 254-261.
DOI PMID |
| [6] |
FELIX O I, CSAVINA J, FIELD J, et al., 2015. Use of lead isotopes to identify sources of metal and metalloid contaminants in atmospheric aerosol from mining operations[J]. Chemosphere, 122: 219-226.
DOI PMID |
| [7] |
FORGHANI G, KELM U, MAZINANI V, 2019. Spatial distribution and chemical partitioning of potentially toxic elements in soils around Khatoon-Abad Cu Smelter, SE Iran[J]. Journal of Geochemical Exploration, 196: 66-80.
DOI URL |
| [8] |
JAFFAR S T A, CHEN L Z, YOUNAS H, et al., 2017. Heavy metals pollution assessment in correlation with magnetic susceptibility in topsoils of Shanghai[J]. Environmental Earth Sciences, 76(7): 661-669.
DOI URL |
| [9] |
KABALA C, SINGH B R, 2001. Fractionation and mobility of copper, lead, and zinc in soil profiles in the vicinity of a copper smelter[J]. Journal of Environmental Quality, 30(2): 485-492.
PMID |
| [10] |
LI X Y, CAO Y J, QI L, et al., 2012. The distribution characteristics of heavy metals in Guiyang urban soils[J]. Chinese Journal of Geochemistry, 31(2): 174-180.
DOI URL |
| [11] |
MARTLEY E, GULSON B L, PFEIFER H R, 2004. Metal concentrations in soils around the copper smelter and surrounding industrial complex of Port Kembla, NSW, Australia[J]. Science of the Total Environment, 325(1-3): 113-127.
PMID |
| [12] |
PARRA S, BRAVO M A, QUIROZ W, et al., 2014. Distribution of trace elements in particle size fractions for contaminated soils by a copper smelting from different zones of the Puchuncaví Valley (Chile)[J]. Chemosphere, 111: 513-521.
DOI PMID |
| [13] | TATSY Y G, PIRRONE N, 2013. Assessment of the distribution of heavy metals around a Cu smelter town, Karabash, South Urals, Russia[EB/OL]. E3s Web of Conferences, 1: 19010. |
| [14] | XIAO X, ZHANG J, WANG H, et al., 2020. Distribution and health risk assessment of potentially toxic elements in soils around coal industrial areas: A global meta-analysis[EB/OL]. Science of the Total Environment, 713: 135292. |
| [15] | 柴立立, 崔邢涛, 2019. 河北省重点城市土壤重金属污染评价与防治对策——以石家庄市为例[J]. 科学技术与工程, 19(3): 261-268. |
| CHAI L L, CUI X T, 2019. Pollution assessments and prevention countermeasures of heavy metals of soil in main cities of Hebei Province: Taking Shijiazhuang as an example[J]. Science Technology and Engineering, 19(3): 261-269. | |
| [16] | 白宇明, 李永利, 周文辉, 等, 2022. 典型工业城市土壤重金属元素形态特征及生态风险评估[J]. 岩矿测试, 41(4): 632-641. |
| BAI Y M, LI Y L, ZHOU W H, et al., 2022. Speciation characteristics and ecological risk assessment of heavy metal elements in soils of typical industrial city[J]. Rock and Mineral Analysis, 41(4): 632-641. | |
| [17] | 陈铂垚, 刘凯利, 李明峰, 等, 2021. 典型高新技术产业开发区土壤重金属污染物来源及生态风险和产业工人健康风险评价[J]. 环境化学, 40(9): 2680-2692. |
| CHEN B Y, LIU K L, LI M F, et al., 2021. Source identification of soil heavy metal pollutants with the assessment of ecological risk and industrial workers health risk[J]. Environmental Chemistry, 40(9): 2680-2692. | |
| [18] | 陈佳林, 李仁英, 谢晓金, 等, 2021. 南京市绿地土壤重金属分布特征及其污染评价[J]. 环境科学, 42(2): 909-916. |
| CHEN J L, LI R Y, XIE X J, et al., 2021. Distribution characteristics and pollution evaluation of heavy metals in greenbelt soils of Nanjing city[J]. Environmental Science, 42(2): 909-916. | |
| [19] | 陈景辉, 卢新卫, 翟萌, 2011. 西安城市路边土壤重金属来源与潜在风险[J]. 应用生态学报, 22(7): 1810-1816. |
| CHEN J H, LU X W, ZHAI M, 2011. Sources and potential risk of heavy metals in roadside soils of Xi’an City[J]. Chinese Journal of Applied Ecology, 22(7): 1810-1816. | |
| [20] | 陈景辉, 2011. 西安城市路边土壤重金属污染与天然放射性水平研究[D]. 西安: 陕西师范大学. |
| CHEN J H, 2011. Study on heavy metal pollution and natural radioactivity level of urban roadside soil in Xi’an[D]. Xi’an: Shaanxi Normal University. | |
| [21] |
陈同斌, 黄铭洪, 黄焕忠, 等, 1997. 香港土壤中的重金属含量及其污染现状[J]. 地理学报, 52(3): 228-236.
DOI |
|
CHEN T B, HUANG M H, HUANG H Z, et al., 1997. A study on heavy metal pollution in soils in Hong Kong[J]. Acta Geographica Sinica, 52(3): 228-236.
DOI |
|
| [22] | 范春丽, 刘晓娟, 田云芳, 等, 2021. 郑州市西部工业走廊地区土壤重金属污染状况调查[J]. 安徽农学通报, 27(3): 113-116. |
| FAN C L, LIU X J, TIAN Y F, et al., 2021. Investigation on soil heavy metal pollution in the western industrial corridor of Zhengzhou city[J]. Anhui Agricultural Science Bulletin, 27(3): 113-116. | |
| [23] | 侯佳渝, 杨耀栋, 程绪江, 2021. 天津市城区不同功能区绿地土壤重金属分布特征及来源研究[J]. 物探与化探, 45(5): 1130-1134. |
| HOU J Y, YANG Y D, CHENG X J, 2021. Distribution and sources of heavy metals in greenbelt soil in different functional zones of Tianjin City[J]. Geophysical and Geochemical Exploration, 45(5): 1130-1134. | |
| [24] | 胡延彪, 李忠武, 黄金权, 等, 2016. 湘江长沙段洲滩菜园土壤重金属潜在生态风险评价[J]. 安全与环境学报, 16(1): 354-358. |
| HU Y B, LI Z W, HUANG J Q, et al., 2016. Potential ecological risk assessment of heavy metal contaminants in the soils of the vegetable plants in Changsha section of Xiangjiang River[J]. Journal of Safety and Environment, 16(1): 354-358. | |
| [25] | 黄锐, 苏贺, 赵丹, 2020. 南宁心圩江底泥重金属污染特征分析[J]. 西部交通科技 (1):185-188, 196. |
| HUANG R, SU H, ZHAO D, 2020. Analysis on pollution characteristics of heavy metals in the bottom mud of Xinwei River in Nanning[J]. Western Communications Science and Technology (1): 185-188, 196. | |
| [26] | 黄煜韬, 施维林, 纪娟, 等, 2022. 基于BP神经网络对某电镀厂土壤重金属预测及人体健康风险评价[J]. 生态毒理学报, 17(2): 278-289. |
| HUANG Y T, SHI W L, JI J, et al., 2022. Prediction of soil heavy metals based on BP neural network and assessment of human health risk of an electroplating plant[J]. Asian Journal of Ecotoxicology, 17(2): 278-289. | |
| [27] | 贾中民, 2021. 渝西北土壤重金属污染特征、源解析与生态健康风险评价[D]. 重庆: 西南大学. |
| JIA Z M, 2021. Characteristics, source analysis and ecological health risk assessment of soil heavy metal pollution in Northwest Chongqing[D]. Chongqing: Southwest University. | |
| [28] | 李春艳, 2021. 兰州市主城区不同功能区表土重金属污染特征及风险评价[D]. 兰州: 西北师范大学. |
| LI C, 2021. Pollution characteristics and risk assessment of heavy metals in topsoil of different functional areas in the main urban area of Lanzhou[D]. Lanzhou: Northwest Normal University. | |
| [29] | 李括, 彭敏, 杨峥, 等, 2020. 中国193个城市规划区土壤微量元素污染与健康风险[J]. 环境科学, 41(4): 1825-1837. |
| LI K, PENG M, YANG Z, et al., 2020. Trace Metals Pollution and Health Risks for Planning Area Soils of 193 Chinese Cities[J]. Environmental science, 41(4): 1825-1837. | |
| [30] | 李伟, 高海涛, 张娜, 等, 2022. 拉萨市城区土壤重金属分布特征及生态风险评价[J]. 环境工程技术报, 12(3): 869-877. |
| LI W, GAO H T, ZHANG N, et al., 2022. Distribution characteristics and ecological risk assessment of heavy metals in soil of Lhasa City[J]. Journal of Environmental Engineering Technology, 12(3): 869-877. | |
| [31] | 刘春英, 李洪义, 2019. 南昌市不同功能区绿化带土壤重金属污染特征及生态风险评价[J]. 生态环境学报, 28(8): 1691-1699. |
| LIU C Y, LI H Y, 2019. Pollution characteristics of heavy metals in green belt soil of different functional areas in Nanchang and the ecological risk assessment[J]. Ecology and Environmental Sciences, 28(8): 1691-1699. | |
| [32] | 刘春跃, 王辉, 白明月, 等, 2020. 沈阳市老城区表层土壤重金属分布特征及风险评价[J]. 环境工程, 38(1): 167-171. |
| LIU C Y, WANG H, BAI M Y, et al., 2020. Risk assessment and characteristics of heavy metals in surface soil of old town of Shenyang[J]. Environmental Engineering, 38(1): 167-171. | |
| [33] | 刘玲玲, 2020. 北京城市公园表层土壤重金属污染评价及风险评估[D]. 合肥: 安徽大学. |
| LIU L L, 2020. Evaluation and risk assessment of heavy metal pollution in surface soil of Beijing Urban Parks[D]. Hefei: Anhui University. | |
| [34] |
彭驰, 刘旭, 周子若, 等, 2022. 铜冶炼场地周边土壤重金属污染特征与风险评价[EB/OL]. 环境科学, DOI: https://doi.org/10.13227/j.hjkx.202201040.
DOI |
|
PENG C, LIU X, ZHOU Z R, et al., 2022. Characteristics and risk assessment of heavy metal pollution in soil around copper smelting site[EB/OL]. Environmental Science, DOI: https://doi.org/10.13227/j.hjkx.202201040.
DOI |
|
| [35] | 孙变变, 赵银鑫, 常丹, 等, 2020. 银川市城市绿地土壤重金属分布特征及其生态风险评价[J]. 水土保持研究, 27(6): 262-268, 277. |
| SUN B B, ZHAO Y X, CHANG D, et al., 2020. Distribution characteristics and ecological risk assessment of heavy metals in urban green soil of Yinchuan City[J]. Research of Soil and Water Conservation, 27(6): 262-268, 277 | |
| [36] | 汪洁, 龚竞, 刘雨佳, 等, 2022. 昆明市土壤重金属污染特征及其生态与健康风险评价[J]. 轻工学报, 37(4): 118-126. |
| WANG J, GONG J, LIU Y J, et al., 2022. Ecological and health risk assessment of heavy metals in urban soils from a typical southwest capital city, Kunming[J]. Journal of Light Industry, 37(4):118-126. | |
| [37] | 汪进, 韩智勇, 冯燕, 等, 2021. 成都市工业区绿地土壤重金属形态分布特征及生态风险评价[J]. 生态环境学报, 30(9): 1923-1932. |
| WANG J, HAN Z Y, FENG Y, et al., 2021. Morphological distribution characteristics and ecological risk assessment of heavy metal in the green soil of industrial zone in Chengdu[J]. Ecology and Environmental Sciences, 30(9): 1923-1932. | |
| [38] | 王天欣, 2021. 长春市建成区土壤重金属地球化学特征与风险评价[D]. 长春: 吉林大学. |
| WANG T X, 2021. Geochemical characteristics and risk assessment of soil heavy metals in built-up areas of Changchun[D]. Changchun: Jilin University. | |
| [39] | 王亚宇, 2008. 乌鲁木齐市土壤重金属空间分布及行道树对重金属的富集特征[D]. 乌鲁木齐: 新疆农业大学. |
| WANG Y Y, 2008. Spatial distribution of heavy metals in soil of Urumqi city and enrichment characteristics of heavy metals by roadside trees[D]. Urumqi: Xinjiang Agricultural University. | |
| [40] | 谢纪海, 黄群龙, 张娅婷, 等, 2018. 武汉都市发展区表层土壤重金属污染风险分析[J]. 环境工程, 36(增刊): 718-721. |
| XIE J H, HUANG Q L, ZHANG Y T, et al., 2018. Risk analysis of heavy metal pollution in surface soil of Wuhan Urban Development Area[J]. Environmental engineering, 36(Supplement): 718-721. | |
| [41] | 徐素云, 陈卫锋, 倪进治, 等, 2017. 福州市蔬菜基地土壤重金属和多环芳烃的含量及其与土壤磁性指标的关系[J]. 环境工程学报, 11(8): 4861-4867. |
| XU S Y, CHEN W F, NI J Z, et al., 2017. The content of heavy metals and polycyclic aromatic hydrocarbons in the soil of Fuzhou vegetable base and its relationship with soil magnetic index[J]. Chinese Journal of Environmental Engineering, 11(8): 4861-4867. | |
| [42] | 杨冰雪, 马勤, 方晨, 等, 2020. 杭州市临安区农田土壤重金属污染调查与评价[J]. 四川环境, 39(3): 132-138. |
| YANG B X, MA Q, FANG C, et al., 2020. Investigation and evaluation of heavy metal pollution in farmland soil of Lin’an District, Hangzhou[J]. Sichuan Environment, 39(3): 132-138 | |
| [43] | 杨大龙, 2021. 合肥市区表层土壤重金属污染特征及健康风险评估[D]. 合肥: 安徽医科大学. |
| YANG D L, 2021. Heavy metal pollution characteristics and health risk assessment of topsoil in Hefei City[D]. Hefei: Anhui Medical University. | |
| [44] | 杨蕊, 李小平, 王继文, 等, 2016. 西宁市城市土壤重金属分布特征及其环境风险[J]. 生态学杂志, 35(6): 1531-1538. |
| YANG R, LI X P, WANG J W, et al., 2016. Geochemical distribution and environment risk of heavy metals in urban soil of Xining City[J]. Chinese Journal of Ecology, 35(6): 1531-1538. | |
| [45] | 杨学兰, 马云飞, 2020. 基于PMF模型的济南市郊土壤重金属来源解析[J]. 河北环境工程学院学报, 30(6): 44-47, 72. |
| YANG X L, MA Y F, 2020. Source analysis of heavy metals in Jinan suburb soil based on PMF model[J]. Journal of Hebei University of Environmental Engineering, 30(6): 44-47, 72. | |
| [46] | 姚文文, 陈文德, 黄钟宣, 等, 2021. 重庆市主城区土壤重金属形态特征及风险评价[J]. 西南农业学报, 34(1): 159-164. |
| YAO W W, CHEN W D, HUANG Z X, et al., 2021. Speciation characteristics and risk assessment of heavy metals in soils in the main urban area of Chongqing[J]. Southwest China Journal of Agricultural Sciences, 34(1): 159-164. | |
| [47] | 殷秀莲, 谢志宜, 汪婉萍, 等, 2021. 广州市土壤重金属元素源解析: 三种受体模型的比较(英文)[J]. 中国科学技术大学学报, 51(11): 813-821. |
| YIN X L, XIE Z Y, WANG W P, et al., 2021. Source apportionment of heavy metals in soils of Guangzhou: comparison of three receptor models[J]. Journal of University of science and technology of China, 51(11): 813-821. | |
| [48] | 张慧, 郑志志, 马鑫鹏, 等, 2017. 哈尔滨市土壤表层重金属污染特征及来源辨析[J]. 环境科学研究, 30(10): 1597-1606. |
| ZHANG H, ZHENG Z Z, MA X P, et al., 2017. Sources and pollution characteristics of heavy metals in surface soils of Harbin City[J]. Research of Environmental Sciences, 30(10): 1597-1606. | |
| [49] | 张媛, 王美娥, 谢天, 等, 2021. 澳门特别行政区土壤自然消减能力与污染背景[J]. 环境科学学报, 41(2): 583-596. |
| ZHANG Y, WANG M E, XIE T, et al., 2021. Natural attenuation capacity and urban background contamination in soil in Macao[J]. Acta Scientiae Circumstantiae, 41(2): 583-596. | |
| [50] | 张媛, 2020. 太原市城乡室内尘和室外土壤重金属污染特征及来源解析[D]. 太原: 山西大学. |
| ZHANG Y, 2020. Characteristics and source analysis of indoor dust and outdoor soil heavy metal pollution in urban and rural areas of Taiyuan[D]. Taiyuan: Shanxi University. | |
| [51] | 中国环境监测总站, 1990. 中国土壤元素背景值[M]. 北京: 中国科学出版社. |
| China Environmental Monitoring Station, 1990. Background values of soil elements in China[M]. Beijing: China Science Press. | |
| [52] | 周宝宣, 秦夕淳, 袁琦, 2016. 海口市蔬菜土壤重金属含量特征研究[J]. 环境保护科学, 42(5): 124-128. |
| ZHOU B X, QIN X C, YUAN Q, 2016. Study on characteristics of heavy metal content in vegetable soil in Haikou[J]. Environmental Protection Science, 42 (5): 124-128 | |
| [53] | 周燕, 2018. 西安市不同功能区土壤重金属与多环芳烃污染研究[D]. 西安: 陕西师范大学. |
| ZHOU Y, 2018. Study on pollution of heavy metals and polycyclic aromatic hydrocarbons in soils of different functional areas in Xi’an[D]. Xi’an: Shaanxi Normal University. |
| [1] | DU Dandan, GAO Ruizhong, FANG Lijing, XIE Longmei. Spatial Variation of Soil Heavy Metals and Their Responses to Physicochemical Factors of Salt Lake Basin in Arid Area [J]. Ecology and Environment, 2023, 32(6): 1123-1132. |
| [2] | CHEN Minyi, ZHU Hanghai, SHE Weiduo, YIN Guangcai, HUANG Zuzhao, YANG Qiaoling. Health Risk Assessment and Source Apportionment of Soil Heavy Metals at A Legacy Shipyard Site in Pearl River Delta [J]. Ecology and Environment, 2023, 32(4): 794-804. |
| [3] | XIAO Jieyun, ZHOU Wei, SHI Peiqi. Hyperspectral Inversion of Soil Heavy Metals [J]. Ecology and Environment, 2023, 32(1): 175-182. |
| [4] | SHI Wenjing, ZHOU Hanpeng, SUN Tao, HUANG Jintao, YANG Wenhuan, LI Weiping. Research on Priority Control Factors and Health Risk Assessment of Heavy Metal Pollution in Soil Around Mining Areas [J]. Ecology and Environment, 2022, 31(8): 1616-1628. |
| [5] | TAO Ling, HUANG Lei, ZHOU Yilei, LI Zhongxing, REN Jun. Influences of Biochar Prepared by Co-pyrolysis with Sludge and Attapulgite on Bioavailability and Environmental Risk of Heavy Metals in Mining Soil [J]. Ecology and Environment, 2022, 31(8): 1637-1646. |
| [6] | LUO Songying, LI Qiuxia, QIU Jinkun, DENG Suyan, LI Yifeng, CHEN Bishan. Speciation Characteristics, Migration and Transformation of Heavy Metals in Mangrove Soil-plant System in Nansan Island [J]. Ecology and Environment, 2022, 31(7): 1409-1416. |
| [7] | PENG Hongli, TAN Haixia, WANG Ying, WEI Jianmei, FENG Yang. The Discrepancy of Heavy Metals Morphological Distribution in Soil and Its Associated Ecological Risk Evaluation under Different Planting Patterns [J]. Ecology and Environment, 2022, 31(6): 1235-1243. |
| [8] | HUANG Min, ZHAO Xiaofeng, LIANG Rongxiang, WANG Pengzhong, DAI Anran, HE Xiaoman. Comparison of Three Chelating Agents to Remove the Cd and Cu in Contaminated Soil [J]. Ecology and Environment, 2022, 31(6): 1244-1252. |
| [9] | ZHU Li'an, ZHANG Huihua, CHENG Jiong, LI Ting, LIN ZI, LI Junjie. Potential Ecological Risk Pattern Analysis of Heavy Metals in Soil of Forestry Land in The Pearl River Delta [J]. Ecology and Environment, 2022, 31(6): 1253-1262. |
| [10] | SHI Jianfei, JIN Zhengzhong, ZHOU Zhibin, WANG Xin. Evaluation of Heavy Metal Pollution in the Soil Around A Typical Tailing Reservoir in Irtysh River Basin [J]. Ecology and Environment, 2022, 31(5): 1015-1023. |
| [11] | YU Fei, YE Caihong, XU Tiaozi, ZHANG Zhongrui, ZHU Hangyong, ZHANG Geng, HUA Lei, DENG Jianfeng, DING Xiaogang. Evaluation of Heavy Metal Pollution in Woodland Soil of Granite Area in Shaoguan City [J]. Ecology and Environment, 2022, 31(2): 354-362. |
| [12] | LIU Di, SU Chao, ZHANG Hong, QIN Guanyu. Pollution Characteristics and Risk Assessment of Heavy Metal Pollution in A Typical Coal-based Industrial Cluster Zone [J]. Ecology and Environment, 2022, 31(2): 391-399. |
| [13] | XIE Shaowen, GUO Xiaosong, YANG Fen, HUANG Qiang, CHEN Manjia, WEI Xinghu, LIU Chengshuai. Accumulation Characteristics, Geochemical Fractions Distribution and Ecological Risk of Heavy Metals in Soils of Urban Parks in Guangzhou, China [J]. Ecology and Environment, 2022, 31(11): 2206-2215. |
| [14] | LIU Zhijian, DONG Yuanhua, ZHANG Xiu, QING Chengshi. Contamination and Ecological Risk Assessment of Heavy Metals in the Soil of Agricultural Land in Weining Plain, Northwest China [J]. Ecology and Environment, 2022, 31(11): 2216-2224. |
| [15] | WANG Haihe, SUN Yuanyuan, ZhANG Shuai, XU Xiaorong, SHANG Chengmei, LI Chunxiang. Pollution Characteristics and Health Risk Assessment of Heavy Metals in Drinking Water Source of Guiyang [J]. Ecology and Environment, 2022, 31(10): 2039-2047. |
| Viewed | ||||||
|
Full text |
|
|||||
|
Abstract |
|
|||||
Copyright © 2021 Editorial Office of ACTA PETROLEI SINICA
Address:No. 6 Liupukang Street, Xicheng District, Beijing, P.R.China, 510650
Tel: 86-010-62067128, 86-010-62067137, 86-010-62067139
Fax: 86-10-62067130
Email: syxb@cnpc.com.cn
Support byBeijing Magtech Co.ltd, E-mail:support@magtech.com.cn