生态环境学报 ›› 2024, Vol. 33 ›› Issue (9): 1329-1338.DOI: 10.16258/j.cnki.1674-5906.2024.09.001
• 碳循环与碳减排专栏 •
下一篇
侯金龙1( ), 马志强1,*(), 杨澄2, 葛双双1, 何迪1, 董璠1
收稿日期:2024-03-19
出版日期:2024-09-18
发布日期:2024-10-18
通讯作者:
*马志强。E-mail: zqma@ium.cn作者简介:侯金龙(1997年生),男,硕士,助理工程师,主要从事生态气象研究。E-mail: jlhou@ium.cn
基金资助:
HOU Jinlong1(), MA Zhiqiang1,*(), YANG Cheng2, GE Shuangshuang1, HE Di1, DONG Fan1
Received:2024-03-19
Online:2024-09-18
Published:2024-10-18
摘要:
植被净生态系统生产力(Net Ecosystem Productivity,NEP)在碳循环中起着关键作用,是生态系统碳预算的重要指标。基于MOD17A3数据、气象数据,结合土壤呼吸模型,对京津冀地区植被碳源/汇时空分布特征展开研究,并利用趋势分析、相关性分析等方法探究植被NEP与气象要素、植被归一化指数(Normalized Difference Vegetation Index,NDVI)及土地利用变化的关系。结果表明,1)2000-2022年京津冀地区NEP呈波动上升趋势,年增长率5.65 g·m−2,年均NEP为108 g·m−2,碳汇区面积也逐步增加,2022年占比达到最大值95.0%;NEP空间格局呈“北高南低”特征,与区域高程一致,并且有明显的空间异质性。2)近20年来,京津冀植被NEP呈上升趋势的面积占98.3%,且显著上升的区域占比为85.9%,在承德、张家口和北京较为集中,NEP为下降趋势的面积仅占1.72%;承德植被NEP呈显著上升的区域占比最多,为98.2%,而邯郸显著下降的区域占比最多,为1.03%。3)京津冀大部分地区植被NEP都与降水、气温呈正相关,与降水、气温的相关性均值分别为0.500、0.160,NEP与降水、气温呈显著正相关的面积占比分别为78.2%、13.9%,降水是影响京津冀地区NEP变化的关键气象因子;NDVI与NEP的平均相关系数为0.430,呈极显著正相关的面积占比为58.1%,其中正相关性较高的区域集中在京津冀西北部山区。土地利用变化结果显示近20年间京津冀林地面积大幅增加,3个研究时段内分别增加了31.4%、24.0%和11.9%,是驱动该地区植被NEP上升的重要因子。研究结果为京津冀地区植被碳源/汇的准确评估及“双碳”目标的实现提供了参考依据。
中图分类号:
侯金龙, 马志强, 杨澄, 葛双双, 何迪, 董璠. 京津冀地区植被碳源/汇的时空变化特征及影响因素分析[J]. 生态环境学报, 2024, 33(9): 1329-1338.
HOU Jinlong, MA Zhiqiang, YANG Cheng, GE Shuangshuang, HE Di, DONG Fan. Analysis of Spatio-temporal Variation of Vegetation Carbon Sources and Sinks in the Beijing-Tianjin-Hebei Region and Influencing Factors[J]. Ecology and Environment, 2024, 33(9): 1329-1338.
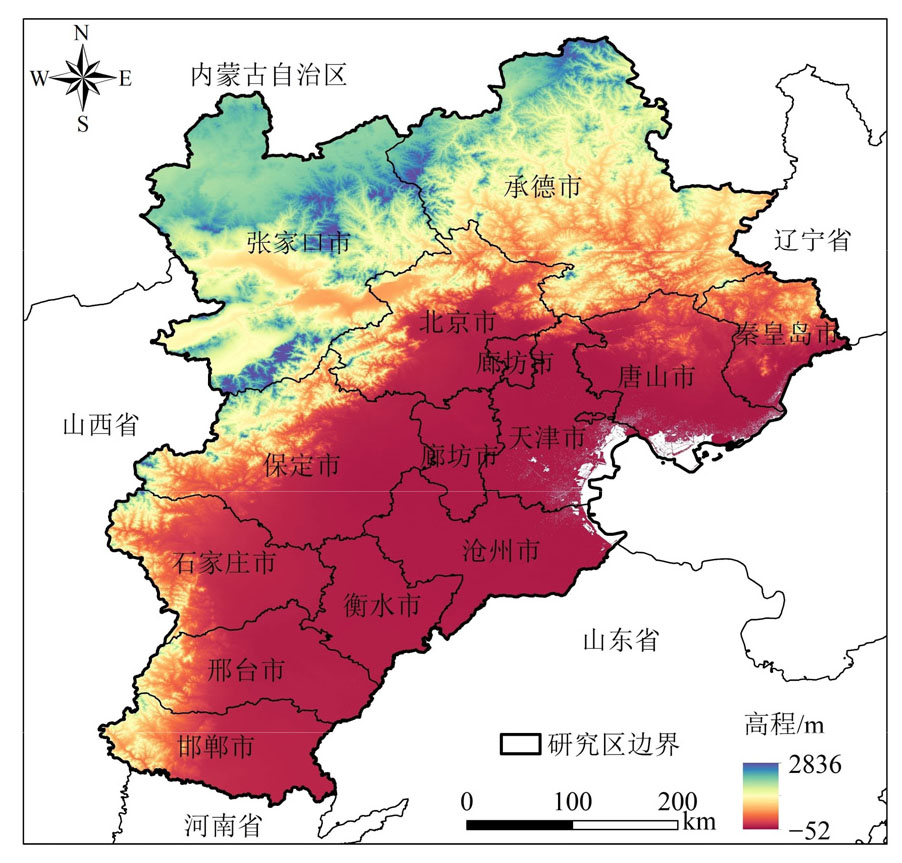
图1 京津冀地理位置及高程示意图
Figure 1 Beijing-Tianjin-Hebei geographic location and elevation map
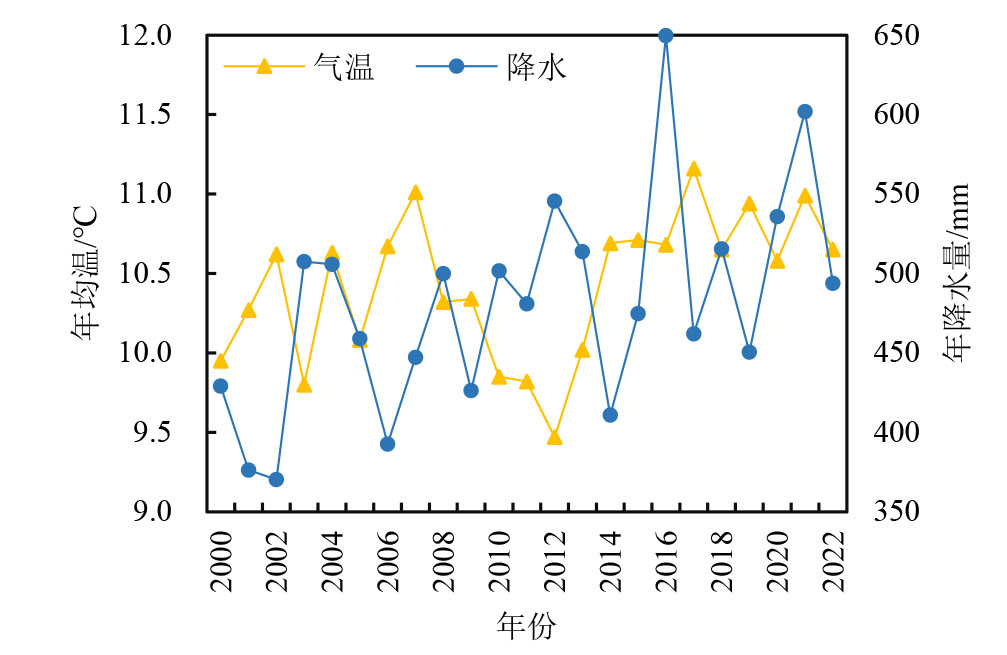
图2 2000-2022年京津冀年均气温及年降水量变化
Figure 2 Variations in mean annual temperature and precipitation in Beijing-Tianjin-Hebei during 2000-2022
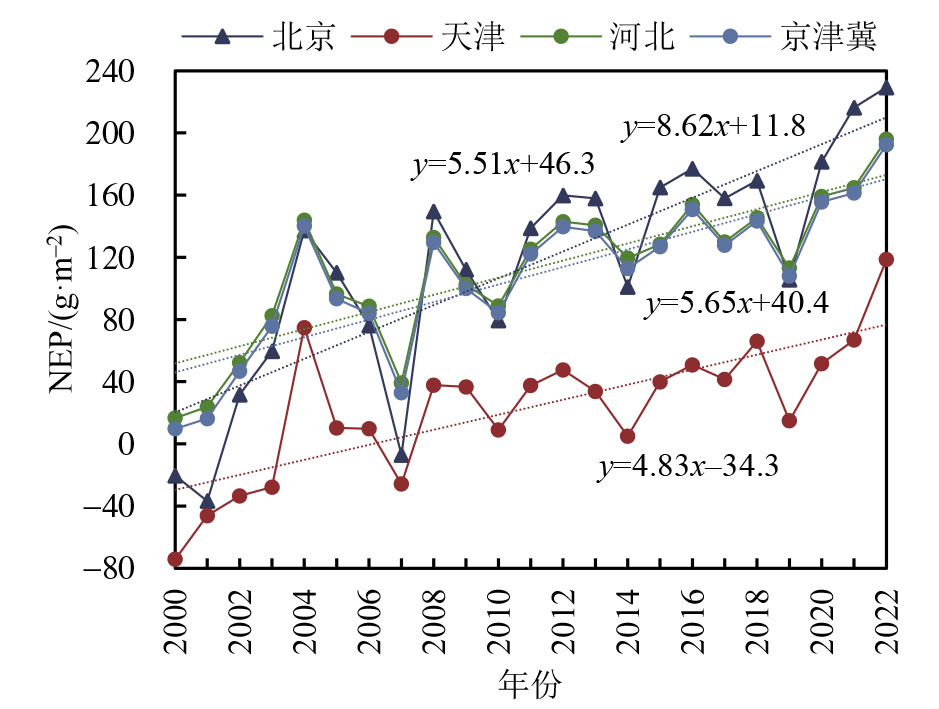
图3 2000-2022年京津冀植被NEP的时间变化
Figure 3 Temporal variations of vegetation NEP in Beijing-Tianjin-Hebei during 2000-2022
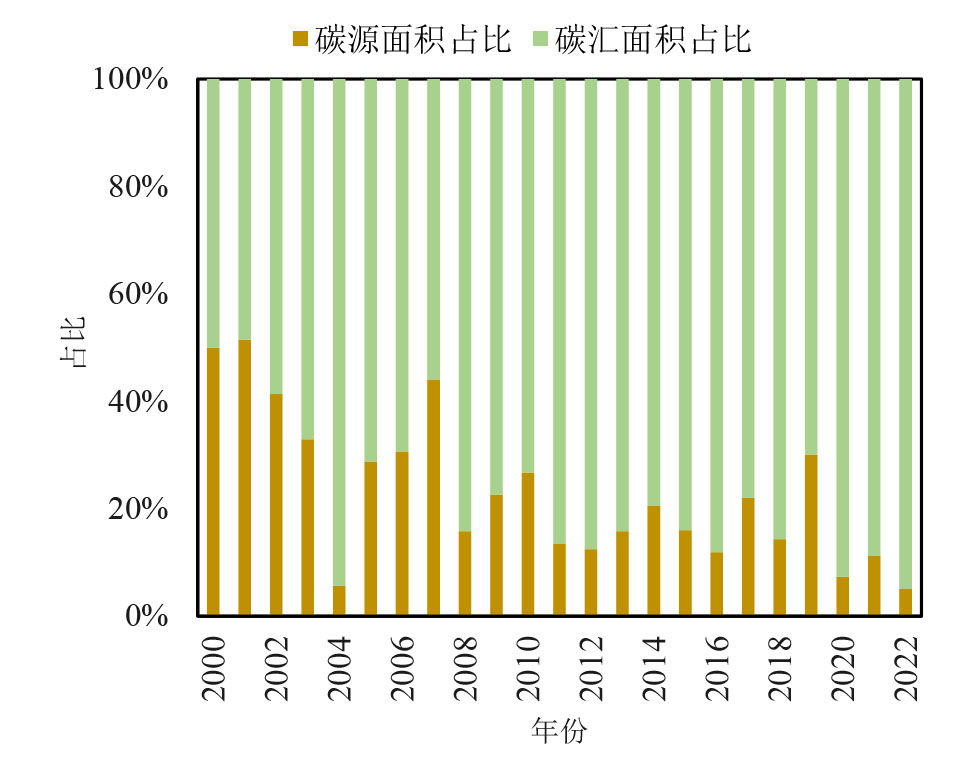
图4 2000-2022年京津冀碳源/汇面积占比
Figure 4 Proportional area of carbon sources and sinks in Beijing-Tianjin-Hebei during 2000-2022
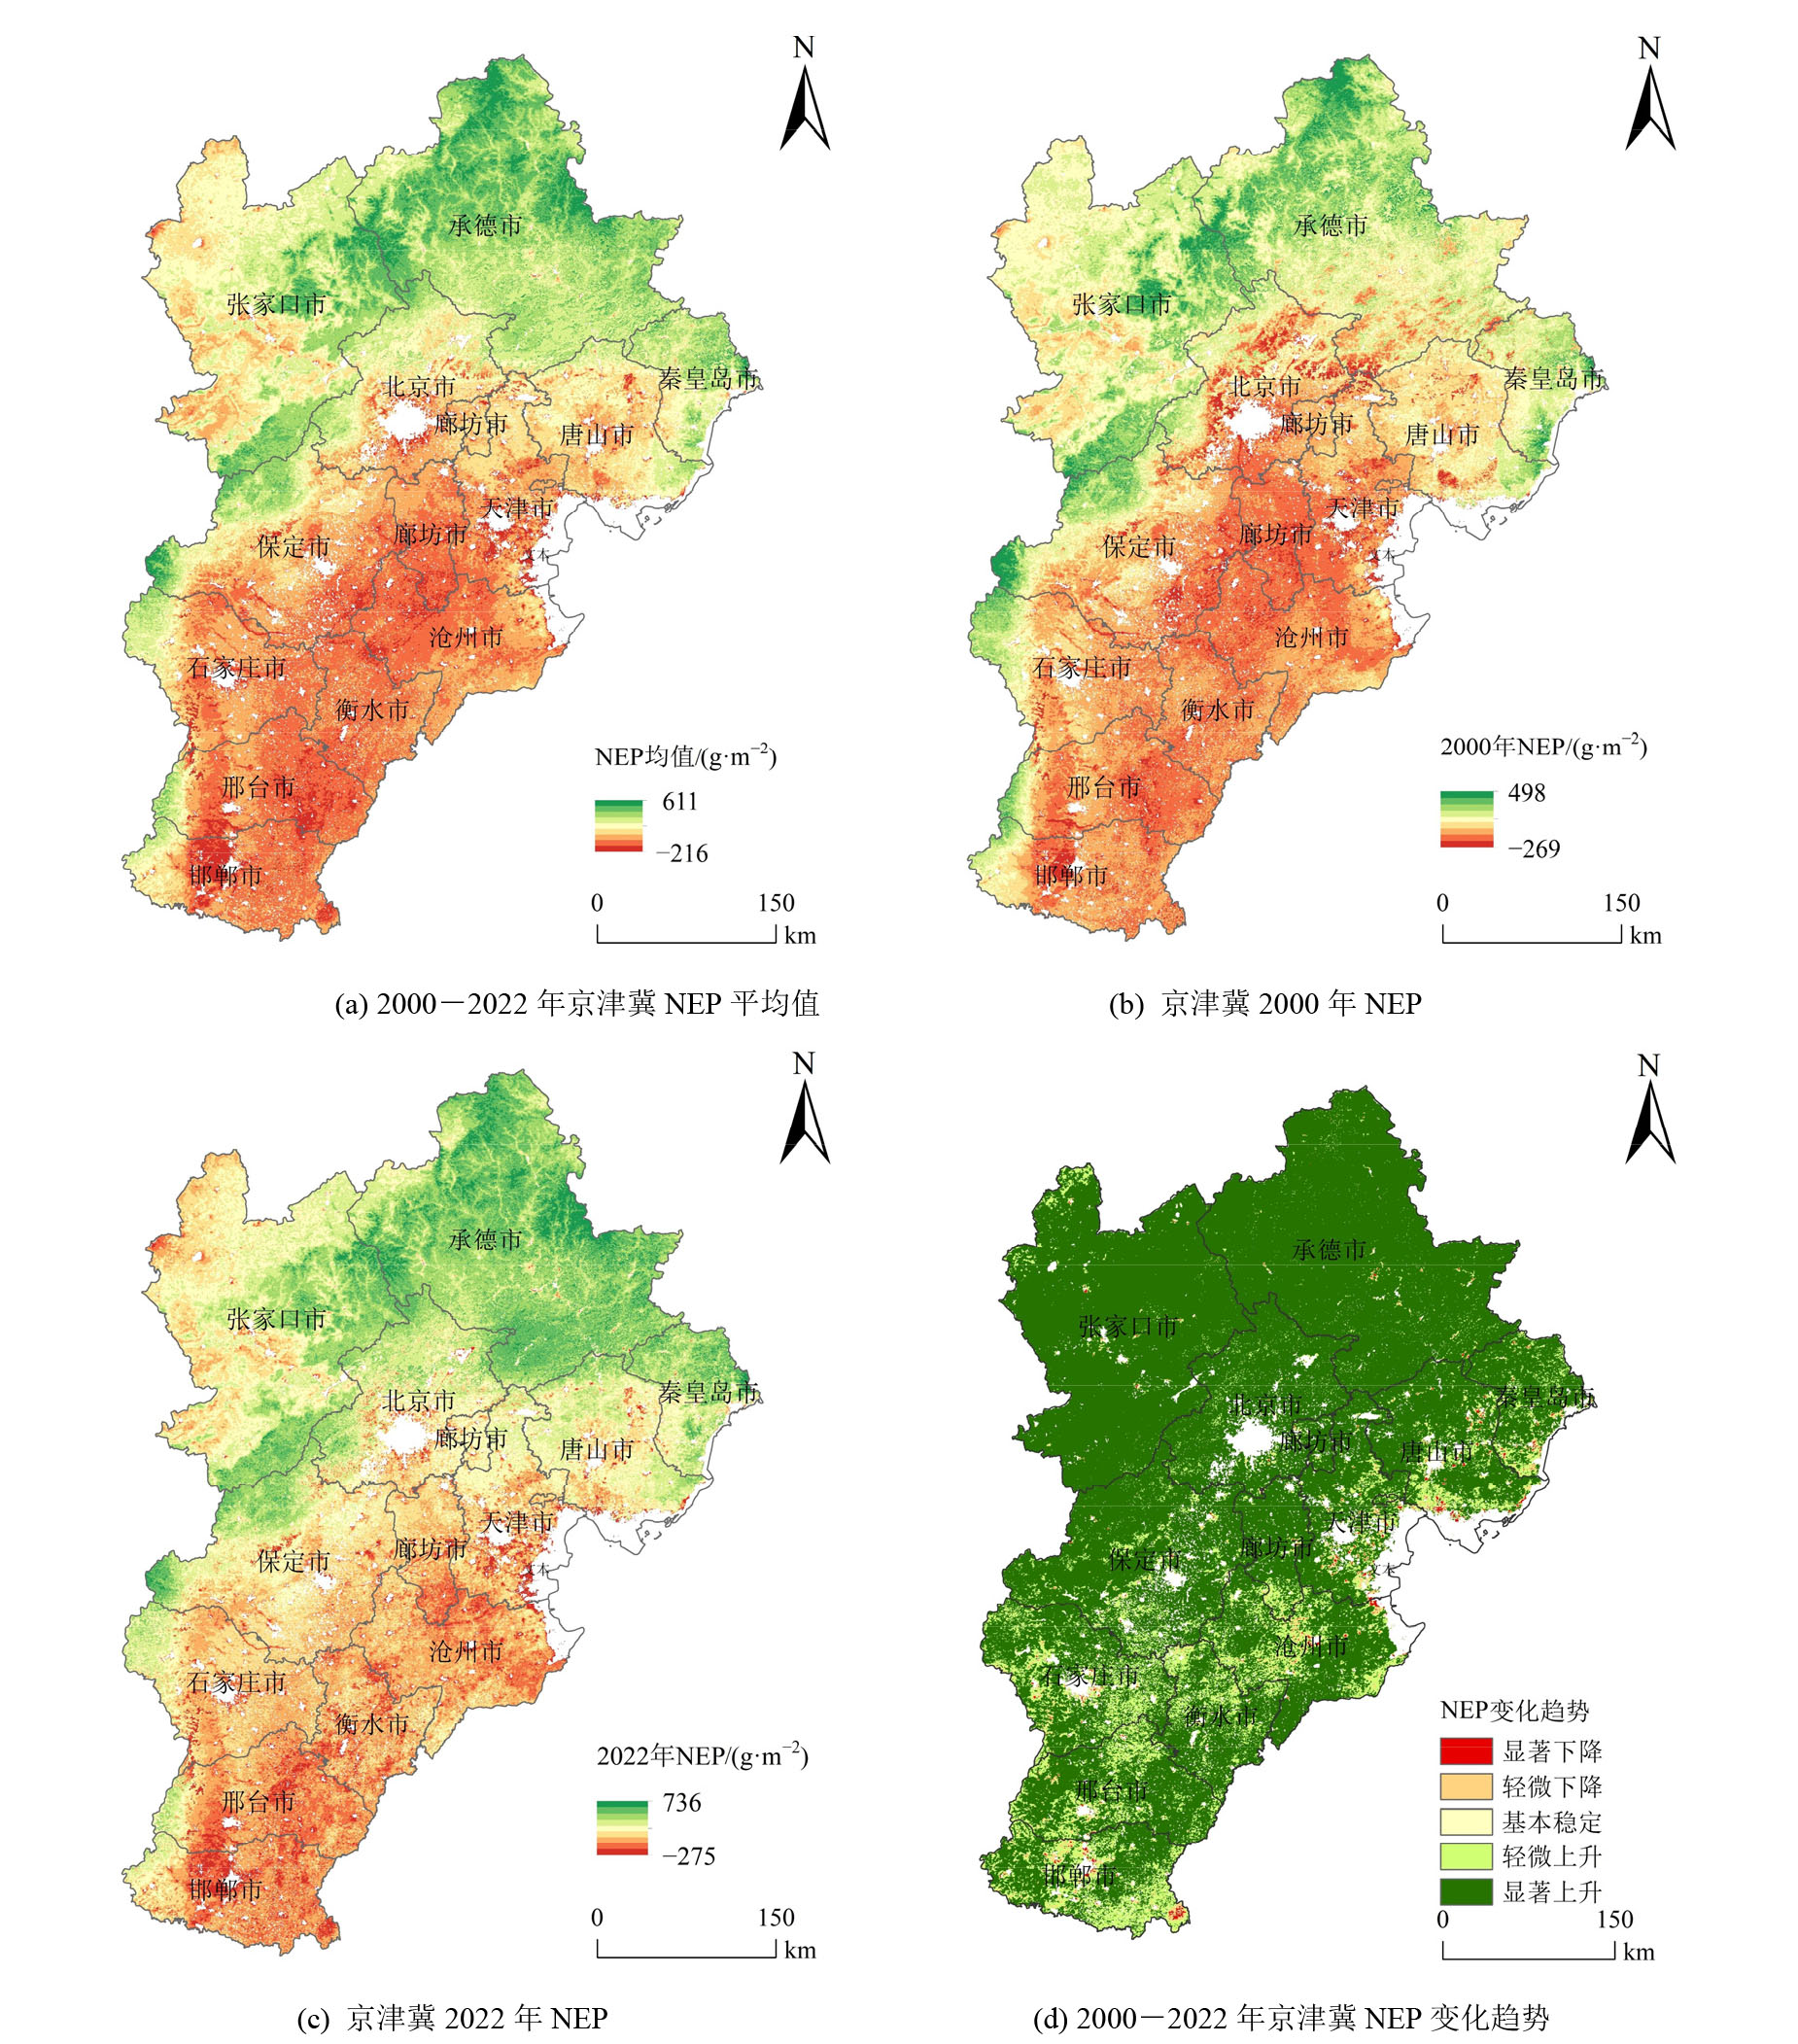
图5 2000-2022年京津冀NEP空间分布状况
Figure 5 Spatial distribution of NEP in Beijing-Tianjin-Hebei during 2000-2022
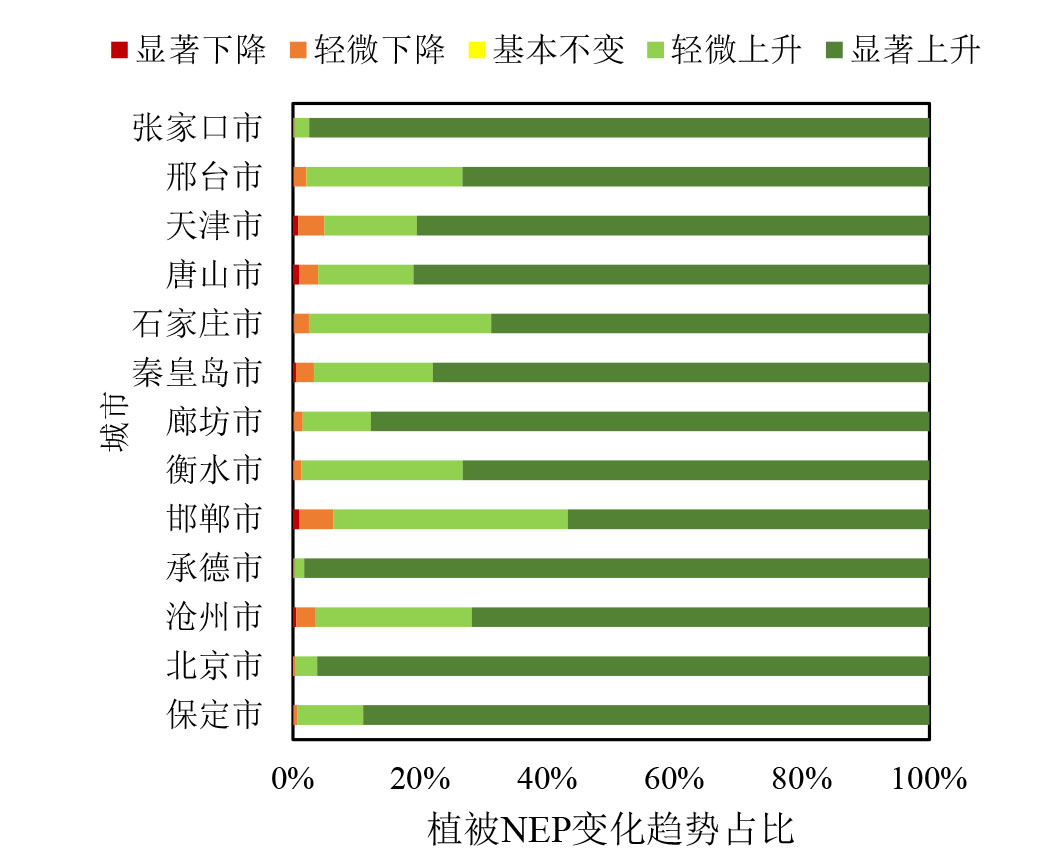
图6 植被NEP变化趋势占比统计
Figure 6 Statistics on the proportion of vegetation NEP change trend
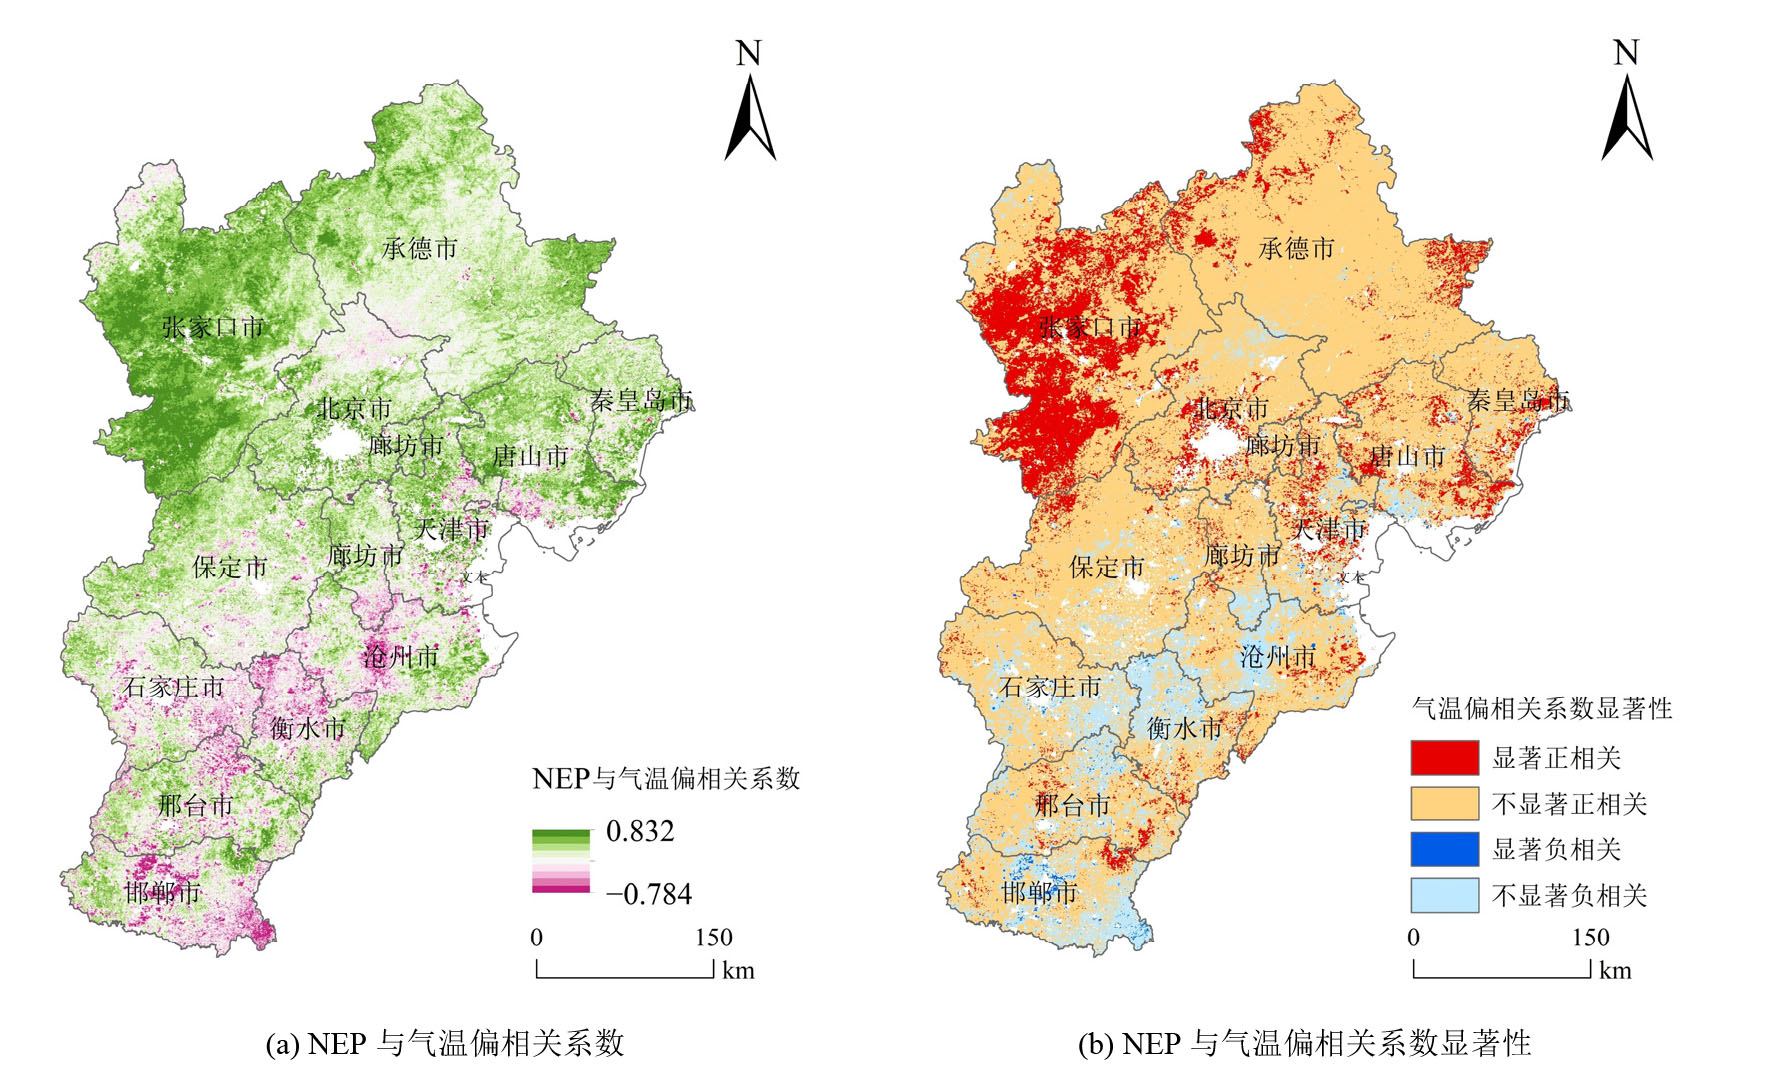
图7 2000-2022年京津冀NEP与气温相关性
Figure 7 Correlation between NEP and temperature in Beijing-Tianjin-Hebei during 2000-2022
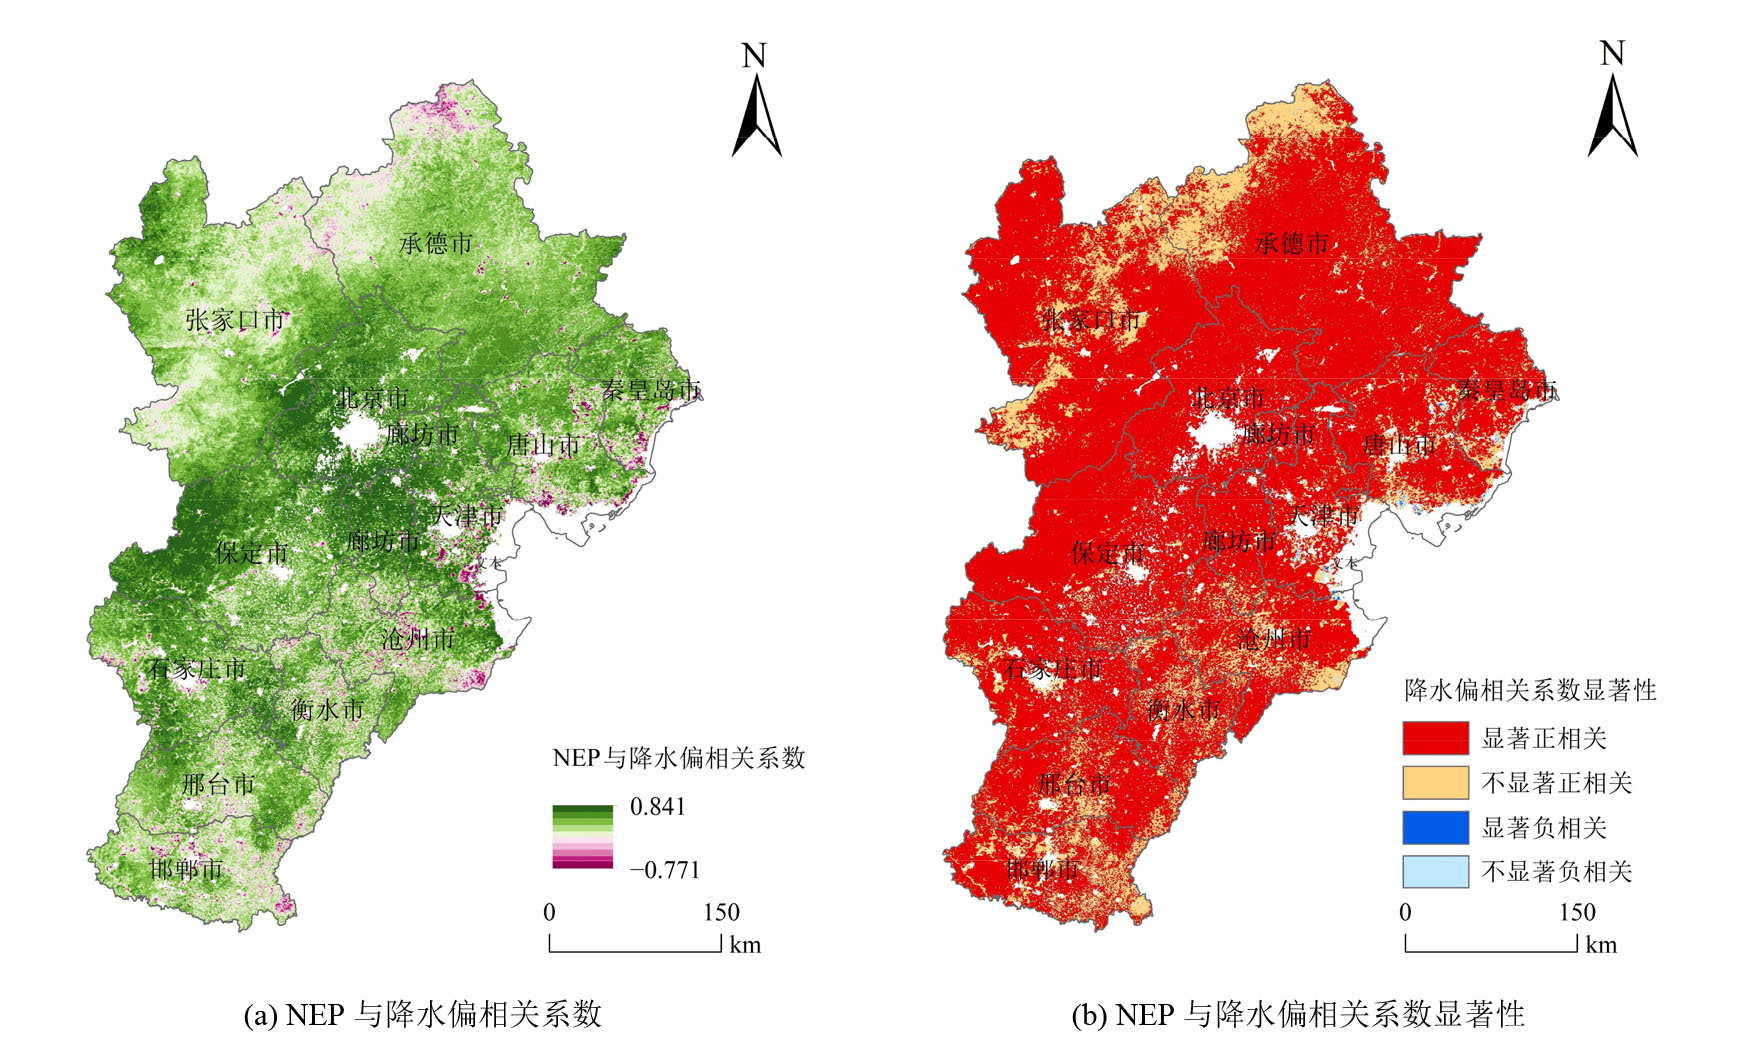
图8 2000-2022年京津冀NEP与降水相关性
Figure 8 Correlation between NEP and precipitation in Beijing-Tianjin-Hebei during 2000-2022
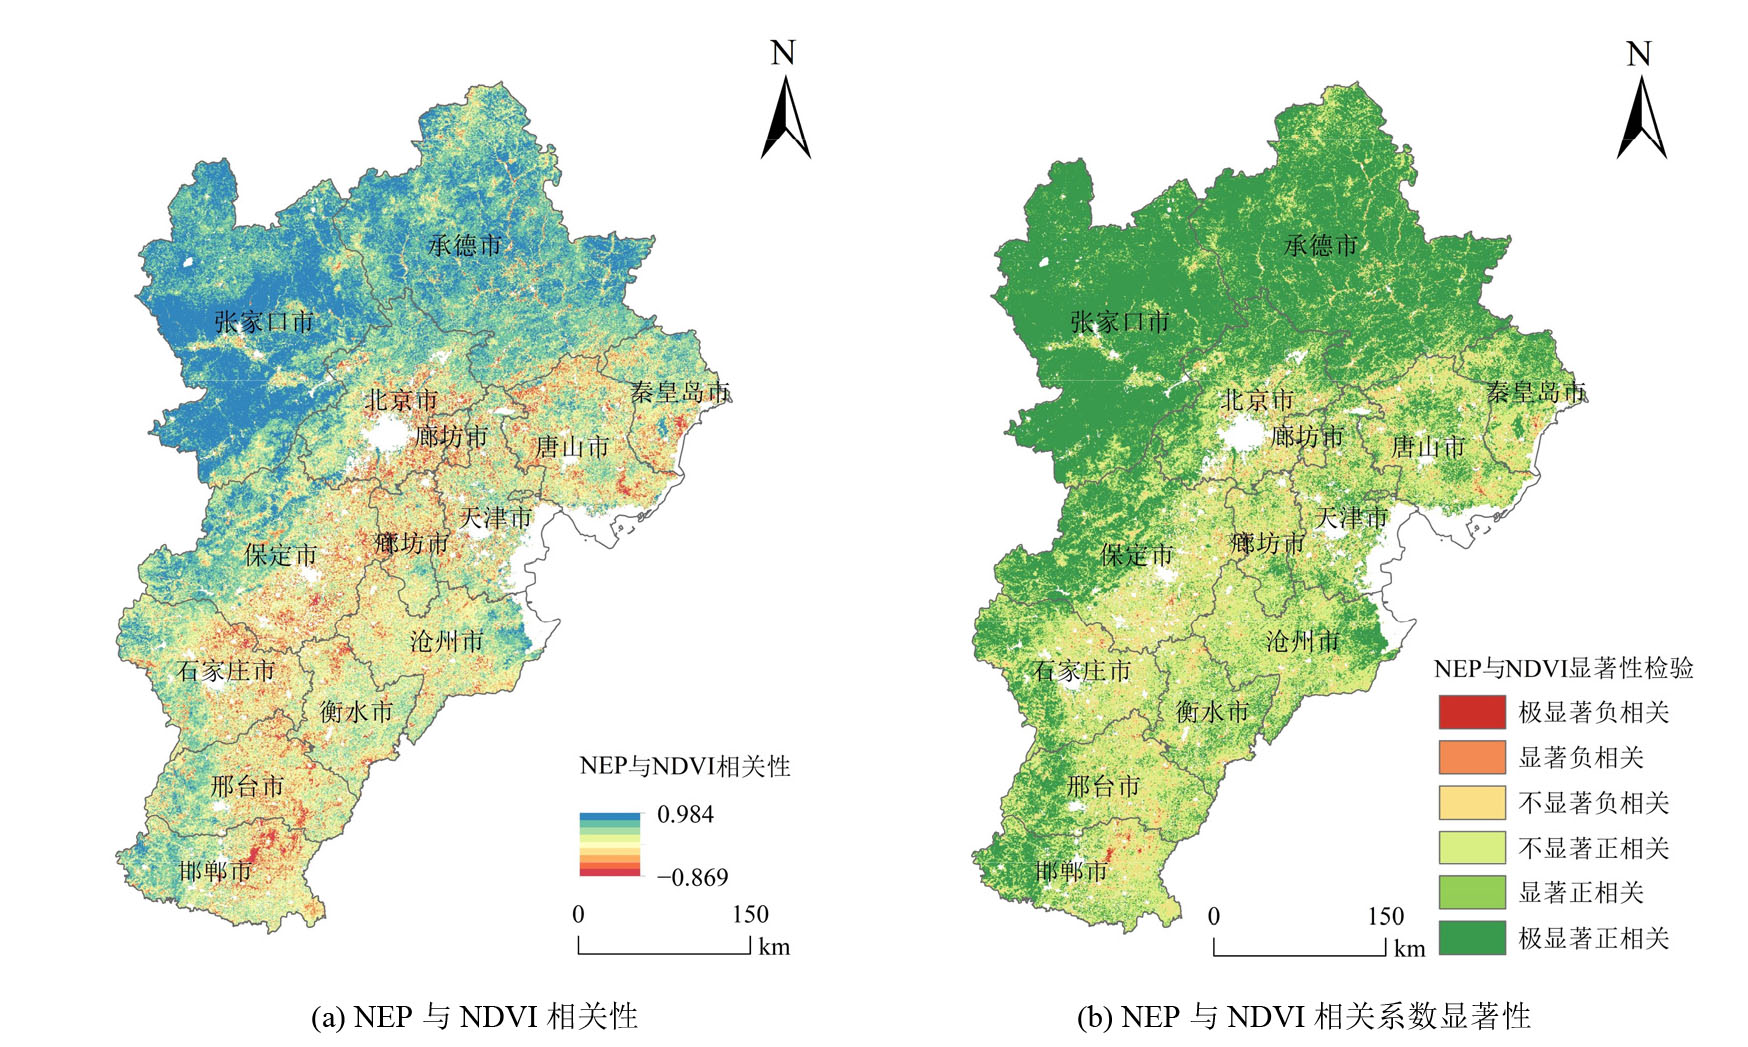
图9 2000-2022年京津冀NEP与NDVI相关性及显著性检验
Figure 9 Correlation and significance test between NEP and NDVI in Beijing-Tianjin-Hebei during 2000-2022
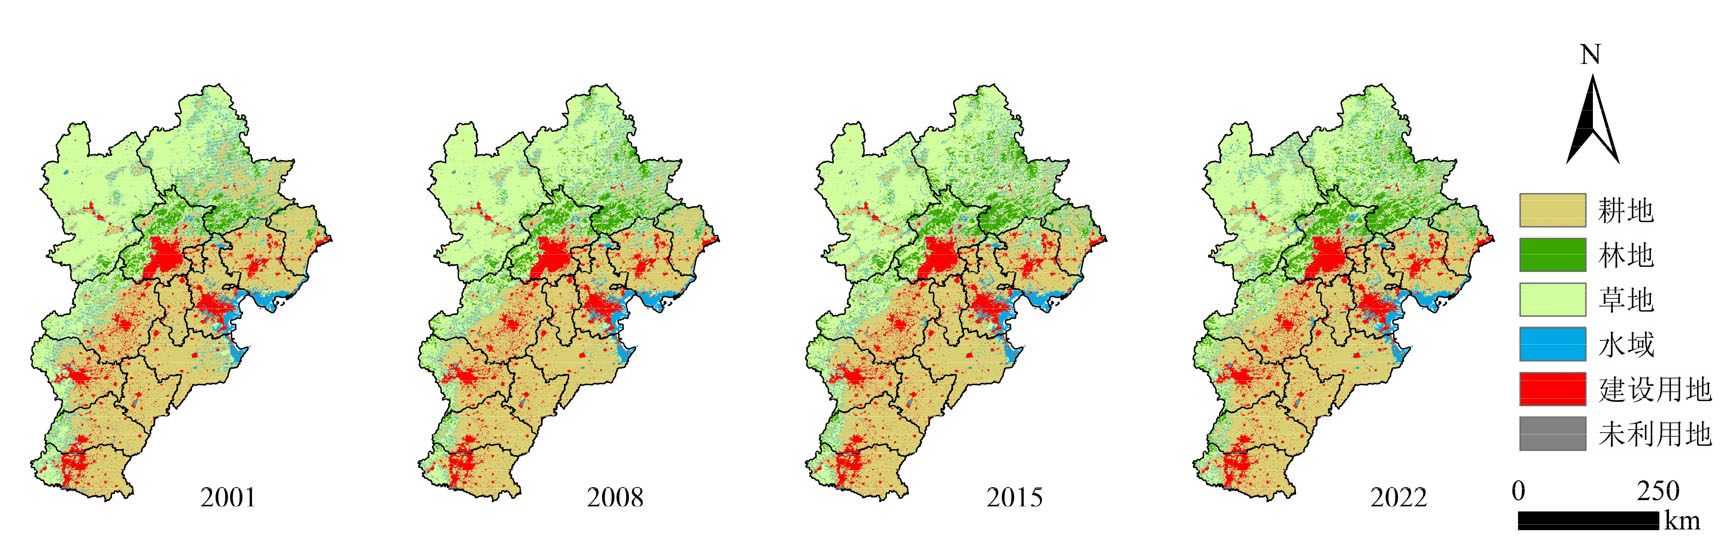
图10 京津冀土地利用现状图
Figure 10 Land use map of Beijing-Tianjin-Hebei
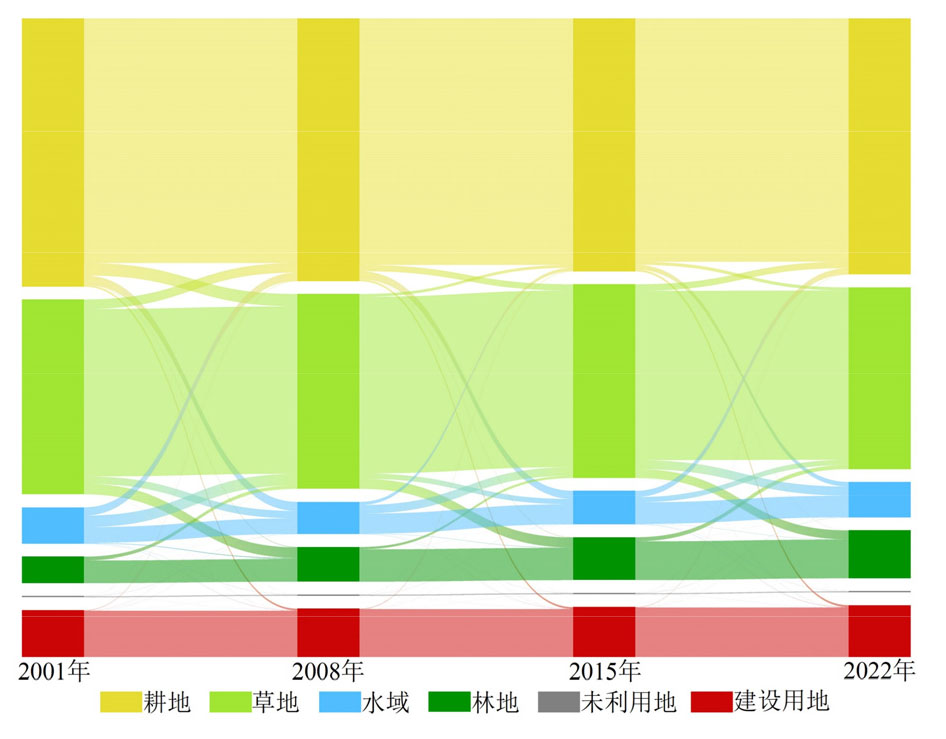
图11 京津冀土地利用转移桑基图
Figure 11 Sangji map of land use transfer in Beijing-Tianjin-Hebei
| 序号 | 起止年月 | 时间长度/ Month | 峰值时间 | 峰值强度/ ℃ | 程度 | 类型 |
|---|---|---|---|---|---|---|
| 1 | 2000年10月− 2001年2月 | 5 | 2000年 12月 | −0.8 | 弱 | 中部型 |
| 2 | 2007年8月− 2008年5月 | 10 | 2008年 1月 | −1.7 | 中等 | 东部型 |
| 3 | 2010年6月− 2011年5月 | 12 | 2010年 12月 | −1.6 | 中等 | 东部型 |
| 4 | 2011年8月− 2012年3月 | 8 | 2011年 12月 | −1.1 | 弱 | 中部型 |
| 5 | 2017年10月− 2018年3月 | 6 | 2018年 1月 | −0.8 | 弱 | 东部型 |
| 6 | 2020年8− 2021年3月 | 8 | 2020年 11月 | −1.3 | 中等 | 东部型 |
| 7 | 2021年9月− 2023年1月 | 17 | 2022年 4月 | −1.2 | 弱 | 东部型 |
表1 研究时段内中国发生的拉尼娜事件及其特征值
Table 1 La ni?a events and characteristic values occurring in China during the study period
| 序号 | 起止年月 | 时间长度/ Month | 峰值时间 | 峰值强度/ ℃ | 程度 | 类型 |
|---|---|---|---|---|---|---|
| 1 | 2000年10月− 2001年2月 | 5 | 2000年 12月 | −0.8 | 弱 | 中部型 |
| 2 | 2007年8月− 2008年5月 | 10 | 2008年 1月 | −1.7 | 中等 | 东部型 |
| 3 | 2010年6月− 2011年5月 | 12 | 2010年 12月 | −1.6 | 中等 | 东部型 |
| 4 | 2011年8月− 2012年3月 | 8 | 2011年 12月 | −1.1 | 弱 | 中部型 |
| 5 | 2017年10月− 2018年3月 | 6 | 2018年 1月 | −0.8 | 弱 | 东部型 |
| 6 | 2020年8− 2021年3月 | 8 | 2020年 11月 | −1.3 | 中等 | 东部型 |
| 7 | 2021年9月− 2023年1月 | 17 | 2022年 4月 | −1.2 | 弱 | 东部型 |
| 区域 | NEP与气温显著 正相关面积占比/% | NEP与降水显著 正相关面积占比/% | 文献来源 |
|---|---|---|---|
| 华北平原 | 4.90 | 44.7 | 曹云等, |
| 黄河流域 | 2.00 | 47.2 | 曹云等, |
| 新疆 | 40.8 | 52.6 | Lu et al., |
| 青藏高原 | 38.5 | 11.7 | 冶晓娟等, |
| 西南地区 | 10.7 | 16.5 | 徐勇等, |
表2 已有研究中NEP与气温、降水显著正相关面积占比
Table 2 Proportion of areas with significant positive correlation of NEP with temperature and precipitation in existing studies
| 区域 | NEP与气温显著 正相关面积占比/% | NEP与降水显著 正相关面积占比/% | 文献来源 |
|---|---|---|---|
| 华北平原 | 4.90 | 44.7 | 曹云等, |
| 黄河流域 | 2.00 | 47.2 | 曹云等, |
| 新疆 | 40.8 | 52.6 | Lu et al., |
| 青藏高原 | 38.5 | 11.7 | 冶晓娟等, |
| 西南地区 | 10.7 | 16.5 | 徐勇等, |
| [1] | BELLARD C, MARINO C, COURCHAMP F, 2022. Ranking threats to biodiversity and why it doesn’t matter[J]. Nature Communications, 13(1): 2616. |
| [2] | BRADSHAW C J A, WARKENTIN I G, 2015. Global estimates of boreal forest carbon stocks and flux[J]. Global and Planetary Change, 128: 24-30. |
| [3] | CHEN Y, LU D G, XU B, et al., 2024. Determining the dominant contributions between direct and indirect impacts of long-term urbanization on plant net primary productivity in Beijing[J]. Remote Sensing, 16(3): 444. |
| [4] | GUO L J, LIU R M, SHOAIB M, et al., 2021. Impacts of landscape change on net primary productivity by integrating remote sensing data and ecosystem model in a rapidly urbanizing region in China[J]. Journal of Cleaner Production, 325: 129314. |
| [5] | HE H L, WANG S Q, ZHANG L, et al., 2019. Altered trends in carbon uptake in China’s terrestrial ecosystems under the enhanced summer monsoon and warming hiatus[J]. National Science Review, 6(3): 505-514. |
| [6] | LI G D, FANG C L, LI Y J, et al., 2022. Global impacts of future urban expansion on terrestrial vertebrate diversity[J]. Nature Communications, 13(1): 1628. |
| [7] | LU X J, CHEN Y, SUN Y Y, et al., 2023. Spatial and temporal variations of net ecosystem productivity in Xinjiang Autonomous Region, China based on remote sensing[J]. Frontiers in Plant Science, 14: 1146388. |
| [8] | MANN H B, 1945. Nonparametric tests against trend[J]. Econometrica, 13(3): 245. |
| [9] | MAURICE G Kendall, 1949. Rank correlation methods[J]. Journal of the Institute of Actuaries, 75(1): 140-141. |
| [10] | NIU L, SHAO Q Q, NING J, et al., 2023. The assessment of ecological restoration effects on Beijing-Tianjin sandstorm source control project area during 2000-2019[J]. Ecological Engineering, 186: 106831. |
| [11] | PEI Z Y, OUYANG H, ZHOU C P, et al., 2009. Carbon balance in an alpine steppe in the Qinghai-Tibet Plateau[J]. Journal of Integrative Plant Biology, 51(5): 521-526. |
| [12] | PENG S Z, DING Y X, LIU W Z, et al., 2019. 1 km monthly temperature and precipitation dataset for China from 1901 to 2017[J]. Earth System Science Data, 11(4): 1931-1946. |
| [13] | PIAO S L, WANG X H, PARK T J, et al., 2019. Characteristics, drivers and feedbacks of global greening[J]. Nature Reviews Earth & Environment, 1(1): 14-27. |
| [14] | PIAO S L, YIN G D, TAN J G, et al., 2015. Detection and attribution of vegetation greening trend in China over the last 30 years[J]. Global Change Biology, 21(4): 1601-1609. |
| [15] |
RAICH J W, RASTETTER E B, MELILLO J M, et al., 1991. Potential net primary productivity in south America: Application of a global model[J]. Ecological Applications, 1(4): 399-429.
DOI PMID |
| [16] | SANDRA B, ARIEL E L, 2017. Trailblazing the Carbon Cycle of Tropical Forests from Puerto Rico[J]. Forests, 8(4): 101. |
| [17] | SEN P K, 1968. Estimates of the regression coefficient based on kendall’s tau[J]. Journal of the American Statistical Association, 63(324): 1379-1389. |
| [18] | SHUAI C Y, CHEN X, WU Y, et al., 2018. Identifying the key impact factors of carbon emission in China: Results from a largely expanded pool of potential impact factors[J]. Journal of Cleaner Production, 175: 612-623. |
| [19] | SULLIVAN M J P, TALBOT J, LEWIS S L, 2017. Diversity and carbon storage across the tropical forest biome[J]. Scientific Reports, 7(1): 39102. |
| [20] | WHITE A, CANNELL M G R, FRIEND A D, 2000. CO2 stabilization, climate change and the terrestrial carbon sink[J]. Global Change Biology, 6(7): 817-833. |
| [21] | ZHANG J P, WANG J, CHEN Y H, et al., 2023. Spatiotemporal variation and prediction of NPP in beijing-tianjin- hebei region by coupling PLUS and CASA models[J]. Ecological Informatics, 81: 102620. |
| [22] | ZOU C, LI H, CHEN D H, et al., 2022. Spatial-Temporal Changes of Carbon Source/Sink in Terrestrial Vegetation Ecosystem and Response to Meteorological Factors in Yangtze River Delta Region (China)[J]. Sustainability, 14(16): 10051. |
| [23] |
曹云, 孙应龙, 姜月清, 等, 2022. 黄河流域净生态系统生产力的时空分异特征及其驱动因子分析[J]. 生态环境学报, 31(11): 2101-2110.
DOI |
| CAO Y, SUN Y L, JIANG Y Q, et al., 2022. Analysis on temporal-spatial variations and driving factors of net ecosystem productivity in the Yellow River Basin[J]. Ecology and Environmental Sciences, 31(11): 2101-2110. | |
| [24] | 曹云, 张称意, 孙应龙, 等, 2023. 2000-2020年华北地区植被固碳能力时空变化特征及其气象影响分析[J]. 生态学报, 43(9): 3488-3499. |
| CAO Y, ZHANG C Y, SUN Y L, et al., 2023. Spatial and temporal patterns of carbon sequestration and their responses to climatic factors in north China from 2000 to 2020[J]. Acta Ecologica Sinica, 43(9): 3488-3499. | |
| [25] |
崔林丽, 史军, 肖风劲, 2018. 气候要素及EI Niño/La Niña事件对中国陆地NPP变化的影响[J]. 地理学报, 73(1): 54-66.
DOI |
|
CUI L L, SHI J, XIAO F J, et al., 2018. Impacts of climatic factors and El Niño/La Niña events on the changes of terrestrial ecosystem NPP in China[J]. Acta Geographica Sinica, 73(1): 54-66.
DOI |
|
| [26] | 方精云, 柯金虎, 唐志尧, 等, 2001. 生物生产力的 “4P” 概念、估算及其相互关系[J]. 植物生态学报, 25(4): 414-419. |
| FANG J Y, KE J H, TANG Z Y, et al., 2001. Implications and estimations of four terrestrial productivity parameters[J]. Acta Phytoecologica Sinica, 25(4): 414-419. | |
| [27] | 李卓, 孙然好, 张继超, 等, 2017. 京津冀城市群地区植被覆盖动态变化时空分析[J]. 生态学报, 37(22): 7418-7426. |
| LI Z, SUN R H, ZHANG J C, et al., 2017. Temporal-spatial analysis of vegetation coverage dynamics in Beijing-Tianjin-Hebei metropolitan regions[J]. Acta Ecologica Sinica, 37(22): 7418-7426. | |
| [28] |
孟丹, 李小娟, 宫辉力, 等, 2015. 京津冀地区NDVI变化及气候因子驱动分析[J]. 地球信息科学学报, 17(8): 1001-1007.
DOI |
| MENG D, LI X J, GONG H L, et al., 2015. Analysis of spatial-temporal change of NDVI and its climatic driving factors in Beijing-Tianjin-Hebei metropolis circle from 2001 to 2013[J]. Journal of Geo-information Science, 17(8): 1001-1007. | |
| [29] | 王菲, 曹永强, 周姝含, 等, 2023. 黄河流域生态功能区植被碳汇估算及其主要气象要素分析[J]. 生态学报, 43(6): 1-14. |
| WANG F, CAO Y Q, ZHOU S H, et al., 2023. Estimation of vegetation carbon sink in the Yellow River Basin ecological function area and analysis of its main meteorological elements[J]. Acta Ecologica Sinica, 43(6): 1-14. | |
| [30] | 王锴, 朴世龙, 何悦, 等, 2023. 中国陆地生态系统碳汇稳定性的空间分布特征及驱动机制[J]. 中国科学: 地球科学, 53(2): 216-226. |
| WANG K, PIAO S L, HE Y, et al., 2023. Spatial variations and mechanisms for the stability of terrestrial carbon sink in China[J]. Science China Earth Sciences, 53(2): 216-226. | |
| [31] | 吴东清, 2024. 区域碳源汇时空特征分析及碳平衡分区研究[D]. 兰州: 兰州交通大学: 1-71. |
| WU D Q, 2024. Research on spatio-temporal characteristics of regional carbon sources and sinks and carbon balance zoning[D]. Lanzhou: Lanzhou Jiaotong University: 1-71. | |
| [32] | 徐勇, 黄雯婷, 郭振东, 等, 2023. 2000-2020年我国西南地区植被NEP时空变化及其驱动因素的相对贡献[J]. 环境科学研究, 36(3): 557-570. |
| XU Y, HUANG W T, GUO Z D, et al., 2023. Spatio-Temporal Variation of Vegetation Net Ecosystem Productivity and Relative Contribution of Driving Forces in Southwest China from 2000 to 2020[J]. Research of Environmental Sciences, 36(3): 557-570. | |
| [33] |
阎世杰, 王欢, 焦珂伟, 2019. 京津冀地区植被时空动态及定量归因[J]. 地球信息科学学报, 21(5): 767-780.
DOI |
| YAN S J, WANG H, JIAO K W, et al., 2019. Spatiotemporal Dynamics of NDVI in the Beijing-Tianjin-Hebei Region based on MODIS Data and Quantitative Attribution[J]. Journal of Geo-information Science, 21(5): 767-780. | |
| [34] | 杨元合, 石岳, 孙文娟, 等, 2022. 中国及全球陆地生态系统碳源汇特征及其对碳中和的贡献[J]. 中国科学: 生命科学, 52(4): 534-574. |
| YANG Y H, SHI Y, SUN W J, et al., 2022. Terrestrial carbon sinks in China and around the world and their contribution to carbon neutrality[J]. Science China Life Sciences, 52(4): 534-574. | |
| [35] |
冶晓娟, 王永辉, 潘红忠, 等, 2022. 青海省植被NEP时空变化及驱动因素分析[J]. 干旱区研究, 39(5): 1673-1683.
DOI |
|
YE X J, WANG Y H, PAN H Z, et al., 2022. Spatial-temporal variation and driving factors of vegetation net ecosystem productivity in Qinghai Province[J]. Arid Zone Research, 39(5): 1673-1683.
DOI |
|
| [36] | 张筠, 张春华, 张安定, 等, 2020. 水热波动和土地覆盖变化对东北地区植被NPP的相对影响[J]. 生态学报, 40(21): 7733-7744. |
| ZHANG J, ZHANG C H, ZHANG A D, et al., 2020. Relative effects of hydrothermal fluctuation and land cover changes on vegetation net primary productivity in Northeast China[J]. Acta Ecologica Sinica, 40(21): 7733-7744. | |
| [37] |
张鹏骞, 胡理乐, 白加德, 2021. 京津冀地区近20年NDVI时空变化特征[J]. 生态环境学报, 30(1): 29-36.
DOI |
| ZHANG P Q, HU L L, BAI J D, 2021. Spatiotemporal variation of NDVI in Beijing-Tianjin-Hebei region in the past 20 years[J]. Ecology and Environmental Sciences, 30(1): 29-36. | |
| [38] | 张祯祺, 蔡惠文, 张平平, 等, 2023. 基于GEE遥感云平台的三江源植被碳源/汇时空变化研究[J]. 自然资源遥感, 35(1): 231-242. |
| ZHANG Z Q, CAI H W, ZHANG P P, et al., 2023. Temporal and spatial variation of vegetation carbon source/sink in the Three-River Headwaters region based on GEE[J]. Remote Sensing for Natural Resources, 35(1): 231-242. | |
| [39] | 赵成义, 2007. 陆地不同生态系统土壤呼吸及土壤碳循环研究[D]. 北京: 中国农业科学院: 1-217. |
| ZHAO C Y, 2007. Study on soil respiration and soil carbon cycle of different terrestrial ecosystem[D]. Beijing: Chinese Academy of Agricultural Sciences: 1-217. | |
| [40] | 赵宁, 周蕾, 庄杰, 等, 2021. 中国陆地生态系统碳源/汇整合分析[J]. 生态学报, 41(19): 7648-7658. |
| ZHAO N, ZHOU L, ZHUANG J, et al., 2021. Integration analysis of the carbon sources and sinks in terrestrial ecosystems, China[J]. Acta Ecologica Sinica, 41(19): 7648-7658. |
| [1] | 王捷纯, 邓玉娇, 朱怀卫, 孔蕴淇. 广东省不同生态系统植被NPP时空变化及对气候因子的响应[J]. 生态环境学报, 2024, 33(6): 831-840. |
| [2] | 陈晓辉, 胡喜生. 耦合ER和GWR的福州市生态环境质量的驱动力分析[J]. 生态环境学报, 2024, 33(5): 812-823. |
| [3] | 张淼, 王桂霞, 王昌伟, 贺艳云, 许艳芳, 李琪, 许杨, 张俊骁, 张桂芹. 济南市区黑碳污染变化特征及来源解析[J]. 生态环境学报, 2024, 33(4): 560-572. |
| [4] | 杨非凡, 何浩. 基于“EVI-ESV”伊犁河谷生态环境评估及生态分区构建[J]. 生态环境学报, 2024, 33(4): 655-664. |
| [5] | 李霞, 陈永昊, 陈喆, 张国壮, 唐梦雅. 中国沿海地区植被NDVI时空变化及驱动力分析[J]. 生态环境学报, 2024, 33(2): 180-191. |
| [6] | 翁升恒, 张玉琴, 姜冬昕, 潘卫华, 李丽纯, 张方敏. 福建省森林植被NEP时空变化及影响因子分析[J]. 生态环境学报, 2023, 32(5): 845-856. |
| [7] | 于菲, 曾海龙, 房怀阳, 付玲芳, 林澍, 董家豪. 典型感潮河网浮游藻类功能群时空变化特征及水质评价[J]. 生态环境学报, 2023, 32(4): 756-765. |
| [8] | 郝金虎, 韦玮, 李胜男, 马牧源, 李肖夏, 杨洪国, 姜琦宇, 柴沛东. 基于GEE平台的京津冀长时序水体时空格局及其影响因素[J]. 生态环境学报, 2023, 32(3): 556-566. |
| [9] | 孙正, 曹亚非, 王德彩, 刘峰, 宋效东, 张甘霖, 吴华勇. 近30年京津冀电镀场地时空演变特征及趋势预测[J]. 生态环境学报, 2023, 32(1): 183-194. |
| [10] | 李梦华, 韩颖娟, 赵慧, 王云霞. 基于地理探测器的宁夏植被覆盖度时空变化特征及其驱动因子分析[J]. 生态环境学报, 2022, 31(7): 1317-1325. |
| [11] | 郝永佩, 宋晓伟, 赵文珺, 向发敏. 汾渭平原大气污染时空分布及相关因子分析[J]. 生态环境学报, 2022, 31(3): 512-523. |
| [12] | 石智宇, 王雅婷, 赵清, 张连蓬, 朱长明. 2001-2020年中国植被净初级生产力时空变化及其驱动机制分析[J]. 生态环境学报, 2022, 31(11): 2111-2123. |
| [13] | 曹云, 孙应龙, 姜月清, 万君. 黄河流域净生态系统生产力的时空分异特征及其驱动因子分析[J]. 生态环境学报, 2022, 31(11): 2101-2110. |
| [14] | 付乐, 迟妍妍, 于洋, 张丽苹, 刘斯洋, 王夏晖, 许开鹏, 王晶晶, 张信. 2000—2020年黄河流域土地利用变化特征及影响因素分析[J]. 生态环境学报, 2022, 31(10): 1927-1938. |
| [15] | 余玉洋, 宋丰艺, 张世杰. 2000—2020年河南省NDVI时空变化及其驱动因素定量分析[J]. 生态环境学报, 2022, 31(10): 1939-1950. |
| 阅读次数 | ||||||
|
全文 |
|
|||||
|
摘要 |
|
|||||