生态环境学报 ›› 2024, Vol. 33 ›› Issue (4): 560-572.DOI: 10.16258/j.cnki.1674-5906.2024.04.007
张淼1( ), 王桂霞1, 王昌伟1, 贺艳云2, 许艳芳1, 李琪1, 许杨1, 张俊骁3, 张桂芹3,*()
收稿日期:2023-12-09
出版日期:2024-04-18
发布日期:2024-05-31
通讯作者:
*张桂芹。E-mail: zhangguiqin320@163.com作者简介:张淼(1979年生),男,高级工程师,硕士,研究方向为环境空气质量监测。E-mail: zhangmiao@shandong.cn
基金资助:
ZHANG Miao1(), WANG Guixia1, WANG Changwei1, HE Yanyun2, XU Yanfang1, LI Qi1, XU Yang1, ZHANG Junxiao3, ZHANG Guiqin3,*()
Received:2023-12-09
Online:2024-04-18
Published:2024-05-31
摘要:
黑碳(BC)作为细颗粒物(PM2.5)的重要来源之一,探究其变化特征及来源对PM2.5管控具有指导意义。为了研究济南市区大气黑碳颗粒物污染变化特征及来源,于2020年1月-2021年12月在济南市区选择市中心站(1#)利用Magee公司AE33型黑碳仪对黑碳浓度展开了在线连续观测,还开展了PM2.5、氮氧化物(NOx)、一氧化碳(CO)质量浓度的同步在线观测,获得了市区黑碳浓度变化特征,探究了BC与主要大气污染物的关系,并结合省中心站(2#)BC监测,定量解析了济南市区BC排放来源的日变化特征,同时选取典型污染过程研究不同排放源黑碳的传输影响。结果表明,整个观测时段1# BC平均质量浓度为 (1.86±1.21) μg·m-3,BC与PM2.5和CO呈正相关关系。BC质量浓度呈现明显的年、季节、周和日变化特征,2021年BC较2020年下降约0.28 μg·m-3,下降比例为14%,BC质量浓度春 (1.47±0.51) μg·m-3<夏 (1.60±0.43) μg·m-3<秋 (1.99±0.77) μg·m-3<冬 (2.48±1.17) μg·m-3;BC受交通早晚高峰的影响呈现双峰型日变化特征,春夏季周末浓度高于工作日,具有比较明显的“周末效应”。源解析结果表明,交通排放为BC主要来源,2020年和2021年BC交通源贡献均值占比 (BCtraffic/BC)夏 (0.81)>秋 (0.79)>春 (0.76)>冬 (0.67),不同季节BCtraffic日变化特征也证实了交通源对BC贡献占主导作用,2#省中心站与1#市中心站变化相似,但受交通流量与工业源影响BC浓度通常高于1#市中心站,典型PM2.5污染期间BC除受近距离局地排放源影响外,还有济南北部、德州市和河北衡水市传输影响。风场对BCtraffic和BCnontraffic浓度的影响显示该站点以周边源排放为主,BCtraffic受西南方向的旅游路隧道及东北方向舜华路等交通繁忙路段排放影响明显。
中图分类号:
张淼, 王桂霞, 王昌伟, 贺艳云, 许艳芳, 李琪, 许杨, 张俊骁, 张桂芹. 济南市区黑碳污染变化特征及来源解析[J]. 生态环境学报, 2024, 33(4): 560-572.
ZHANG Miao, WANG Guixia, WANG Changwei, HE Yanyun, XU Yanfang, LI Qi, XU Yang, ZHANG Junxiao, ZHANG Guiqin. Characteristics and Source Analysis of Black Carbon Pollution Changes in Ji’nan City[J]. Ecology and Environment, 2024, 33(4): 560-572.
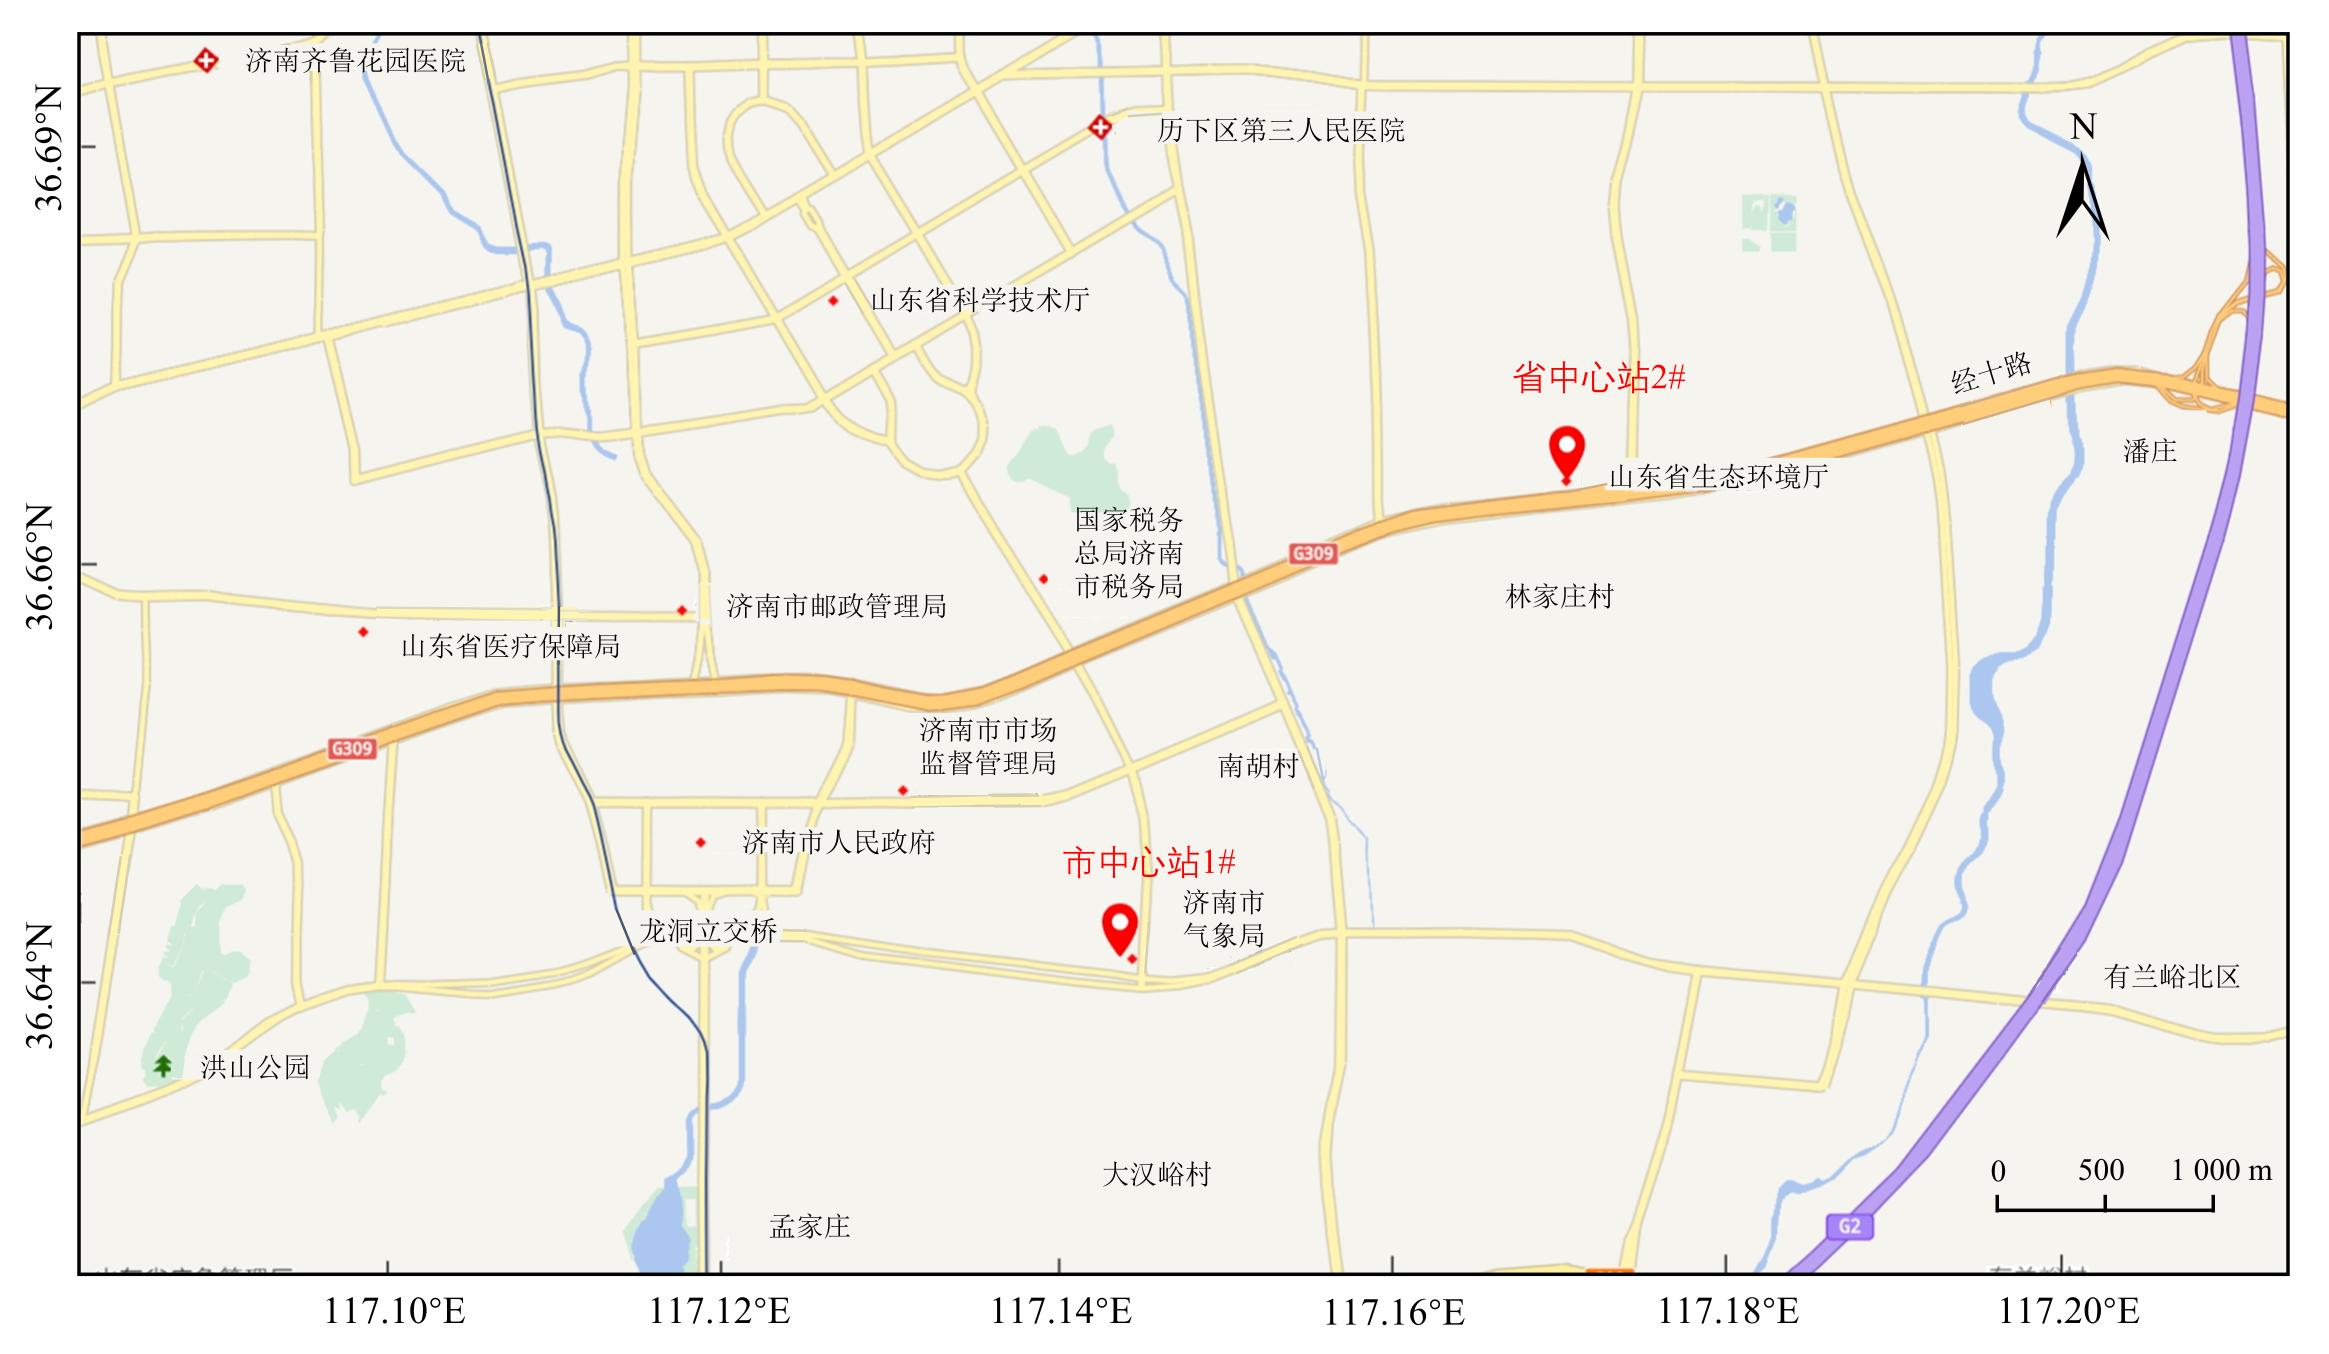
图1 观测点位置
Figure 1 Location of the sampling sites
| 季节 | 采样时间 |
|---|---|
| 春季 | 2020年3月16日-5月31日、2021年3月16日-5月31日 |
| 夏季 | 2020年6月1日-8月31日、2021年6月1日-8月31日 |
| 秋季 | 2020年9月1日-11月15日、2021年9月1日-11月15日 |
| 冬季 | 2020年1月1日-3月15日、2020年11月16日-12月31日、2021年1月1日-3月15日、2021年11月16日-12月31日 |
表1 黑碳浓度观测的季节划分
Table 1 Seasonal division of BC concentration observation
| 季节 | 采样时间 |
|---|---|
| 春季 | 2020年3月16日-5月31日、2021年3月16日-5月31日 |
| 夏季 | 2020年6月1日-8月31日、2021年6月1日-8月31日 |
| 秋季 | 2020年9月1日-11月15日、2021年9月1日-11月15日 |
| 冬季 | 2020年1月1日-3月15日、2020年11月16日-12月31日、2021年1月1日-3月15日、2021年11月16日-12月31日 |
| 观测时段 | 城市 | ρBC (均值±标准偏差)/(μg·m-3) | 观测设备 | 参考文献 |
|---|---|---|---|---|
| 2020年1月-2021年12月 | 济南 (中国) | 1.86±1.21 | AE33 | 本研究 |
| 2014年 | 北京 (中国) | 11.35±5.2 | AE51 | 严晗等, |
| 2018年 | 西安 (中国) | 1.3‒3.6 | AE51 | 吴创等, |
| 2017年12月-2020年8-10月 | 上海 (中国) | 1.51±0.989 | AE31 | Jia et al., |
| 2015年1-12月 | 烟台 (中国) | 1.4±0.9 (DH站点); 3.2±2.2 (HW站点) | AE33 | Tang et al., |
| 2017年1月 | 曼谷 (泰国) | 4.5±1.9 | AE42 | Phanukarn et al., |
| 2017年6-7月 | 多伦多 (加拿大) | 0.5‒2 (NR-Tor-2站点) | AE33 | Evans et al., |
| 2017年3月-2018年3月; 2017年7月-2018年7月 | 德黑兰 (伊朗) | 4.69‒7.48 (白天); 8.06‒14.2 (夜晚) | AE33、AE31 | Taheri et al., |
| 2015年10月 | 赫尔辛基 (芬兰) | 0.90±0.74 | AE33 | Blanco-alegre et al., |
| 2009年 | 米兰 (意大利) | 3.1±1.7 (管控区); 6.3±2.9 (非管控区) | AE51 | Invernizzi et al., |
| 2013年2月1-8日 | 布拉加 (葡萄牙) | 21±10 (隧道) | AE31 | Blanco-alegre et al., |
表2 不同城市黑碳质量浓度比较
Table 2 Comparison of atmospheric BC concentrations measured at different cities across the world in recent studies
| 观测时段 | 城市 | ρBC (均值±标准偏差)/(μg·m-3) | 观测设备 | 参考文献 |
|---|---|---|---|---|
| 2020年1月-2021年12月 | 济南 (中国) | 1.86±1.21 | AE33 | 本研究 |
| 2014年 | 北京 (中国) | 11.35±5.2 | AE51 | 严晗等, |
| 2018年 | 西安 (中国) | 1.3‒3.6 | AE51 | 吴创等, |
| 2017年12月-2020年8-10月 | 上海 (中国) | 1.51±0.989 | AE31 | Jia et al., |
| 2015年1-12月 | 烟台 (中国) | 1.4±0.9 (DH站点); 3.2±2.2 (HW站点) | AE33 | Tang et al., |
| 2017年1月 | 曼谷 (泰国) | 4.5±1.9 | AE42 | Phanukarn et al., |
| 2017年6-7月 | 多伦多 (加拿大) | 0.5‒2 (NR-Tor-2站点) | AE33 | Evans et al., |
| 2017年3月-2018年3月; 2017年7月-2018年7月 | 德黑兰 (伊朗) | 4.69‒7.48 (白天); 8.06‒14.2 (夜晚) | AE33、AE31 | Taheri et al., |
| 2015年10月 | 赫尔辛基 (芬兰) | 0.90±0.74 | AE33 | Blanco-alegre et al., |
| 2009年 | 米兰 (意大利) | 3.1±1.7 (管控区); 6.3±2.9 (非管控区) | AE51 | Invernizzi et al., |
| 2013年2月1-8日 | 布拉加 (葡萄牙) | 21±10 (隧道) | AE31 | Blanco-alegre et al., |

图2 夏季、冬季BC与PM2.5、CO相关性
Figure 2 Correlation between BC and PM2.5, CO during summer and winter
| 季节 | BC/CO | BC/PM2.5 | |||||
|---|---|---|---|---|---|---|---|
| 检验统计量值/103 | p值 | Bonferroni校正p值 | 检验统计量值/103 | p值 | Bonferroni校正p值 | ||
| 春-夏 | -3.18 | 0.000*1) | 0.000* | -2.67 | 0.000* | 0.000* | |
| 春-秋 | -4.74 | 0.000* | 0.000* | -2.68 | 0.000* | 0.000* | |
| 春-冬 | -3.25 | 0.000* | 0.000* | 0.779 | 0.000* | 0.000* | |
| 夏-秋 | -1.56 | 0.000* | 0.000* | -0.018 | 0.868 | 1.000 | |
| 夏-冬 | -0.074 | 0.449 | 1.000 | 3.45 | 0.000* | 0.000* | |
| 秋-冬 | -1.49 | 0.000* | 0.000* | 3.46 | 0.000* | 0.000* | |
表3 基于Kruskal-Wallis检验BC/CO和BC/PM2.5季节差异结果
Table 3 Results of Kruskal-Wallis test for seasonal differences in BC/CO and BC/PM2.5
| 季节 | BC/CO | BC/PM2.5 | |||||
|---|---|---|---|---|---|---|---|
| 检验统计量值/103 | p值 | Bonferroni校正p值 | 检验统计量值/103 | p值 | Bonferroni校正p值 | ||
| 春-夏 | -3.18 | 0.000*1) | 0.000* | -2.67 | 0.000* | 0.000* | |
| 春-秋 | -4.74 | 0.000* | 0.000* | -2.68 | 0.000* | 0.000* | |
| 春-冬 | -3.25 | 0.000* | 0.000* | 0.779 | 0.000* | 0.000* | |
| 夏-秋 | -1.56 | 0.000* | 0.000* | -0.018 | 0.868 | 1.000 | |
| 夏-冬 | -0.074 | 0.449 | 1.000 | 3.45 | 0.000* | 0.000* | |
| 秋-冬 | -1.49 | 0.000* | 0.000* | 3.46 | 0.000* | 0.000* | |
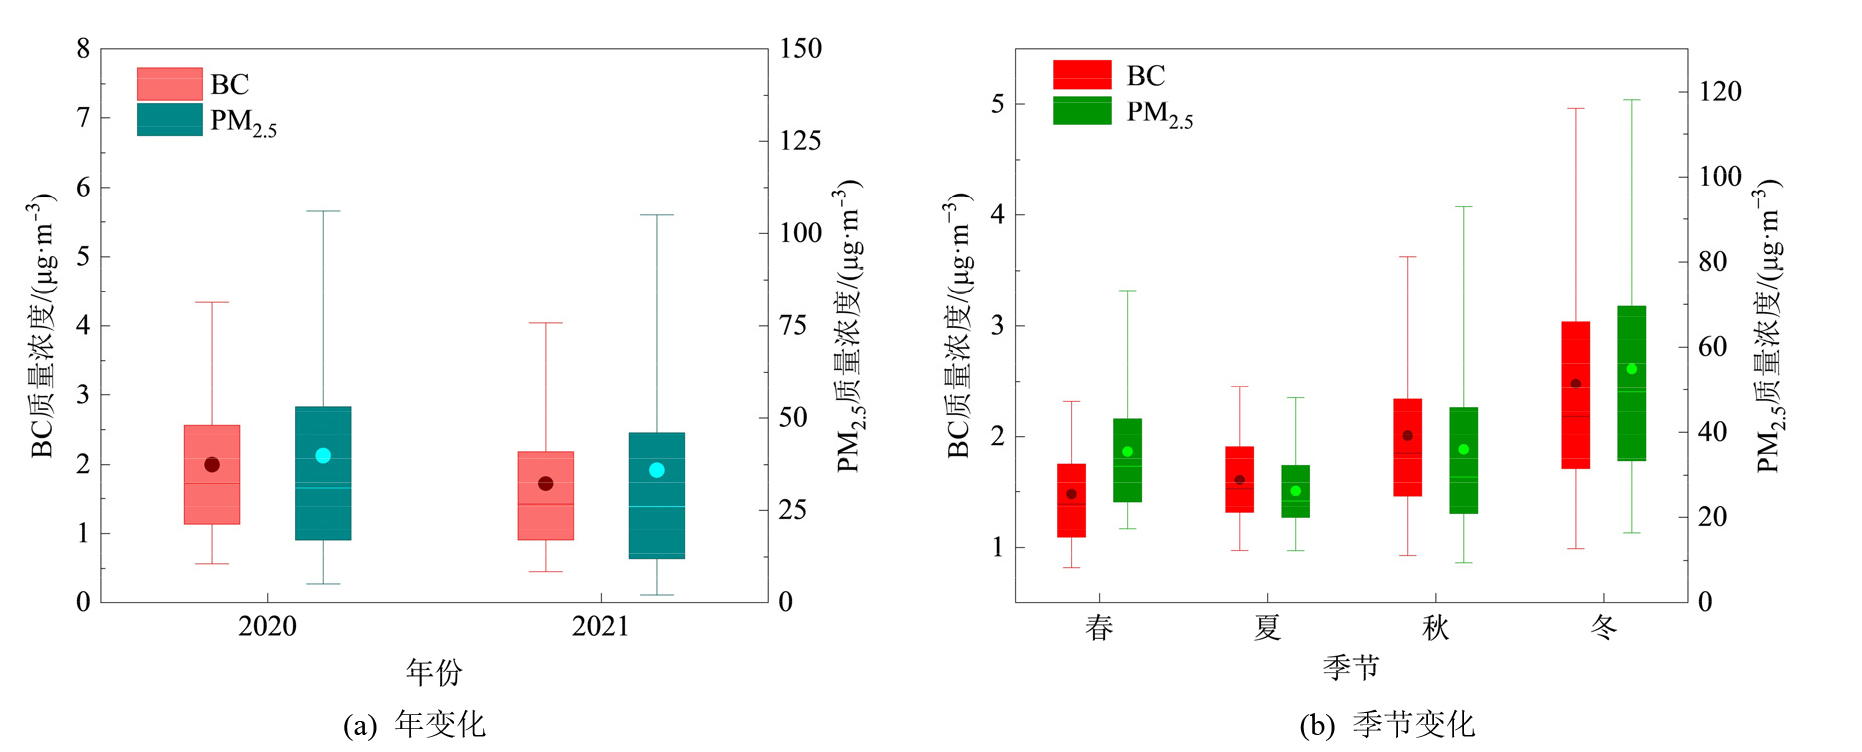
图3 BC和PM2.5质量浓度年、季节变化 箱线图箱体底部、顶部及箱体中间横线分别为5%、95%分位数及中值,圆点为平均值
Figure 3 Annual and seasonal variations of BC and PM2.5 mass concentration
| 季节 | BC | PM2.5 | |||||
|---|---|---|---|---|---|---|---|
| 检验统计量值/103 | p值 | Bonferroni校正p值 | 检验统计量值/103 | p值 | Bonferroni校正p值 | ||
| 春-夏 | -1.09 | 0.000*1) | 0.000* | 0.999 | 0.000* | 0.000* | |
| 春-秋 | -2.34 | 0.000* | 0.000* | 0.260 | 0.026* | 0.156 | |
| 春-冬 | -3.04 | 0.000* | 0.000* | -2.29 | 0.000* | 0.000* | |
| 夏-秋 | -1.25 | 0.000* | 0.000* | -0.739 | 0.000* | 0.000* | |
| 夏-冬 | -1.94 | 0.000* | 0.000* | -3.27 | 0.000* | 0.000* | |
| 秋-冬 | -0.693 | 0.000* | 0.000* | -2.55 | 0.000* | 0.000* | |
表4 基于Kruskal-Wallis检验BC、PM2.5小时质量浓度季节差异结果
Table 4 Results of Kruskal-Wallis test for seasonal differences in BC, PM2.5 hourly mass concentration
| 季节 | BC | PM2.5 | |||||
|---|---|---|---|---|---|---|---|
| 检验统计量值/103 | p值 | Bonferroni校正p值 | 检验统计量值/103 | p值 | Bonferroni校正p值 | ||
| 春-夏 | -1.09 | 0.000*1) | 0.000* | 0.999 | 0.000* | 0.000* | |
| 春-秋 | -2.34 | 0.000* | 0.000* | 0.260 | 0.026* | 0.156 | |
| 春-冬 | -3.04 | 0.000* | 0.000* | -2.29 | 0.000* | 0.000* | |
| 夏-秋 | -1.25 | 0.000* | 0.000* | -0.739 | 0.000* | 0.000* | |
| 夏-冬 | -1.94 | 0.000* | 0.000* | -3.27 | 0.000* | 0.000* | |
| 秋-冬 | -0.693 | 0.000* | 0.000* | -2.55 | 0.000* | 0.000* | |
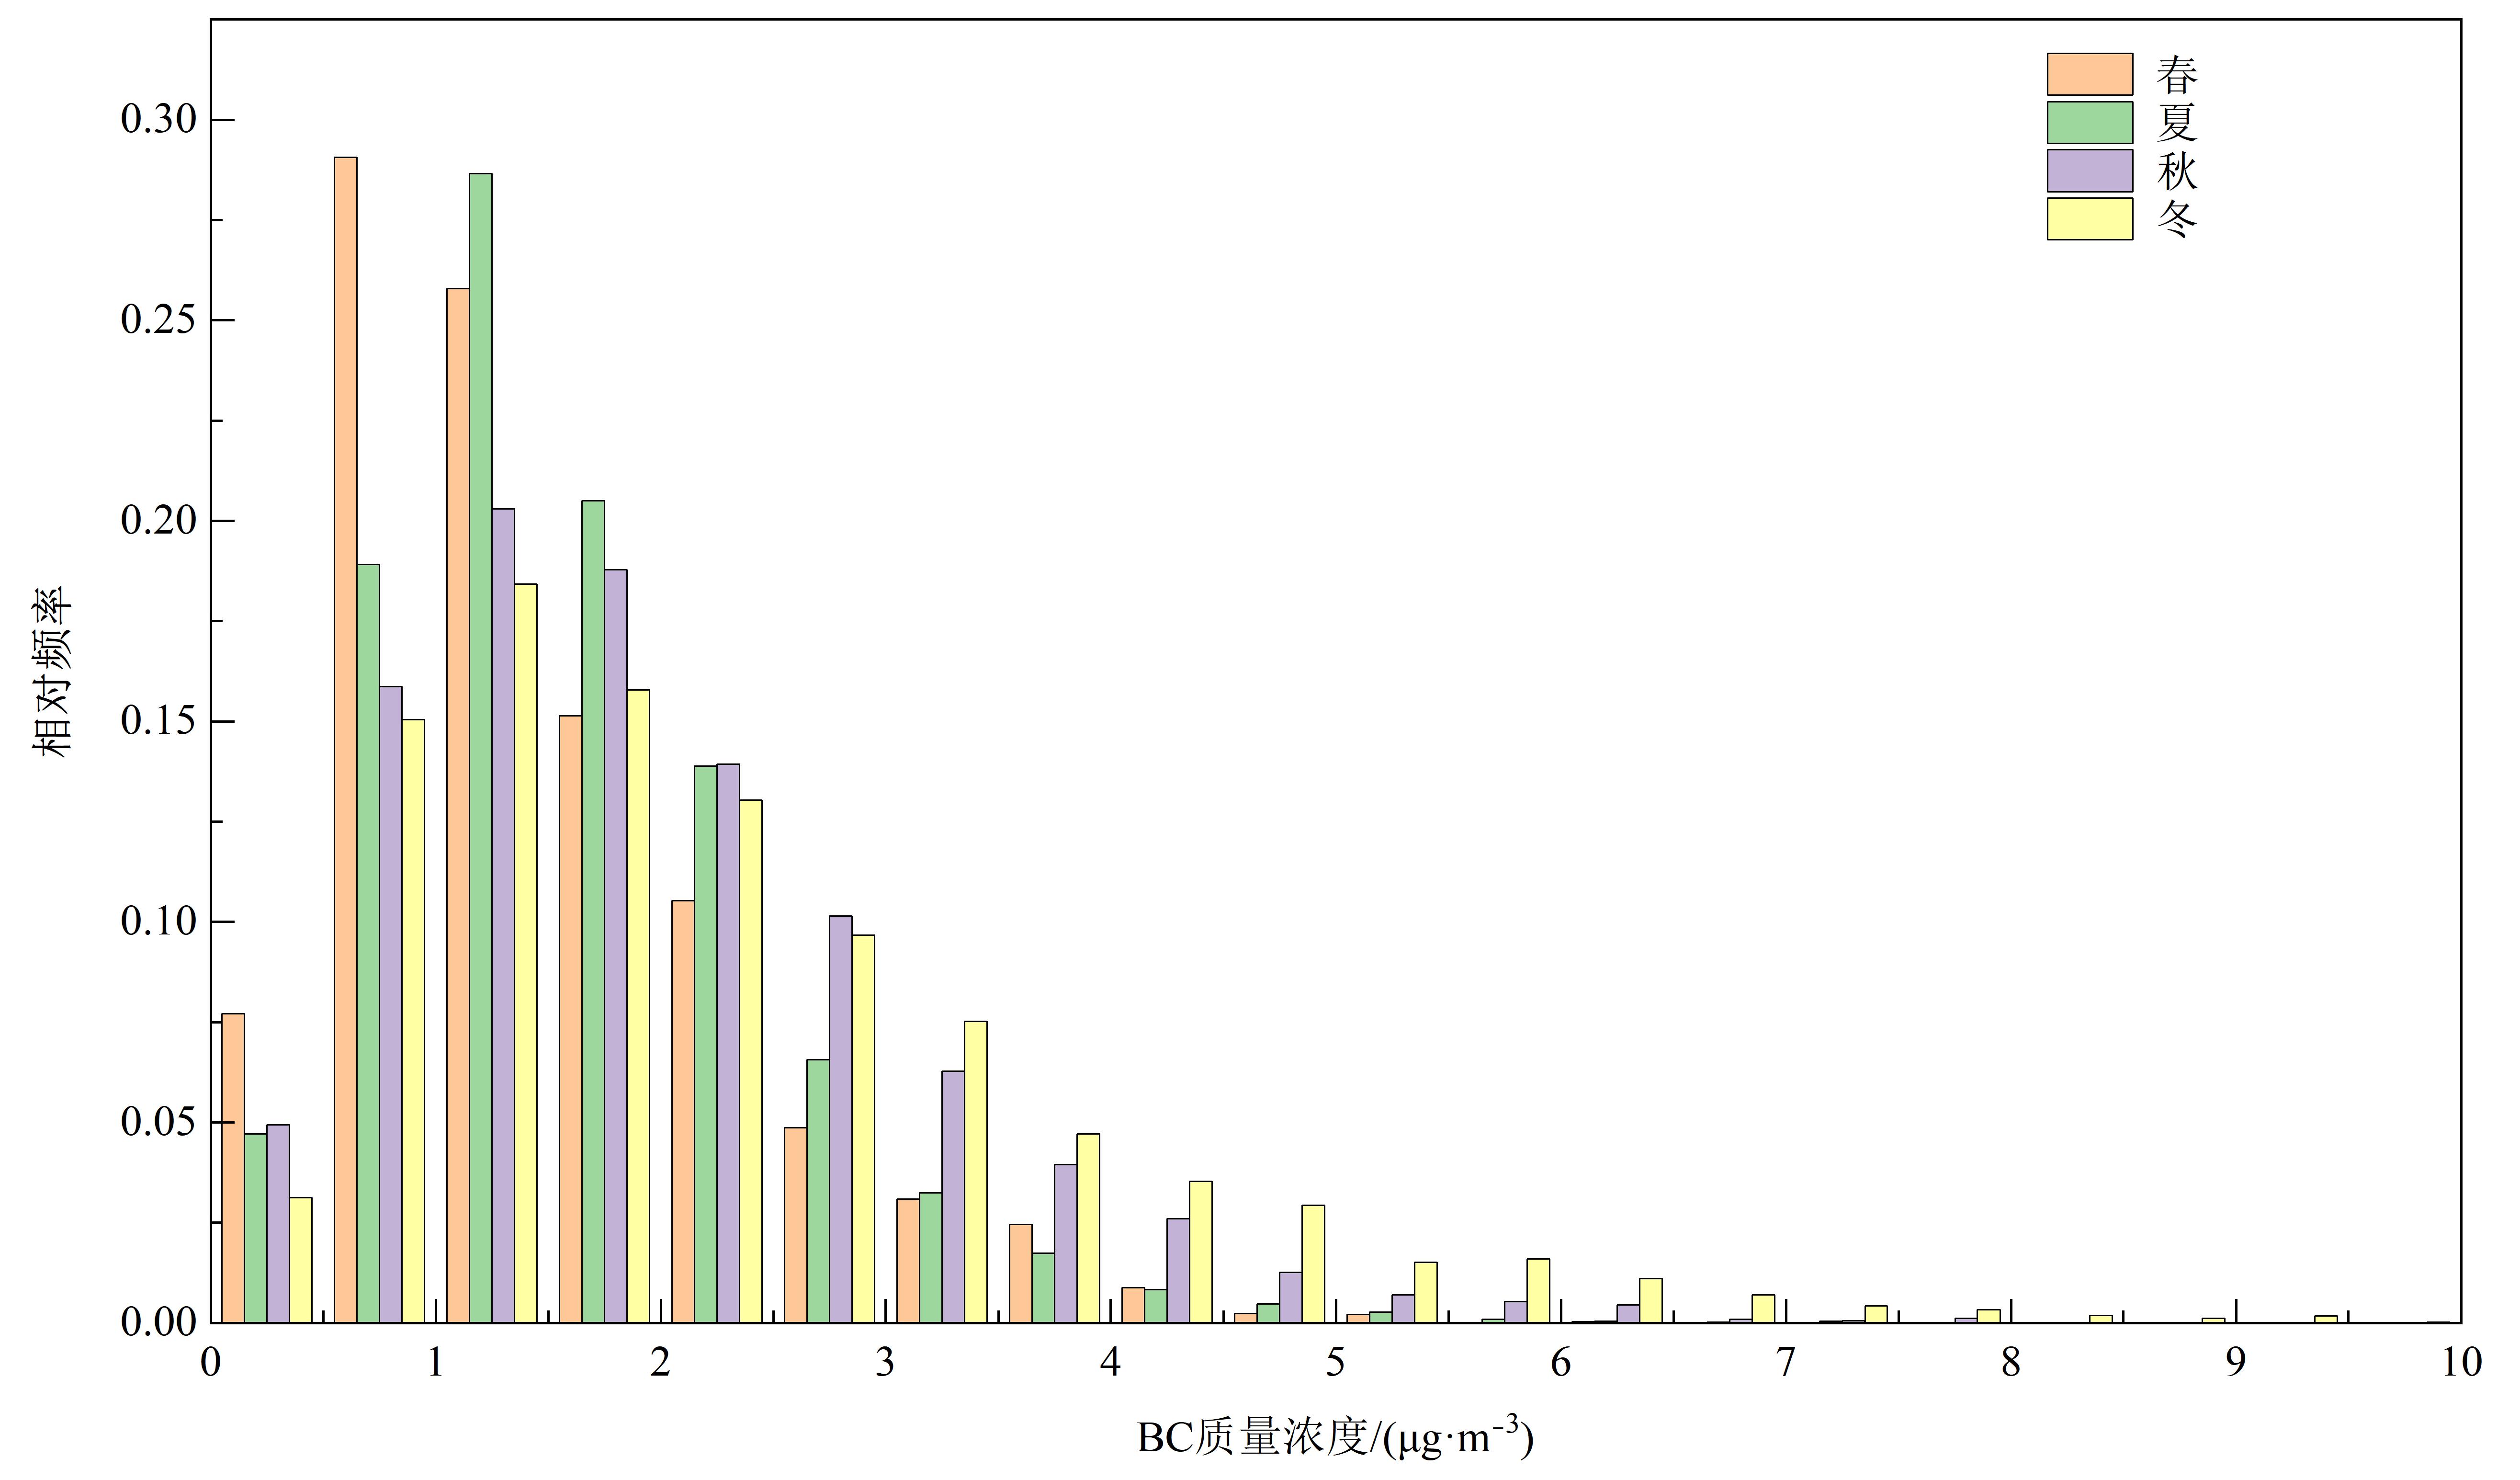
图4 不同季节BC质量浓度的频率分布
Figure 4 Frequency distribution of BC mass concentration in different seasons
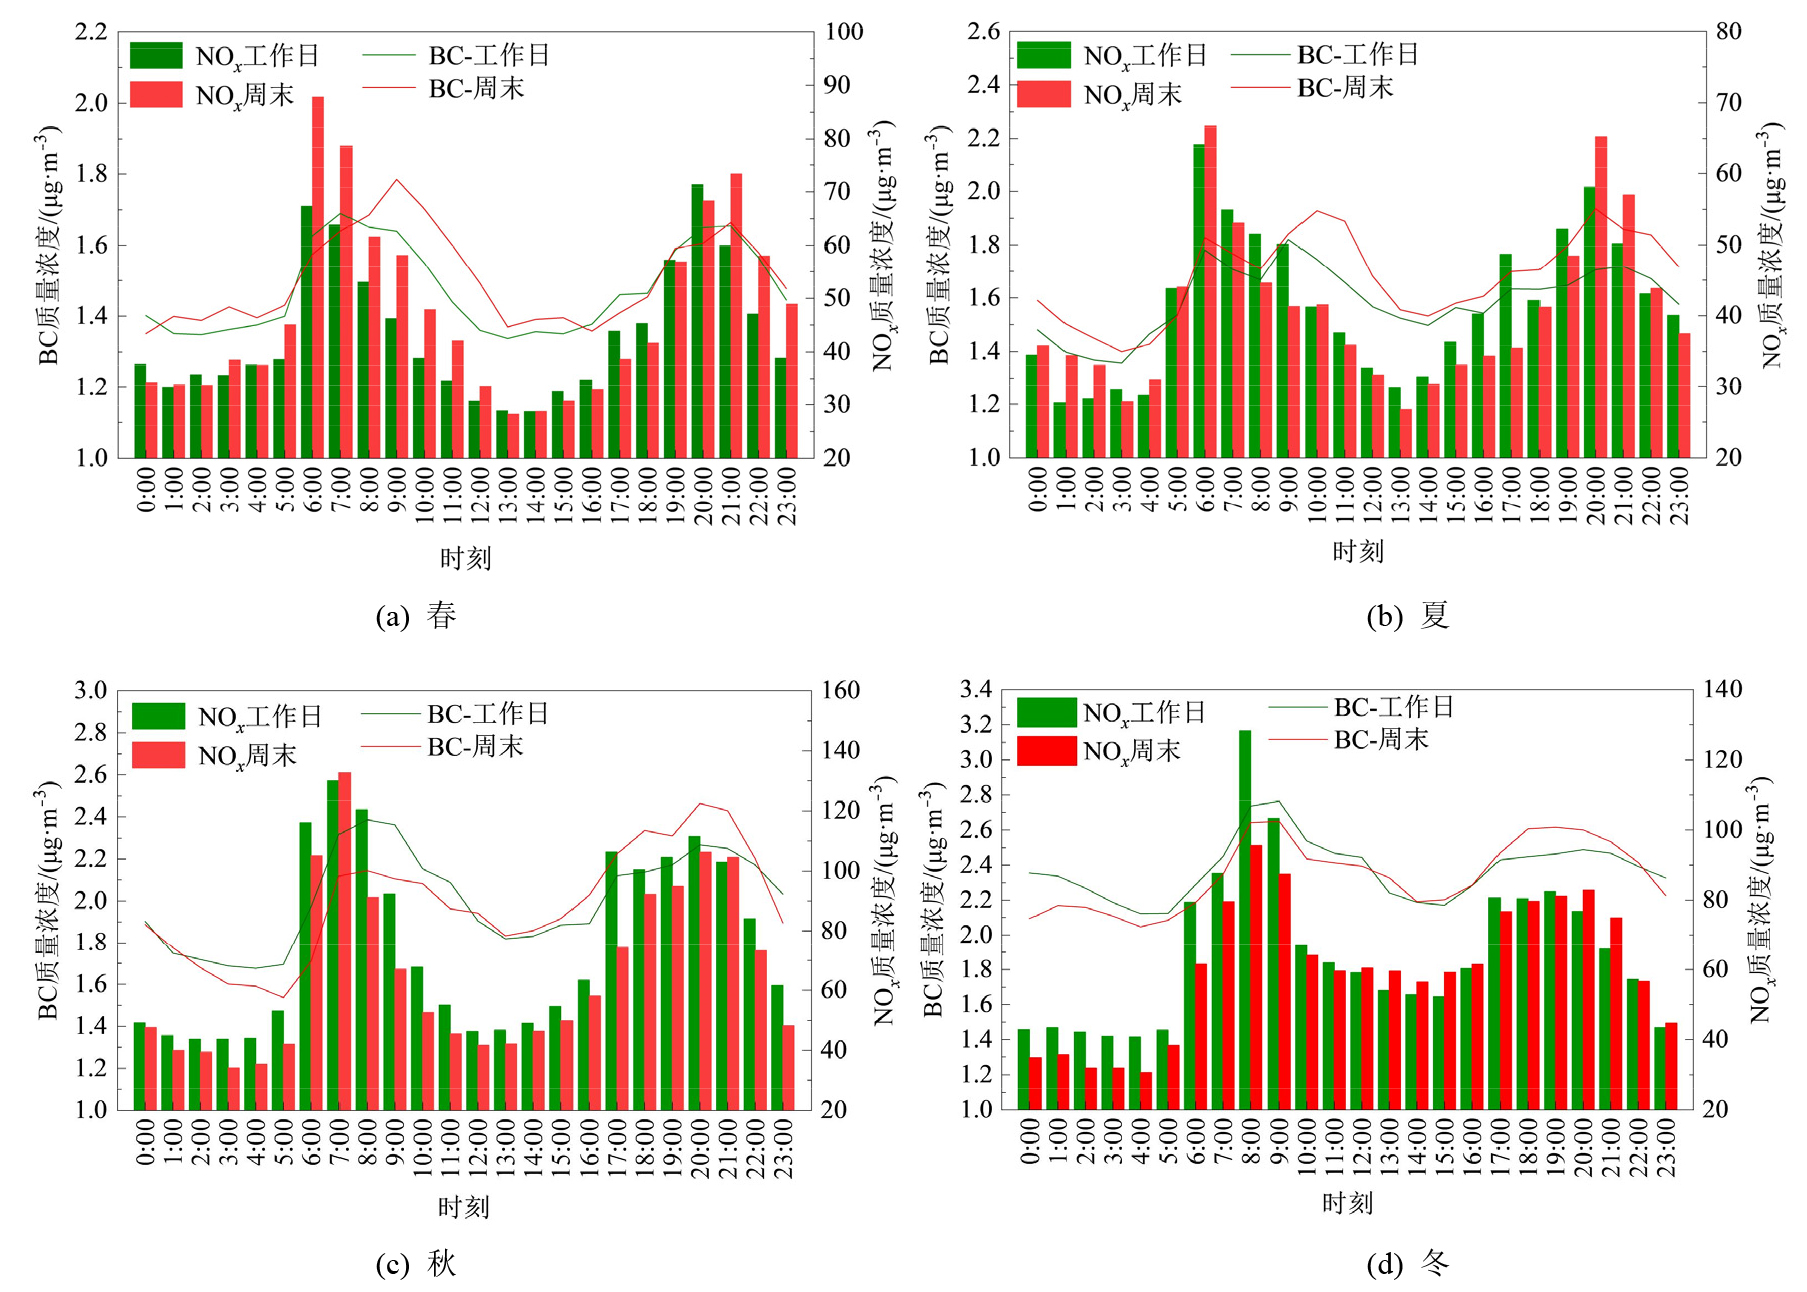
图5 不同季节BC、NOx质量浓度日变化
Figure 5 Diurnal variations of BC and NOx mass concentration in different seasons
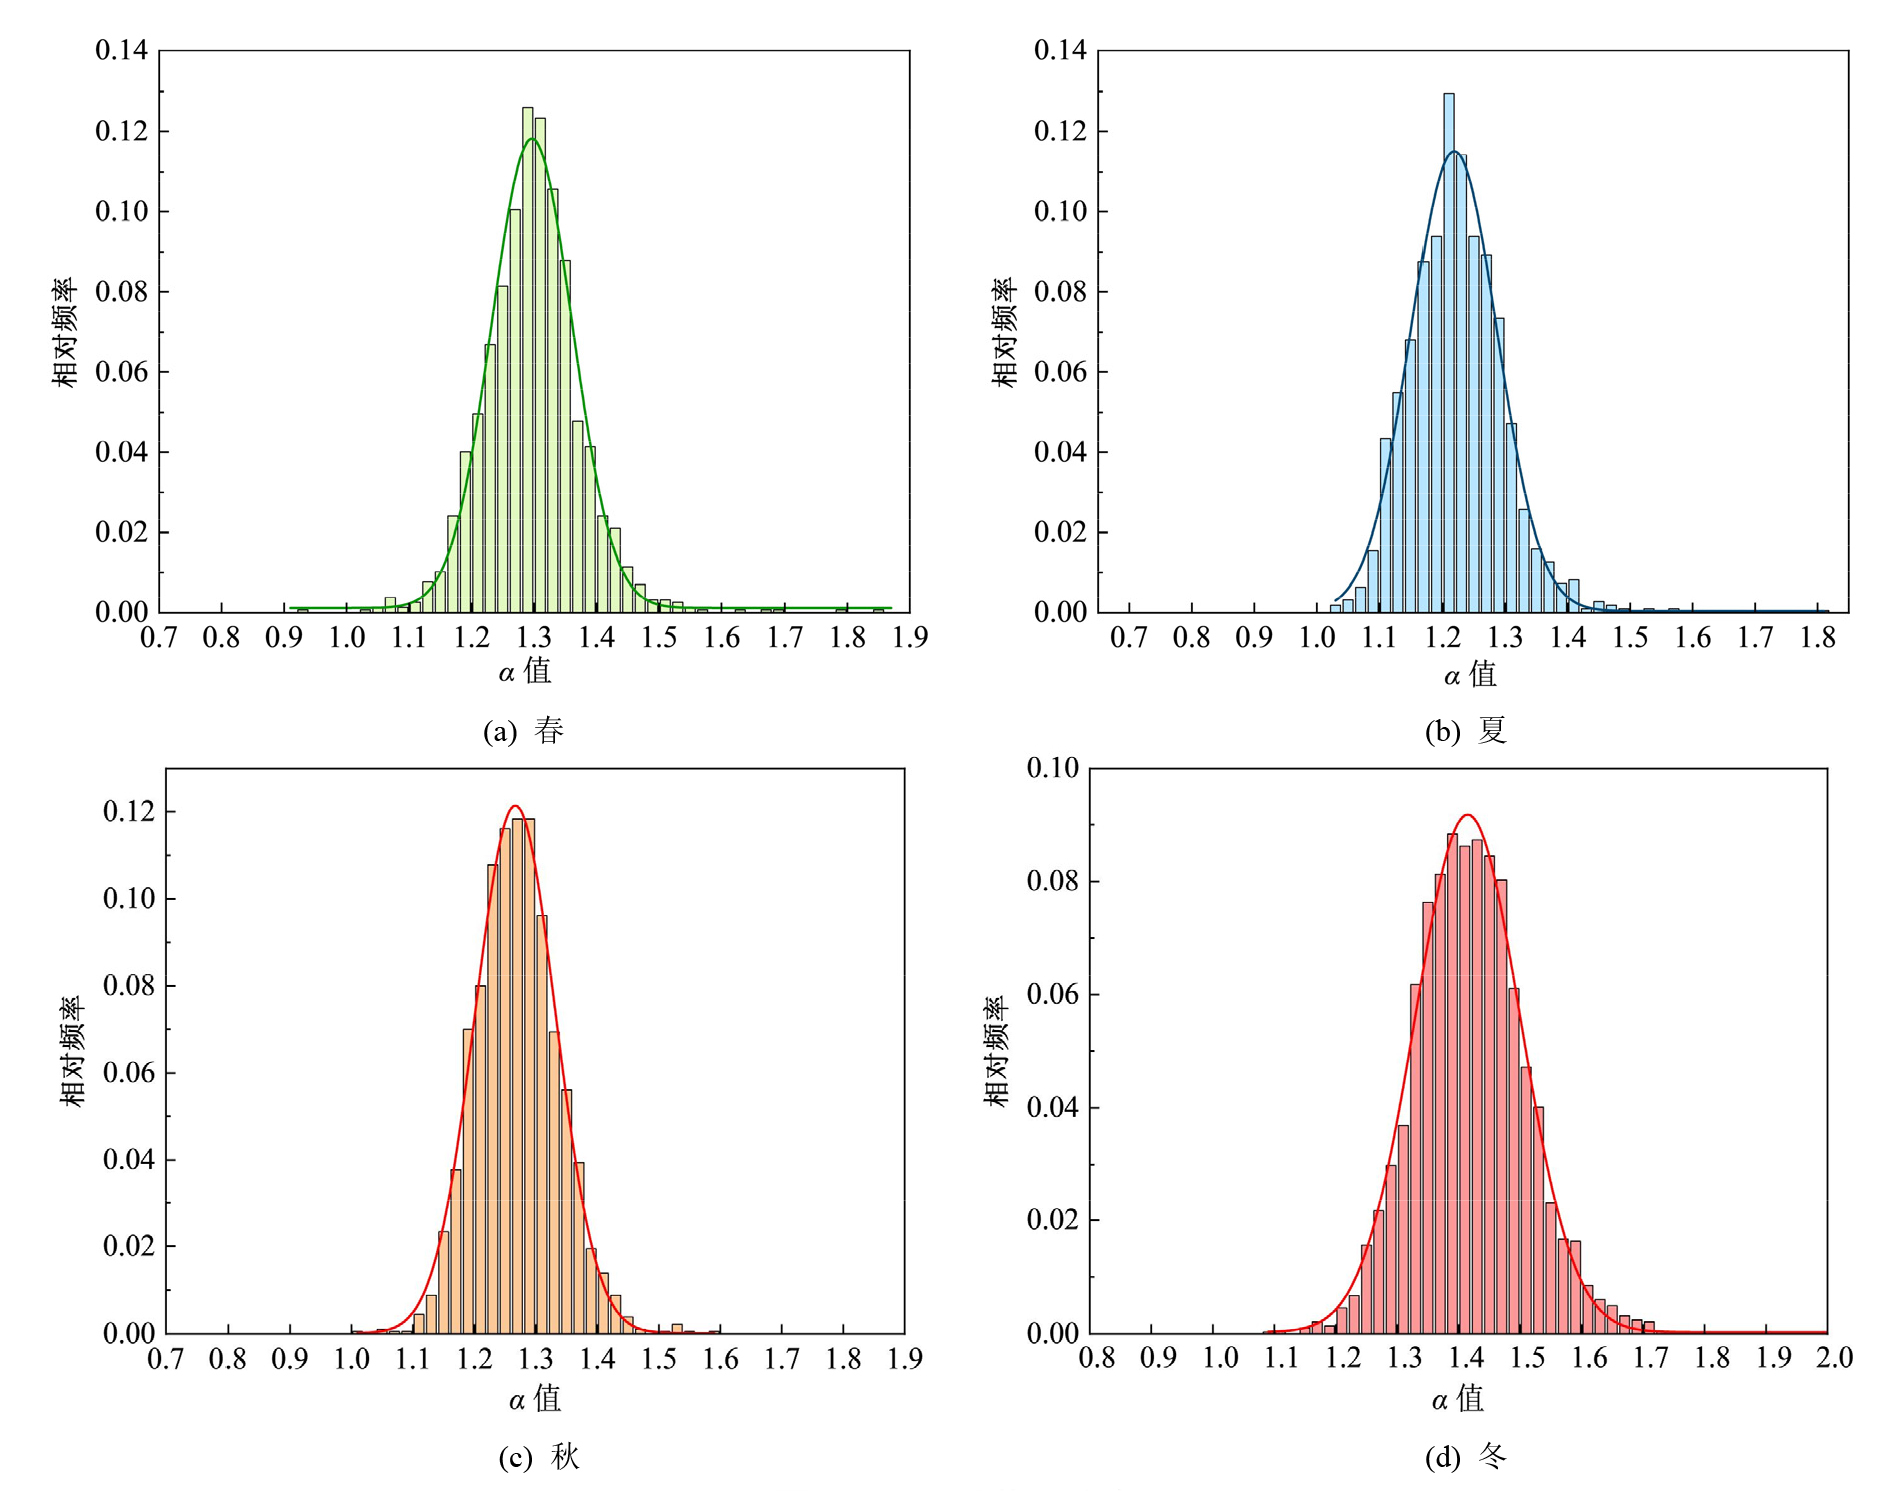
图6 不同季节α分布
Figure 6 Frequency distribution of α in different seasons
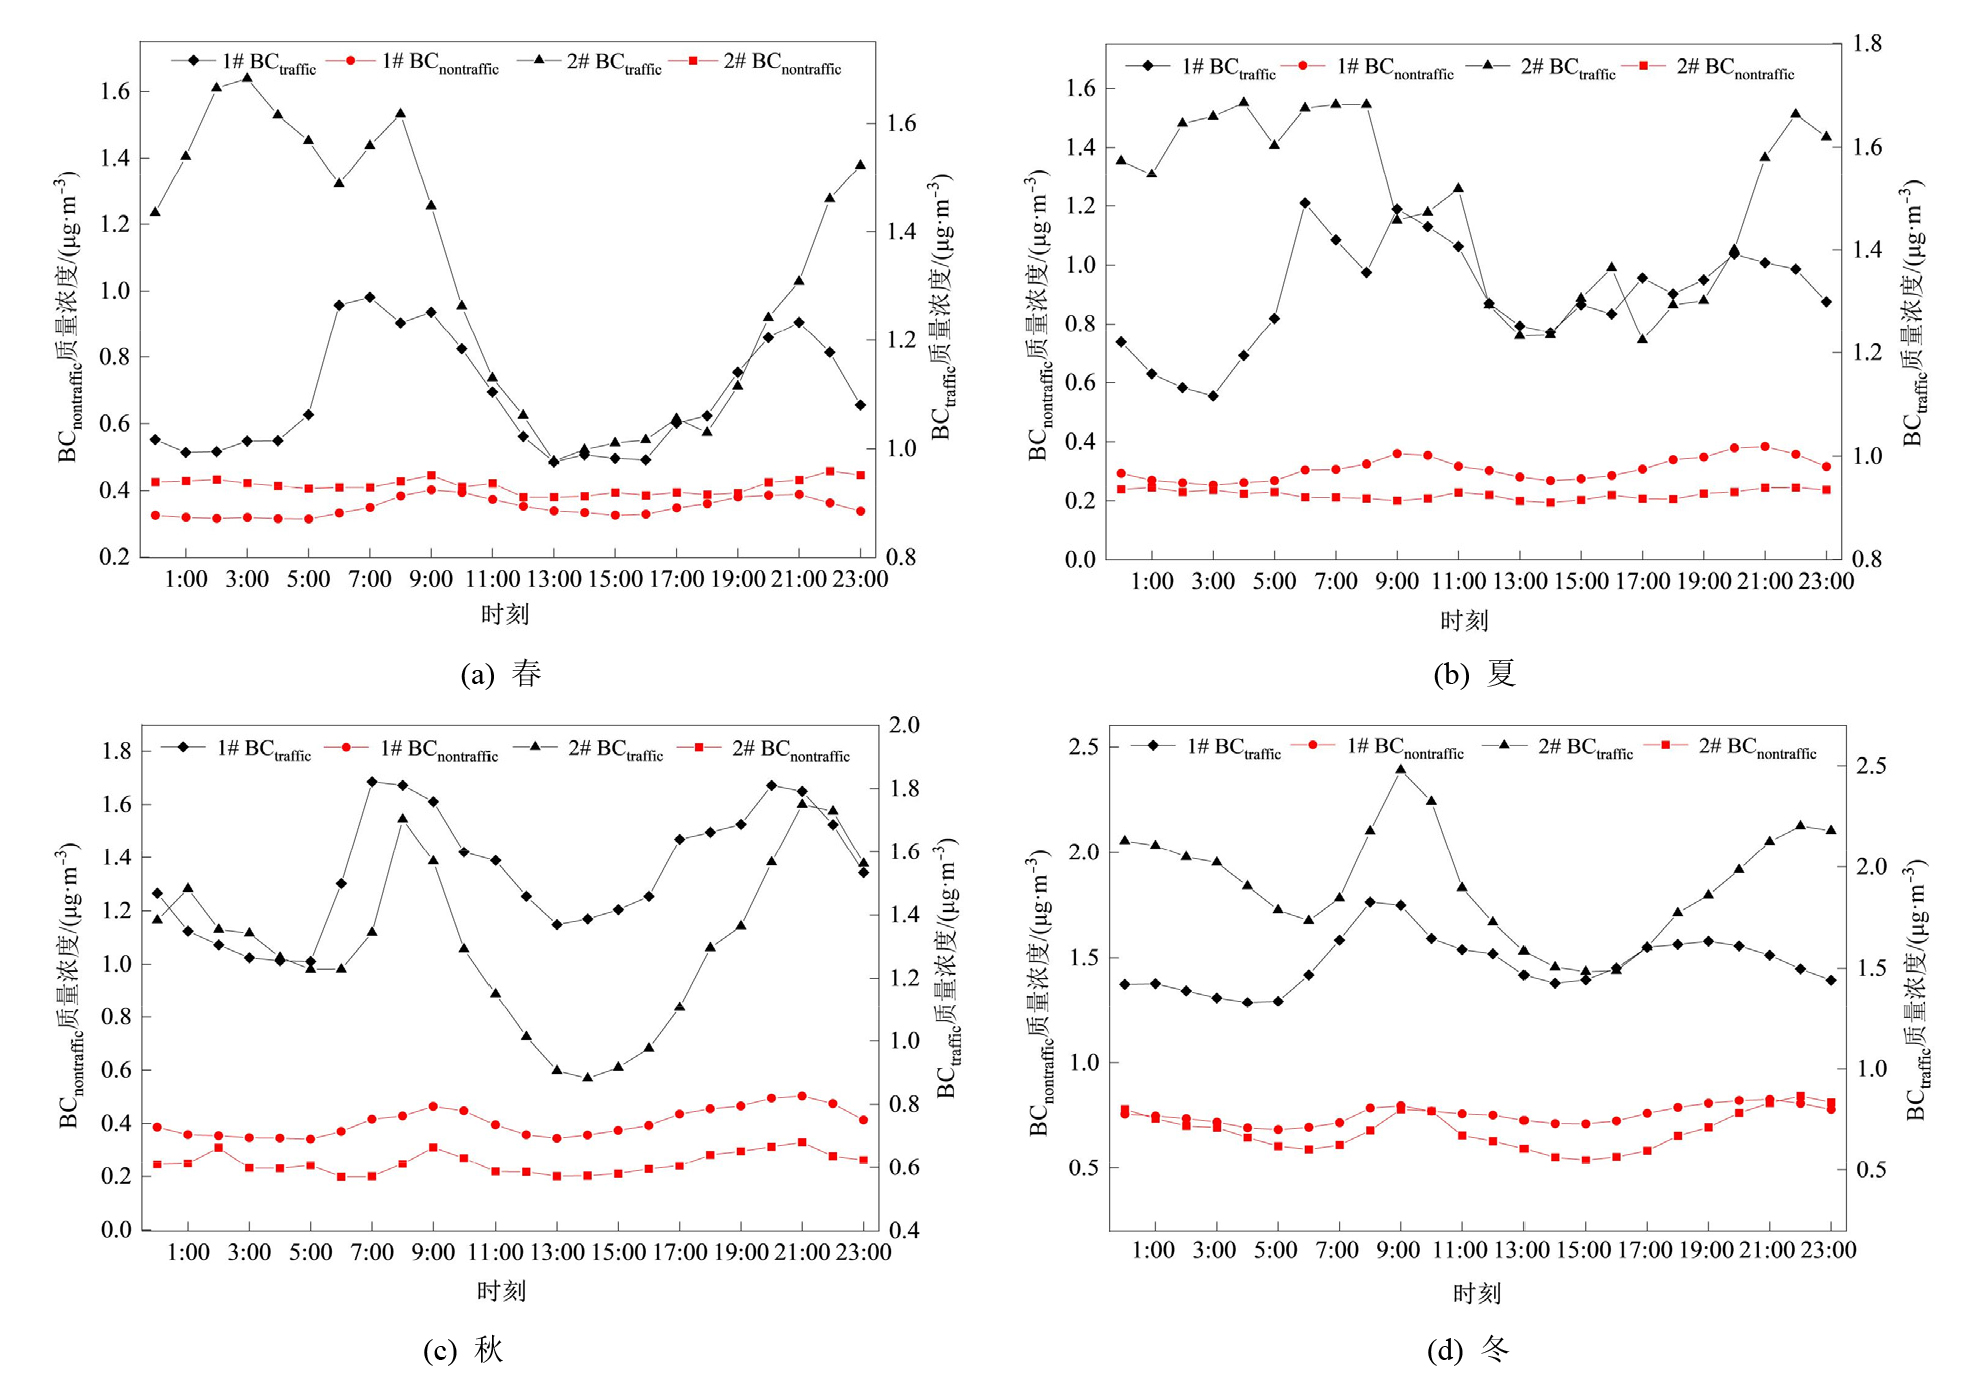
图7 1#和2#监测点位不同季节BCtraffic、BCnontraffic日变化
Figure 7 Diurnal variation of BCtraffic and BCnontraffic in different seasons at 1# and 2# stations
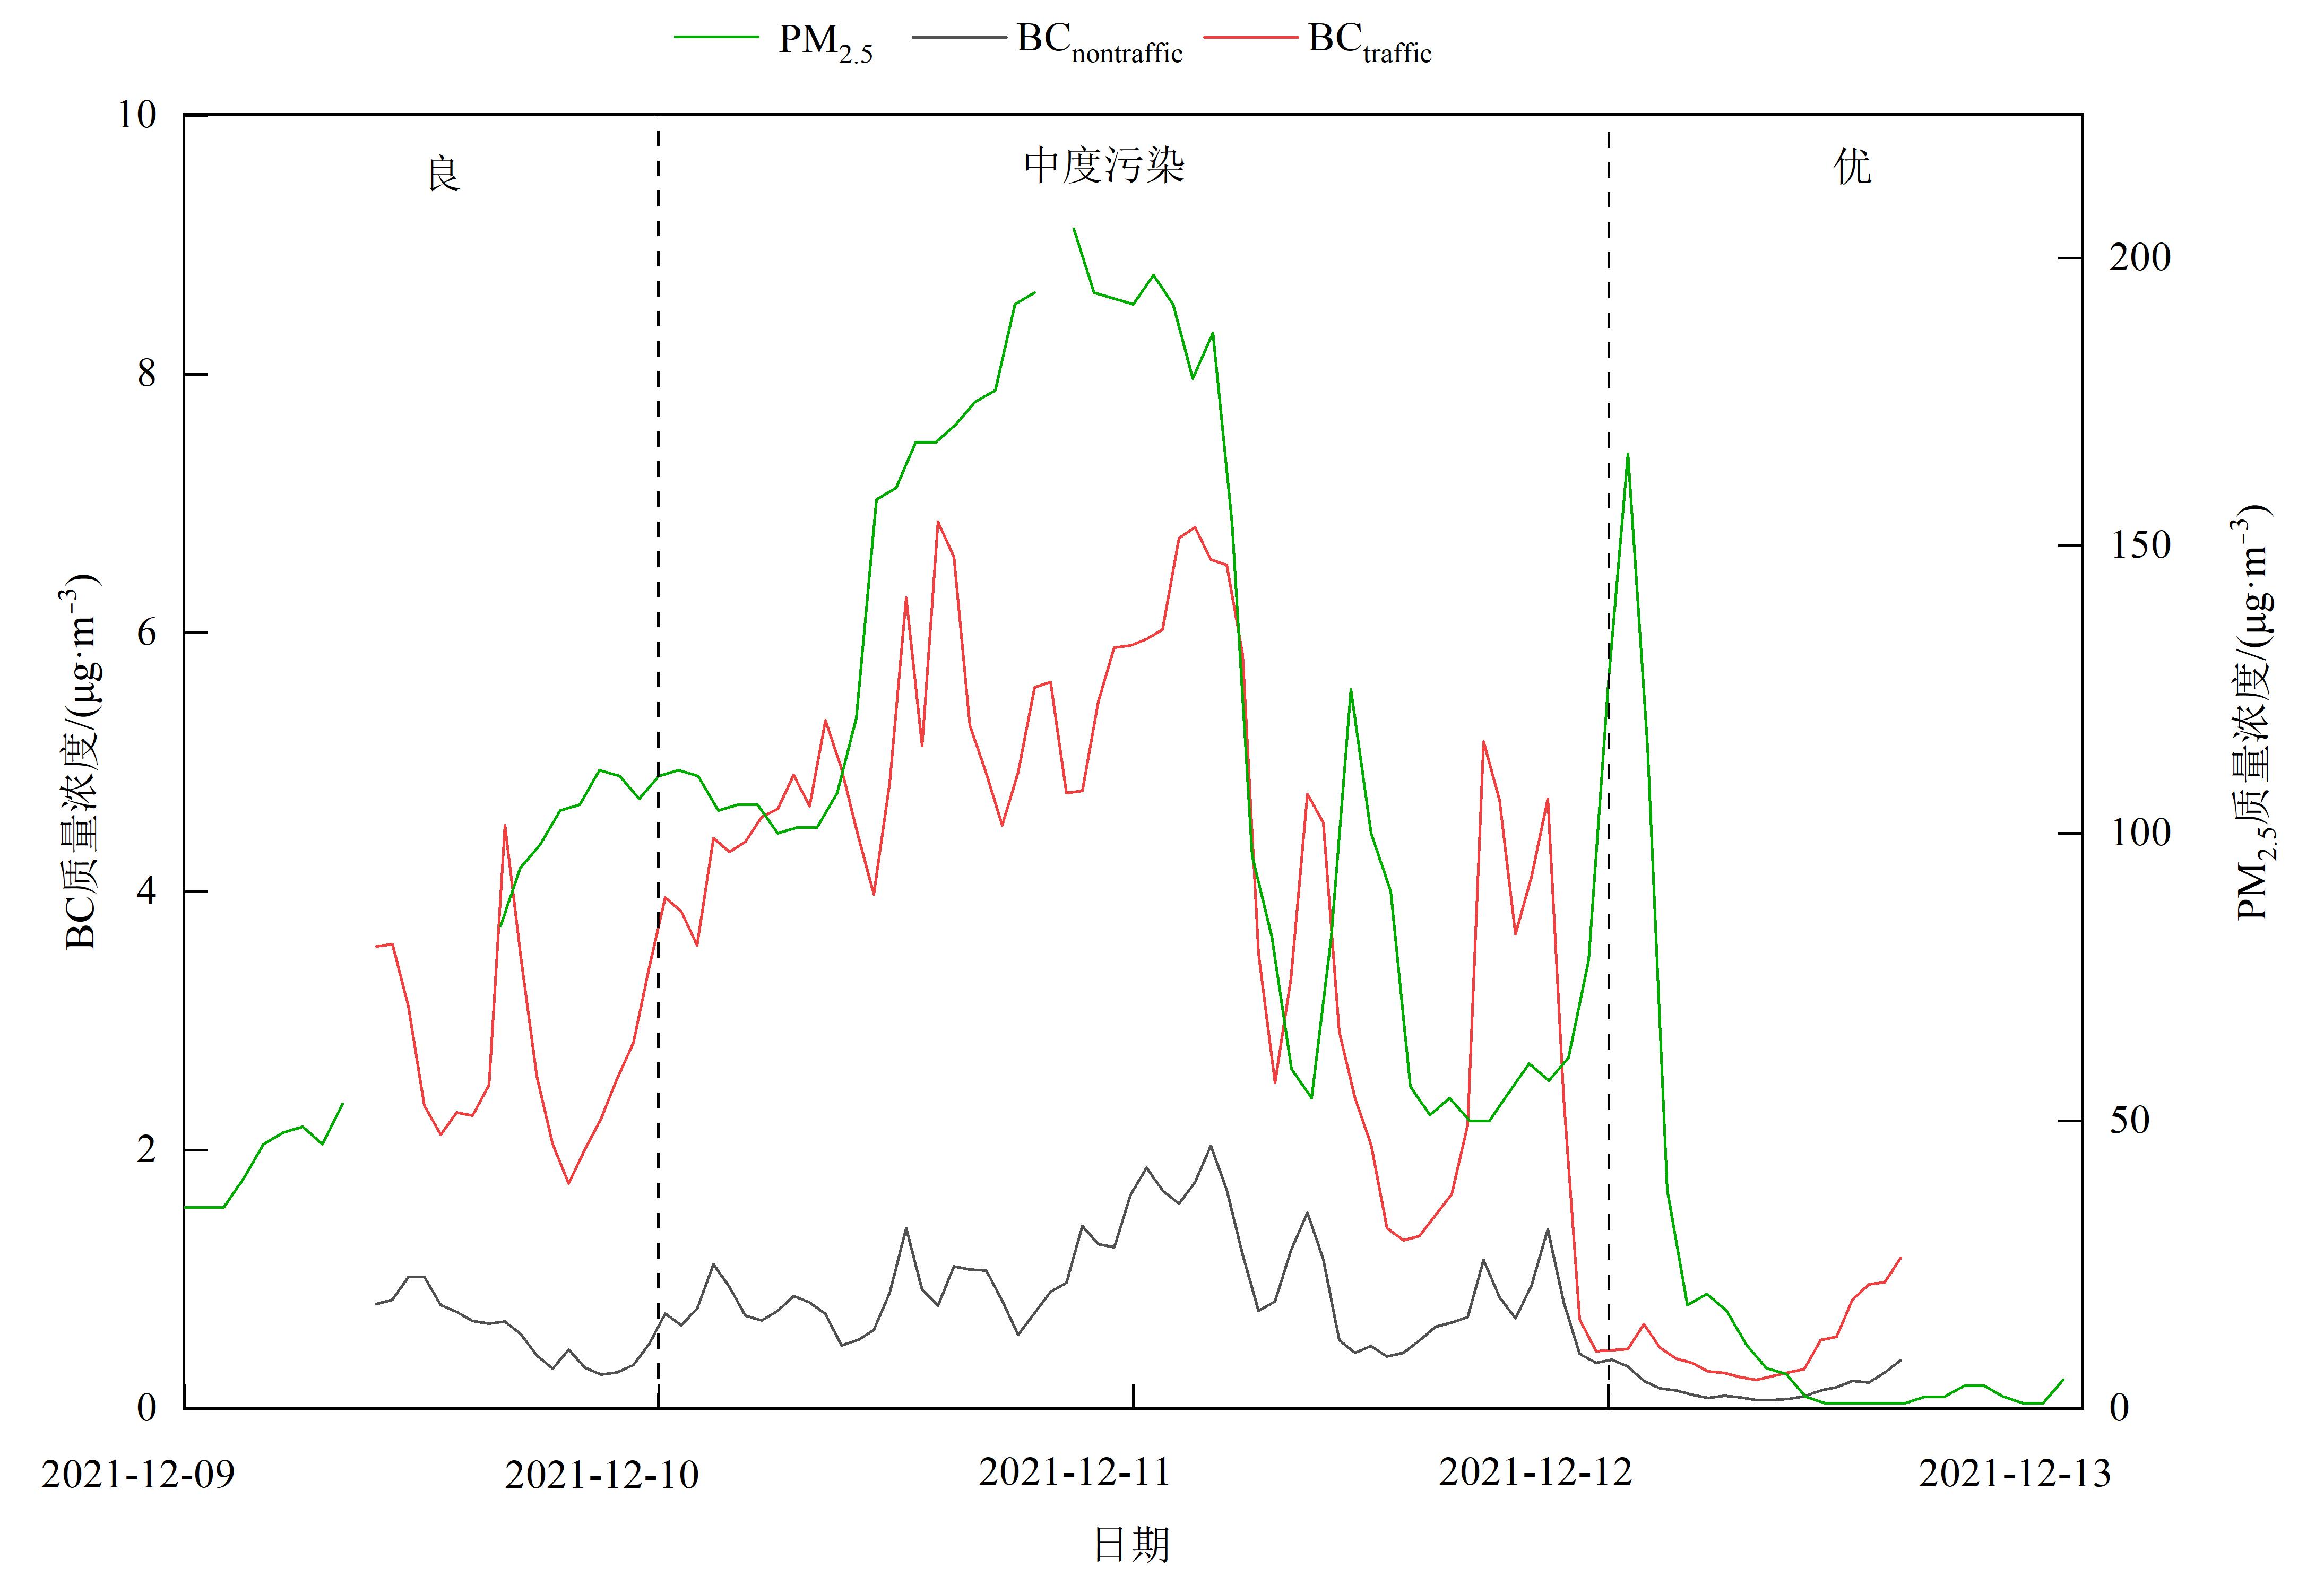
图8 污染过程期间市中心站1#点位BCtraffic和BCnontraffic时间序列
Figure 8 Time series of BCtraffic and BCnontraffic at Ji’nan central stations 1# during the pollution process

图9 1#站点BCtraffic和BCnontraffic潜在源及质量浓度权重分析
Figure 9 Analysis of potential sources and mass concentration weight trajectory of BCtraffic and BCnontraffic at Ji’nan Central Stations 1#
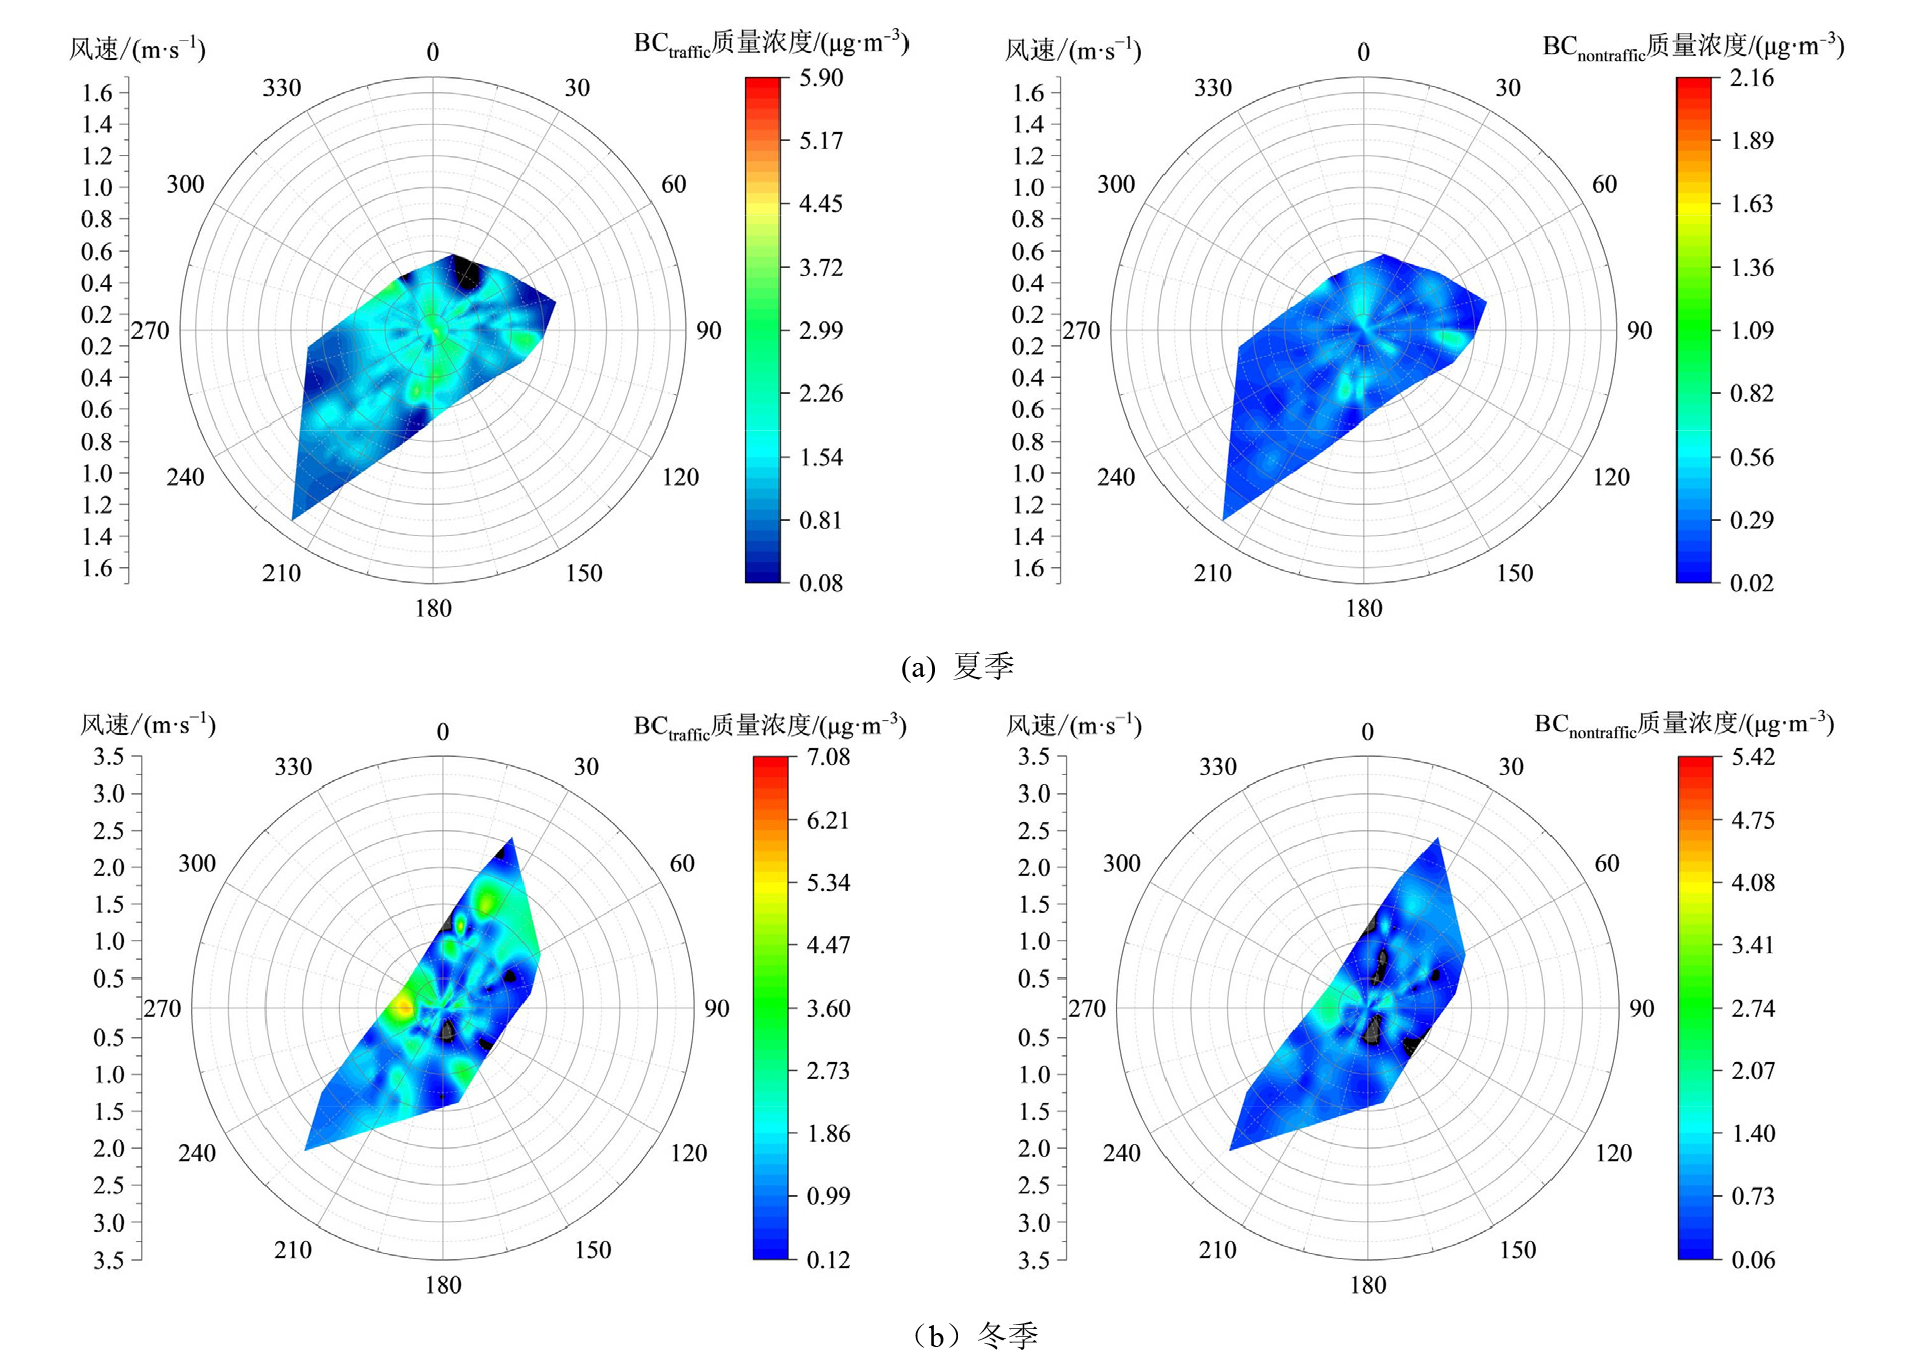
图10 BCtraffic和BCnontraffic质量浓度随风速、风向的变化
Figure 10 Variations of the BCtraffic and BCnontraffic with wind speed and wind direction
| [1] | BOND T C, BERGSTROM R W, 2006. Light absorption by carbonaceous particles: An investigative review[J]. Aerosol Science and Technology, 40(1): 27-35. |
| [2] | BOND T C, DOHERTY S J, FAHEY D W, et al., 2013. Bounding the role of black carbon in the climate system: A scientific assessment[J]. Journal of Geophysical Research: Atmosphere, 118(11): 5380-5552. |
| [3] | BLANCO-ALEGRE C, CALVO A I, et al., 2020. Aethalometer measurements in a road tunnel: A step forward in the characterization of black carbon emissions from traffic[J]. Science of The Total Environment, 703: 135483. |
| [4] |
CAO J J, XU H M, XU Q, et al., 2012. Fine particulate matter constituents and cardiopulmonary mortality in a heavily polluted Chinese city[J]. Environmental Health Perspectives, 120(3): 373-378.
DOI PMID |
| [5] | DACHS J, EISENREICH S J, 2000. Adsorption onto aerosol soot carbon dominates gas-particle partitioning of polycyclic aromatic hydrocarbons[J]. Environmental Science & Technology, 34(17): 3690-3697. |
| [6] | DRINOVEC L, MOCNIK G, ZOTTER P, et al., 2015. The “dual-spot” Aethalometer: An improved measurement of aerosol black carbon with real-time loading compensation[J]. Atmospheric Measurement Techniques, 8(5): 1965-1979. |
| [7] | DING A J, HUANG X, NIE W, et al., 2016. Enhanced haze pollution by black carbon in megacities in China[J]. Geophysical Research Letters, 43(6): 2873-2879. |
| [8] | DAVY P M, TREMPER A H, NICOLOSI E M G, et al., 2017. Estimating particulate black carbon concentrations using two offline light absorption methods applied to four types of filter media[J]. Atmospheric Environment, 152: 24-33. |
| [9] | HANSEN A D A, ROSEN H, NOVAKOV T, 1984. The Aethalometer-An instrument for the real-time measurement of optical absorption by aerosol particles[J]. Science of The Total Environment, 36: 191-196. |
| [10] | INVERNIZZI G, RUPRECHT A, MAZZA R, et al., 2011. Measurement of black carbon concentration as an indicator of air quality benefits of traffic restriction policies within the ecopass zone in Milan, Italy[J]. Atmospheric Environment, 45(21): 3522-3527. |
| [11] | IPCC, 2021. Climate Change 2021: The Physical Science Basis[M]. New York: Cambridge University Press:5-29. |
| [12] | JING A K, ZHU B, WANG H L, et al., 2019. Source apportionment of black carbon in different seasons in the northern suburb of Nanjing, China[J]. Atmospheric Environment, 201: 190-200. |
| [13] | JIA H H, PAN J, HUO J T, et al., 2021. Atmospheric black carbon in urban and traffic areas in Shanghai: Temporal variations, source characteristics, and population exposure[J]. Environmental Pollution, 289: 117868. |
| [14] | JIA H H, HUO J T, FU Q Y, et al., 2021. Atmospheric characteristics and population exposure assessment of black carbon at a regional representative site in the Yangtze River Delta region, China based on the five-year monitoring[J]. Science of The Total Environment, 777: 145990. |
| [15] | LIU Y, YAN C Q, ZHENG M, 2018. Source apportionment of black carbon during winter in Beijing[J]. Science of The Total Environment, 618: 531-541. |
| [16] | LIN W W, DAI J J, LIU R, et al., 2019. Integrated assessment of health risk and climate effects of black carbon in the Pearl River Delta region, China[J]. Environmental Research, 176: 108522. |
| [17] | LJUNGMAN P L S, ANDERSSON N, STOCKFELT L, et al., 2019. Long term exposure to particulate air pollution, black carbon, and their source components in relation to ischemic heart disease and stroke[J]. Environmental Health Perspectives, 127(10): 107012. |
| [18] | NORDLING K, KORHONEN H, RAISANEN J, et al., 2021. Understanding the surface temperature response and its uncertainty to CO2, CH4, black carbon, and sulfate[J]. Atmospheric Chemistry and Physics, 21(19): 14941-14958. |
| [19] | PHANUKARN P, GARIVAIT H, CHINWETKITVANICH P, 2020. Black carbon in PM2.5 at roadside site in Bangkok, Thailand[J]. International Journal of GEOMATE, 19(72): 81-87. |
| [20] | SANDRADEWI J, PREVOT A S H, SZIDAT S, et al., 2008. Using aerosol light absorption measurements for the quantitative determination of wood burning and traffic emission contributions to particulate matter[J]. Environmental Science & Technology, 42(9): 3316-3323. |
| [21] | SAARIKOSKI S, NIEMI J V, AURELA M, et al., 2021. Sources of black carbon at residential and traffic environments obtained by two source apportionment methods[J]. Atmospheric Chemistry and Physics, 21(19): 14851-14869. |
| [22] | EVANS G J, C AUDETTE, K BADALI, 2019. Near-Road Air Pollution Pilot Study[R]. Toronto: Southern Ontario Centre for Atmospheric Aerosol Research, University of Toronto: 7-11. |
| [23] | TAHERI A, ALIASGHARI P, HOSSEINI V, 2019. Black carbon and PM2.5 monitoring campaign on the roadside and residential urban background sites in the city of Tehran[J]. Atmospheric Environment, 218: 116928. |
| [24] | TANG R Z, ZHANG X L, LI Y W, et al., 2022. Distinct black carbon at two roadside sites in Yantai: Temporal variations and influencing factors[J]. Urban Climate, 44: 101182. |
| [25] | U.S. Environmental Protection Agency, 2011. Exposure Factors Handbook[M]. Washington, D.C.: National Center for Environmental Assessment: (Chapter 1)1-10. |
| [26] | WEINGARTNER E, SAATHOFF H, SCHNAITER M, et al., 2003. Absorption of light by soot particles: determination of the absorption coefficient by means of aethalometers[J]. Journal of Aerosol Science, 34(10): 1445-1463. |
| [27] | WU J, LU J, MIN X Y, et al., 2018. Distribution and health risks of aerosol black carbon in a representative city of the Qinghai-Tibet Plateau[J]. Environmental Science and Pollution Research, 25(20): 19403-19412. |
| [28] | WANG Y Q, 2019. An open source software suite for multi-dimensional meteorological data computation and visualization[J]. Journal of Open Research Software, 7(1): 21. |
| [29] | WHO (World Health Organization), 2021. WHO global air quality guidelines: particulate matter (PM2.5 and PM10), ozone, nitrogen dioxide, sulfur dioxide and carbon monoxide[M]. Geneva: World Health Organization:144-149. |
| [30] | WANG W J, KHANNA N, LIN J, et al., 2023. Black carbon emissions and reduction potential in China: 2015-2050[J]. Journal of Environmental Management, 329: 117087. |
| [31] | XIA Y J, WU Y F, HUANG R J, et al., 2020. Variation in black carbon concentration and aerosol optical properties in Beijing: Role of emission control and meteorological transport variability[J]. Chemosphere, 254: 126849. |
| [32] | XIE X N, MYHRE G, LIU X D, et al., 2020. Distinct responses of Asian summer monsoon to black carbon aerosols and greenhouse gases[J]. Atmospheric Chemistry and Physics, 20(20): 11823-11839. |
| [33] | ZHANG Q, STREET D, CARMICHAEL G, et al., 2009. Asian emissions in 2006 for the NASAINTEX-B mission[J]. Atmospheric Chemistry and Physics, 9(14): 5131-5153. |
| [34] | ZHANG S J, WU Y, YAN H, et al., 2019. Black carbon pollution for a major road in Beijing: Implications for policy interventions of the heavy-duty truck fleet[J]. Transportation Research Part D, 68: 110-121. |
| [35] | ZHANG L, LUO Z H, XIONG R, et al., 2021. Mass absorption efficiency of black carbon from residential solid fuel combustion and its association with carbonaceous fractions[J]. Environmental Science & Technology, 55(15): 10662-10671. |
| [36] | ZHANG Q, SHEN Z X, ZHANG T, et al., 2021. Spatial distribution and sources of winter black carbon and brown carbon in six Chinese megacities[J]. Science of The Total Environment, 762: 143075. |
| [37] | ZHENG X, ZHANG S J, WU Y, et al., 2017. Characteristics of black carbon emissions from in-use light-duty passenger vehicles[J]. Environmental Pollution, 231(Part 1): 348-356. |
| [38] | 程丁, 吴晟, 吴兑, 等, 2018. 深圳市城区和郊区黑碳气溶胶对比研究[J]. 中国环境科学, 38(5): 1653-1662. |
| CHENG D, WU C, WU D, et al., 2018. Comparative study on the characteristics of black carbon aerosol in urban and suburban areas of Shenzhen[J]. China Environmental Science, 38(5): 1653-1662. | |
| [39] | 花艳, 汤莉莉, 刘丹彤, 等, 2017. 南京春夏秸秆焚烧期间大气黑碳气溶胶来源解析[J]. 环境科学与技术, 40(1): 147-155. |
| HUA Y, TANG L L, LIU D T, et al., 2017. Source apportionment of black carbon aerosol during straw-burning period in spring and summer in Nanjing[J]. Environmental Science & Technology, 40(1): 147-155. | |
| [40] | 王璐, 袁亮, 张小玲, 等, 2020. 成都地区黑碳气溶胶变化特征及其来源解析[J]. 环境科学, 41(4): 1561-1572. |
| WANG L, YUAN L, ZHANG X L, et al., 2020. Characteristics and source apportionment of black carbon in Chengdu[J]. Environmental Science, 41(4): 1561-1572. | |
| [41] | 吴创, 谭志海, 韩通, 等, 2020. 西安市春季典型交通道路黑碳气溶胶的排放特征[J]. 西安工程大学学报, 34(1): 42-46. |
| WU C, TAN Z H, HAN T, et al., 2020. Black carbon aerosol emission characteristics of typical traffic roads in spring in Xi’an[J]. Journal of Xi’an Polytechnic University, 34(1): 42-46. | |
| [42] | 伍丽青, 王冲, 姜华, 等, 2022. 基于车载平台的济南市道路环境黑碳污染特征研究[J]. 环境科学研究, 35(8): 1798-1806. |
| WU L Q, WANG C, JIANG H, et al., 2022. Pollution characteristics of black carbon in street canyon of Jinan based on vehicle platform[J]. Research of Environmental Sciences, 35(8): 1798-1806. | |
| [43] | 肖思晗, 于兴娜, 朱彬, 等, 2016. 南京北郊黑碳气溶胶污染特征及影响因素分析[J]. 环境科学, 37(9): 3280-3289. |
| XIAO S H, YU X N, ZHU B, et al., 2016. Characteristics of black carbon aerosol and influencing factors in northern suburbs of Nanjing[J]. Environmental Science 37(9): 3280-3289. | |
| [44] | 谢锋, 林煜棋, 宋文怀, 等, 2020. 南京北郊黑碳气溶胶分布特征及来源[J]. 环境科学, 41(10): 4392-4401. |
| XIE F, LIN Y C, SONG W H, et al., 2020. Distribution characteristics and source of black carbon aerosols in the northern suburbs of Nanjing[J]. Environmental Science, 41(10): 4392-4401. | |
| [45] | 严晗, 吴烨, 张少君, 等, 2014. 北京典型道路交通环境机动车黑碳排放与浓度特征研究[J]. 环境科学学报, 34(8): 1891-1899. |
| YAN H, WU Y, ZHANG S J, et al., 2014. Emission characteristics and concentrations of vehicular black carbon in a typical freeway traffic environment of Beijing[J]. Acta Scientiae Circumstantiae, 34(8): 1891-1899. | |
| [46] | 周变红, 曹夏, 张容端, 等, 2021. 宝鸡高新区黑碳气溶胶浓度特征及其影响因素研究[J]. 中国环境监测, 37(5): 125-132. |
| ZHOU B H, CAO X, ZHANG R D, et al., 2021. Study on the characteristics and influencing factors of black carbon aerosol concentration in Baoji high-tech zone[J]. Environmental Monitoring in China, 37(5): 125-132. | |
| [47] | 周睿智, 闫才青, 崔敏, 等, 2021. 山东省大气细颗粒物来源解析的研究现状与展望[J]. 中国环境科学, 41(7): 3029-3042. |
| ZHOU R Z, YAN C Q, CUI M, et al., 2021. Research status and prospects on source apportionment of atmospheric fine particulate matter in Shandong Province[J]. China Environmental Science, 41(7): 3029-3042. | |
| [48] | 中华人民共和国公安部交通管理局, 2022. 2021年全国机动车保有量达3.95亿新能源汽车同比增59.25%[EB/OL]. 北京:中华人民共和国公安部, (2022-01-11)[2023-10-13]. https://www.mps.gov.cn/n2254314/n6409334/c8322353/content.html. |
| Traffic Administration Bureau of the Ministry of Public Security of the People’s Republic of China, 2022. In 2021, the total number of motor vehicles in China reached 395 million, with a year-on-year increase of 59.25% for new energy vehicles[EB/OL]. Beijing: Ministry of Public Security of the People's Republic of China, (2022-01-11)[2023-10-13]. https://www.mps.gov.cn/n2254314/n6409334/c8322353/content.html. |
| [1] | 蒋伯琪, 浮天, 程昳璇, 苏枞枞, 沈建东, 于谨铖, 于兴娜. 沈阳市臭氧污染特征及其影响因素[J]. 生态环境学报, 2024, 33(1): 72-79. |
| [2] | 李姝亭, 胡冠九, 罗小三. 大气环境中全(多)氟烷基化合物(PFASs)的来源、分布及健康风险研究进展[J]. 生态环境学报, 2023, 32(12): 2103-2114. |
| [3] | 黄国锋, 贺斌, 谢志宜, 刘军, 王安侯, 廖彤, 王博瑾, 郝贝贝. 广东省农业源污染对水环境的影响及其空间分异格局[J]. 生态环境学报, 2023, 32(12): 2207-2215. |
| [4] | 魏小锋, 韩红, 闫学军, 王在峰, 李圣增, 田勇, 梁第, 马明亮, 张桂芹. 基于卫星遥感与CMB模型的济南市冬季重污染过程PM2.5溯源分析[J]. 生态环境学报, 2022, 31(6): 1175-1183. |
| [5] | 石慧斌, 黄艺, 程馨, 李婷, 何敏, 王进进. 成都市冬季PM2.5中碳组分污染特征及来源解析[J]. 生态环境学报, 2021, 30(7): 1420-1427. |
| 阅读次数 | ||||||
|
全文 |
|
|||||
|
摘要 |
|
|||||