生态环境学报 ›› 2023, Vol. 32 ›› Issue (5): 845-856.DOI: 10.16258/j.cnki.1674-5906.2023.05.003
翁升恒1,2( ), 张玉琴1,2, 姜冬昕2,3, 潘卫华1,2, 李丽纯1,2,*(), 张方敏4
收稿日期:2023-03-01
出版日期:2023-05-18
发布日期:2023-08-09
通讯作者:
*E-mail: 282452503@qq.com作者简介:翁升恒(1997年生),男,助理工程师,硕士,研究方向为生态气象学。E-mail: 693656304@qq.com
基金资助:
WENG Shengheng1,2(), ZHANG Yuqin1,2, JIANG Dongxin2,3, PAN Weihua1,2, LI Lichun1,2,*(), ZHANG Fangmin4
Received:2023-03-01
Online:2023-05-18
Published:2023-08-09
摘要:
不断加剧的气候变化和人类活动增加了区域生态系统碳循环研究的不确定性。净生态系统生产力(NEP)能够定量描述陆地生态系统与大气之间的碳交换量,探究区域生态系统NEP的时空变化及对气象、植被等因子的响应有助于明晰区域生态系统碳收支状况和应对气候变化。基于TEC模型和生态系统呼吸模型评估了福建省森林2000-2020年NEP时空格局,并借助地理探测器和贡献率方法探究了福建省NEP时空变化的主要驱动因子。结果表明:(1)2000-2020年福建省森林多年年均NEP为528 g·m-2,呈极显著的增强趋势。空间分布规律为“高值主要分布在福建南部的内陆地区,低值主要分布在中北部和南部沿海地区”,约48.3%的地区NEP呈显著上升趋势,主要分布在福建省的中部偏西南地区,而仅有1.00%的地区呈显著下降趋势;(2)空间分布上,影响福建省森林NEP的空间分异的主要因子为植被、地形和气象要素。归一化植被指数对森林NEP空间分布的影响最大,是影响福建省森林NEP空间分异的主要驱动因子,其次是地形和太阳辐射,高程的最适区间为891-1491 m,而辐射的最适区间为128-130 W·m-2。与单因子相比,双因子间的相互作用均增强了对NEP空间分布的影响,其中归一化植被指数与太阳辐射的交互作用对NEP解释力最强;(3)时间变化上,气候与植被因子综合解释了福建省森林NEP年际变化的46.7%,其中归一化植被指数的升高是NEP多年变化的主导因素,而气象因子的变化均对NEP的上升趋势起到了负抑制作用,这说明在“双碳”建设时需要有效提高植被对气候变化的适应能力。
中图分类号:
翁升恒, 张玉琴, 姜冬昕, 潘卫华, 李丽纯, 张方敏. 福建省森林植被NEP时空变化及影响因子分析[J]. 生态环境学报, 2023, 32(5): 845-856.
WENG Shengheng, ZHANG Yuqin, JIANG Dongxin, PAN Weihua, LI Lichun, ZHANG Fangmin. Spatio-temporal Changes and Attribution Analysis of Net Ecosystem Productivity in Forest Ecosystem in Fujian Province[J]. Ecology and Environment, 2023, 32(5): 845-856.

图1 研究区概况(2015年)及稳定林地分布
Figure 1 Overview of the study area (2015) and distribution of stable forest land
| 数据类型 | 数据名称 | 时间段 | 分辨率 | 来源 |
|---|---|---|---|---|
| 站点数据 | 气温、降水、日照 时数、相对湿度 | 2000-2020 | - | 中国国家气候中心 |
| 武夷山站CO2通量 | 2019 | - | 福建省气象局 | |
| 云霄站CO2通量 | 2011-2012, 2017-2018 | - | 已发表文章 | |
| 栅格数据 | 土地利用类型 | 2000, 2005, 2010, 2015 | 30 m | 中科院地理所 |
| 经济、人口 | 2000, 2005, 2010, 2015 | 1 km | 中科院地理所 | |
| 高程 | - | 1 km | 中科院地理所 | |
| 归一化植被指数叶面积指数光合有效辐射吸收比 | 2000-2020 | 500 m | MOD13A1, MOD15A2H |
表1 数据来源及概况
Table 1 Data sources and overview
| 数据类型 | 数据名称 | 时间段 | 分辨率 | 来源 |
|---|---|---|---|---|
| 站点数据 | 气温、降水、日照 时数、相对湿度 | 2000-2020 | - | 中国国家气候中心 |
| 武夷山站CO2通量 | 2019 | - | 福建省气象局 | |
| 云霄站CO2通量 | 2011-2012, 2017-2018 | - | 已发表文章 | |
| 栅格数据 | 土地利用类型 | 2000, 2005, 2010, 2015 | 30 m | 中科院地理所 |
| 经济、人口 | 2000, 2005, 2010, 2015 | 1 km | 中科院地理所 | |
| 高程 | - | 1 km | 中科院地理所 | |
| 归一化植被指数叶面积指数光合有效辐射吸收比 | 2000-2020 | 500 m | MOD13A1, MOD15A2H |
| 交互类型 | 判据 |
|---|---|
| 非线性减弱 | Q(X1∩X2)<Min(Q(X1),Q(X2)) |
| 单因子非线性减弱 | Min(Q(X1), Q(X2))<Q(X1∩X2)<Max(Q(X1), Q(X2)) |
| 双因子增强 | Q(X1∩X2)>Max(Q(X1), Q(X2)) |
| 独立 | Q(X1∩X2)=Q(X1)+Q(X2) |
| 非线性增强 | Q(X1∩X2)>Q(X1)+Q(X2) |
表2 两个自变量对因变量交互作用的类型
Table 2 Types of interaction between two independent variables on dependent variables
| 交互类型 | 判据 |
|---|---|
| 非线性减弱 | Q(X1∩X2)<Min(Q(X1),Q(X2)) |
| 单因子非线性减弱 | Min(Q(X1), Q(X2))<Q(X1∩X2)<Max(Q(X1), Q(X2)) |
| 双因子增强 | Q(X1∩X2)>Max(Q(X1), Q(X2)) |
| 独立 | Q(X1∩X2)=Q(X1)+Q(X2) |
| 非线性增强 | Q(X1∩X2)>Q(X1)+Q(X2) |
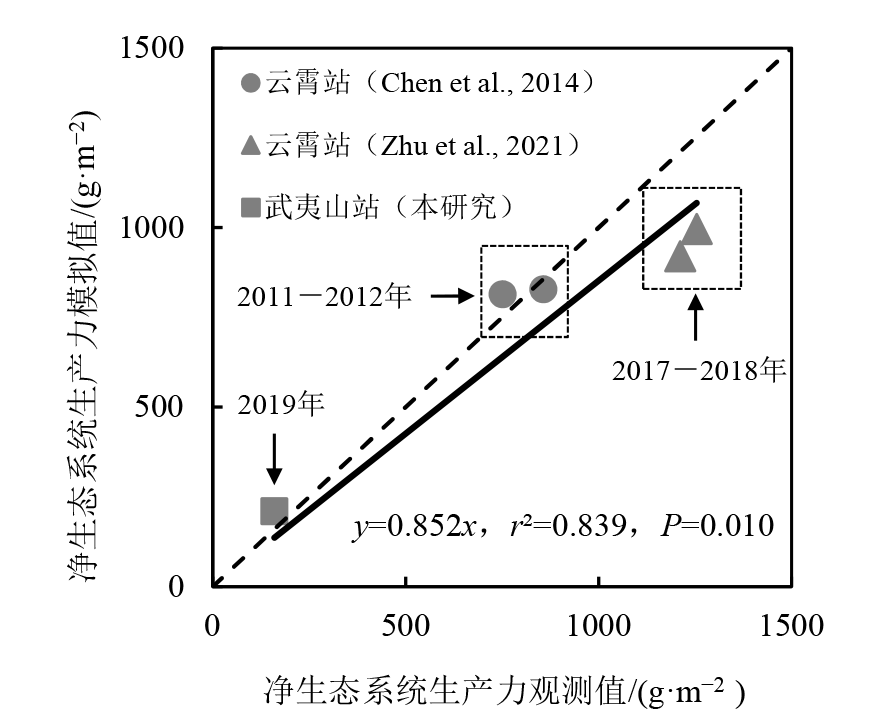
图2 NEP估算结果与已有研究的观测资料对比
Figure 2 Comparison between simulated NEP and existing research observation data

图3 2000-2020年福建省森林环境及社会因子的空间分布
Figure 3 Spatial distribution of forest environment and social factors in Fujian Province from 2000 to 2020
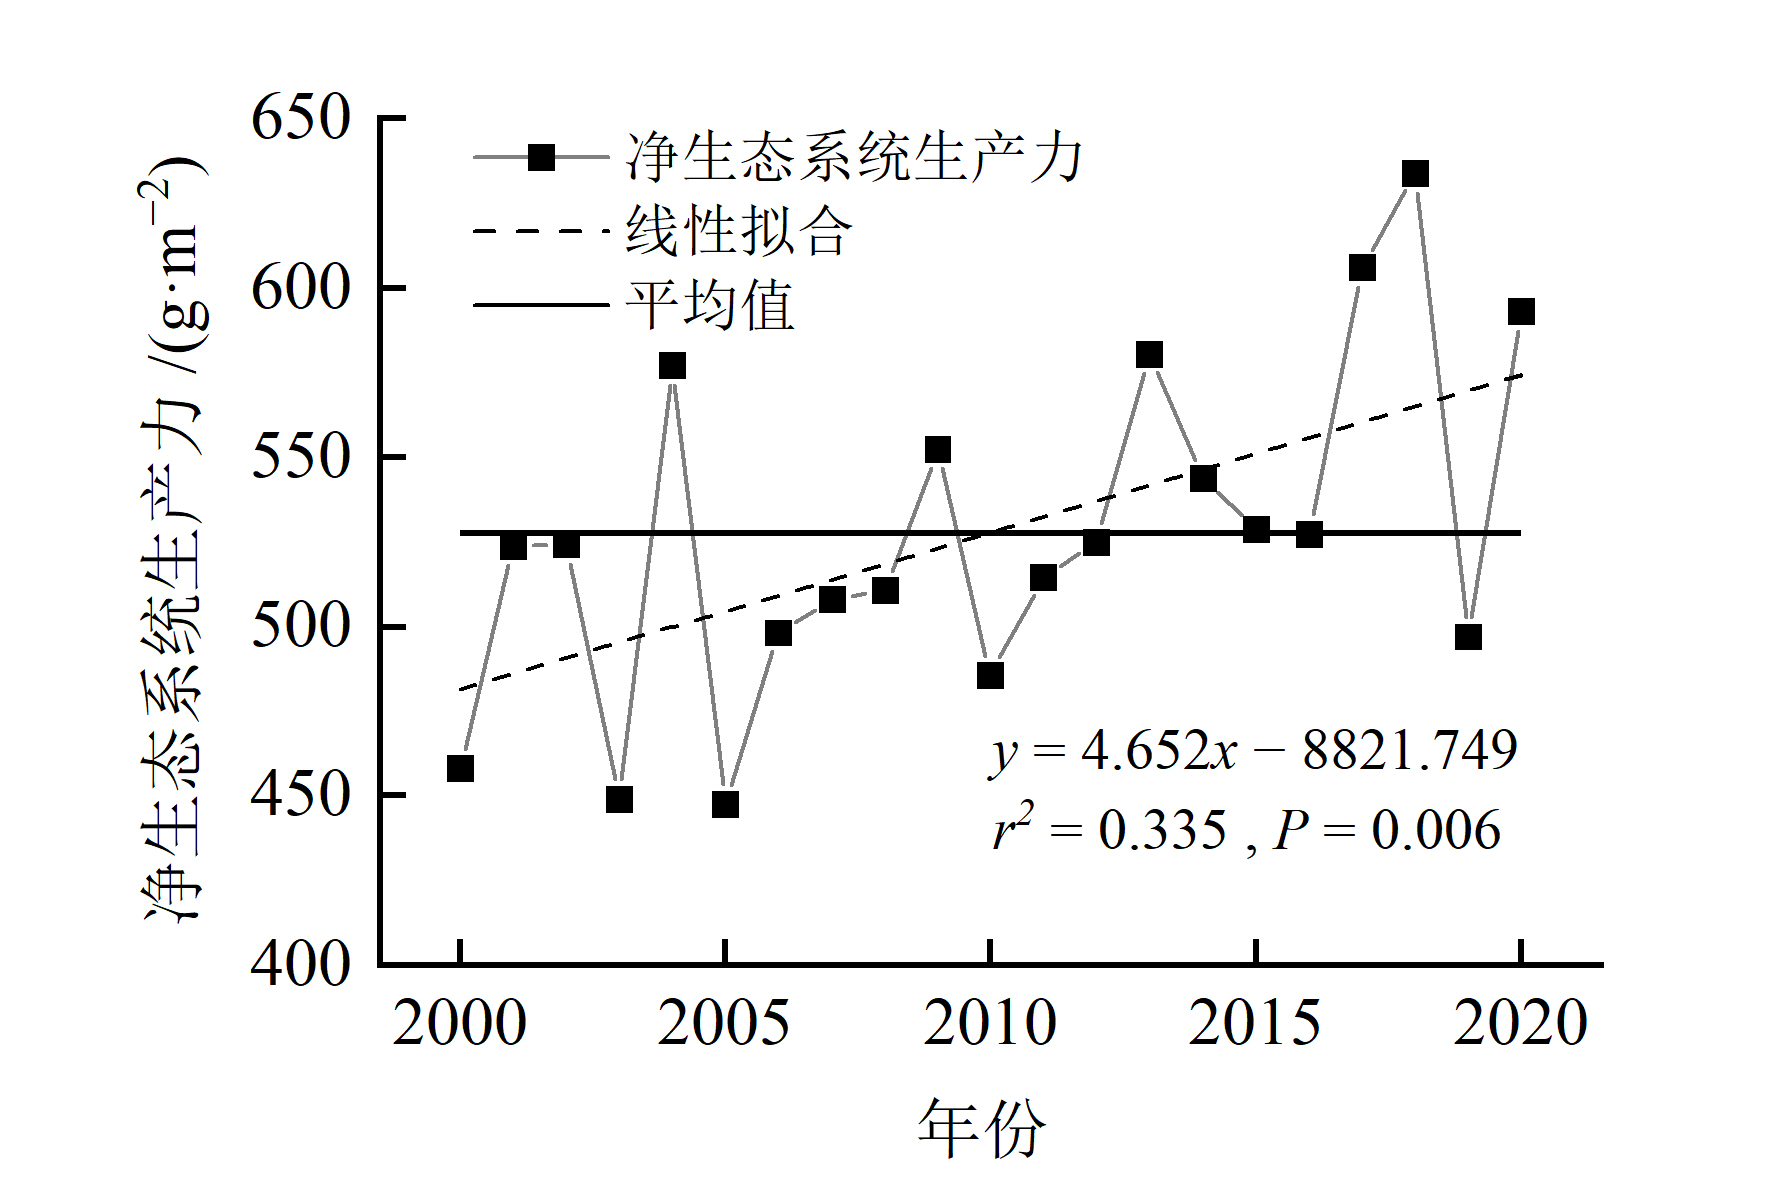
图4 2000-2020年福建省森林NEP平均值的年际变化
Figure 4 Inter-annual variation of forest NEP in Fujian Province from 2000 to 2020

图5 福建省森林NEP及其变化状况的空间分布
Figure 5 Spatial distribution of forest NEP and its changes in Fujian Province
| 地区 | 稳定森林面积 | 净生态系统生产力 | 净生态系统生产力年总量 | 净生态系统生产力变化趋势 | |||||
|---|---|---|---|---|---|---|---|---|---|
| km2 | g·m-2 | 排序 | Tg | 排序 | g·m-2·a-1 | 排序 | |||
| 福州市 | 5961 | 508 | 8 | 3.03 | 6 | 3.93 | 6 | ||
| 龙岩市 | 12294 | 560 | 2 | 6.88 | 3 | 4.83 | 4 | ||
| 南平市 | 15050 | 504 | 9 | 7.58 | 1 | 4.42 | 5 | ||
| 宁德市 | 6665 | 536 | 5 | 3.58 | 4 | 3.62 | 8 | ||
| 莆田市 | 1571 | 561 | 1 | 0.88 | 8 | 3.66 | 7 | ||
| 泉州市 | 4901 | 542 | 4 | 2.66 | 7 | 5.45 | 1 | ||
| 三明市 | 13920 | 519 | 7 | 7.22 | 2 | 5.15 | 3 | ||
| 厦门市 | 388 | 553 | 3 | 0.21 | 9 | 1.84 | 9 | ||
| 漳州市 | 5701 | 533 | 6 | 3.04 | 5 | 5.43 | 2 | ||
| 福建省 | 66451 | 528 | - | 35.07 | - | 4.65 | - | ||
表3 2000-2020年福建省各行政区森林NEP、NEP总量和变化趋势统计
Table 3 Statistics on total forest NEP and change trend in various administrative districts of Fujian Province from 2000 to 2020
| 地区 | 稳定森林面积 | 净生态系统生产力 | 净生态系统生产力年总量 | 净生态系统生产力变化趋势 | |||||
|---|---|---|---|---|---|---|---|---|---|
| km2 | g·m-2 | 排序 | Tg | 排序 | g·m-2·a-1 | 排序 | |||
| 福州市 | 5961 | 508 | 8 | 3.03 | 6 | 3.93 | 6 | ||
| 龙岩市 | 12294 | 560 | 2 | 6.88 | 3 | 4.83 | 4 | ||
| 南平市 | 15050 | 504 | 9 | 7.58 | 1 | 4.42 | 5 | ||
| 宁德市 | 6665 | 536 | 5 | 3.58 | 4 | 3.62 | 8 | ||
| 莆田市 | 1571 | 561 | 1 | 0.88 | 8 | 3.66 | 7 | ||
| 泉州市 | 4901 | 542 | 4 | 2.66 | 7 | 5.45 | 1 | ||
| 三明市 | 13920 | 519 | 7 | 7.22 | 2 | 5.15 | 3 | ||
| 厦门市 | 388 | 553 | 3 | 0.21 | 9 | 1.84 | 9 | ||
| 漳州市 | 5701 | 533 | 6 | 3.04 | 5 | 5.43 | 2 | ||
| 福建省 | 66451 | 528 | - | 35.07 | - | 4.65 | - | ||
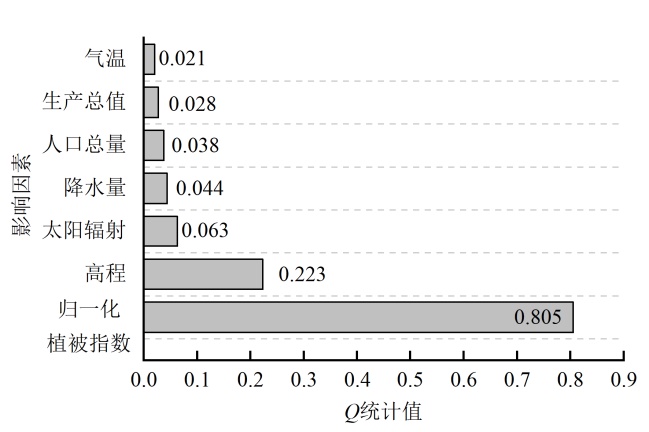
图6 福建省森林NEP的影响因子探测结果
Figure 6 Detection results of forest NEP impact factor in Fujian Province
| 要素 | 高程 | 生产总值 | 人口总量 | 归一化植被指数 | 气温 | 降水量 |
|---|---|---|---|---|---|---|
| 太阳辐射 | 0.300** 2) | 0.107** | 0.109** | 0.846* 1) | 0.083** | 0.097* |
| 降水量 | 0.295** | 0.076* | 0.081* | 0.840* | 0.081** | |
| 气温 | 0.260** | 0.056** | 0.079** | 0.836** | ||
| 归一化 植被指数 | 0.811* | 0.814* | 0.823* | |||
| 人口总量 | 0.253* | 0.041* | ||||
| 生产总值 | 0.248* |
表4 影响因子交互作用探测结果
Table 4 Detection results of influence factor interaction
| 要素 | 高程 | 生产总值 | 人口总量 | 归一化植被指数 | 气温 | 降水量 |
|---|---|---|---|---|---|---|
| 太阳辐射 | 0.300** 2) | 0.107** | 0.109** | 0.846* 1) | 0.083** | 0.097* |
| 降水量 | 0.295** | 0.076* | 0.081* | 0.840* | 0.081** | |
| 气温 | 0.260** | 0.056** | 0.079** | 0.836** | ||
| 归一化 植被指数 | 0.811* | 0.814* | 0.823* | |||
| 人口总量 | 0.253* | 0.041* | ||||
| 生产总值 | 0.248* |
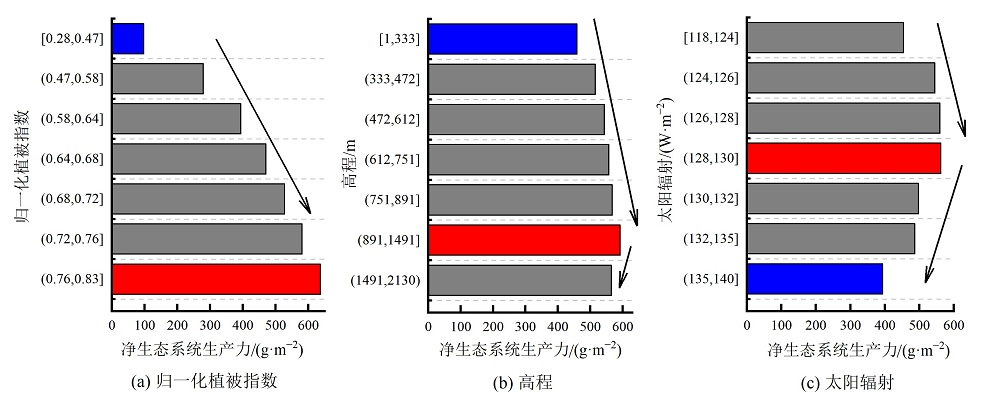
图7 福建省森林NEP对高影响因子变化的响应
Figure 7 Response of forest NEP in Fujian Province to changes of high impact factors
| 统计指标 | 归一化植被指数 | 太阳辐射 | 降水量 | 气温 |
|---|---|---|---|---|
| 相对变化率/% | 14.05 | -1.83 | 1.61 | 1.27 |
| 敏感性系数 | 1.49 | 0.56 | -0.06 | -0.06 |
| 贡献率/% | 44.19 | -2.16 | -0.20 | -0.15 |
表5 NEP时间变化影响因子的敏感性和贡献率
Table 5 Sensitivity and contribution rate of NEP time change influence factors
| 统计指标 | 归一化植被指数 | 太阳辐射 | 降水量 | 气温 |
|---|---|---|---|---|
| 相对变化率/% | 14.05 | -1.83 | 1.61 | 1.27 |
| 敏感性系数 | 1.49 | 0.56 | -0.06 | -0.06 |
| 贡献率/% | 44.19 | -2.16 | -0.20 | -0.15 |
| [1] | ALLAN R G, PEREIRA L S, RAES D, et al., 1998. Crop Evapotranspiration: Guidelines for Computing Crop Water Requirements[J]. Irrigation and Drainage Paper No.56, Rome: Food and Agriculture Organization: 41-53. |
| [2] |
ATKIN O K, ATKINSON L J, FISHER R A, et al., 2008. Using temperature-dependent changes in leaf scaling relationships to quantitatively account for thermal acclimation of respiration in a coupled global climate-vegetation model[J]. Global Change Biology, 14(11): 2709-2726.
DOI URL |
| [3] |
BARR A G, BLACK T A, HOGG E H, et al., 2004. Inter-annual variability in the leaf area index of a boreal aspen-hazelnut forest in relation to net ecosystem production[J]. Agricultural and Forest Meteorology, 126(3-4): 237-255.
DOI URL |
| [4] | BEEKS J C, 2021. Protection and Restoration of Ecosystems: Restoring the Carbon Cycle Balance[C]// J. M. LUETZ, D. AYAL. Handbook of Climate Change Management: Research, Leadership, Transformation. Cham: Springer International Publishing: 3079-3105. |
| [5] | CALVO BUENDIA E, TANABE K, KRANJC A, et al., 2019. Refinement to the 2006 IPCC Guidelines for National Greenhouse Gas Inventories[C]// IPCC, Switzerland:IPCC 2019. |
| [6] |
CHEN H, LU W, YAN G, et al., 2014. Typhoons exert significant but differential impacts on net ecosystem carbon exchange of subtropical mangrove forests in China[J]. Biogeosciences, 11(19): 5323-5333.
DOI URL |
| [7] |
CHEN J M, JU W M, CIAIS P, et al., 2019. Vegetation structural change since 1981 significantly enhanced the terrestrial carbon sink[J]. Nature Communications, 10(1): 4259.
DOI PMID |
| [8] | CHEN Z, YU G R, GE J P, et al., 2015. Roles of climate, vegetation and soil in regulating the spatial variations in ecosystem carbon dioxide fluxes in the Northern Hemisphere[J]. PLoS One, 10(4): e0125265. |
| [9] | DUFFY K A, SCHWALM C R, ARCUS V L, et al., 2021. How close are we to the temperature tipping point of the terrestrial biosphere[J]. Science Advances, 7(3): eaay1052. |
| [10] | GE W Y, DENG L Q, WANG F, et al., 2021. Quantifying the contributions of human activities and climate change to vegetation net primary productivity dynamics in China from 2001 to 2016[J]. Science of The Total Environment, 773: 145648. |
| [11] |
GOWARD S N, DYE D G, 1987. Evaluating North American net primary productivity with satellite observations[J]. Advances in Space Research, 7(11): 165-174.
DOI URL |
| [12] |
HASHIMOTO S, CARVALHAIS N, ITO A, et al., 2015. Global spatiotemporal distribution of soil respiration modeled using a global database[J]. Biogeosciences, 12(13): 4121-4132.
DOI URL |
| [13] |
LLOYD J, TAYLOR J A, 1994. On the temperature dependence of soil respiration[J]. Functional Ecology, 8(3): 315-323.
DOI URL |
| [14] | MAO F J, DU H Q, ZHOU G M, et al., 2022. Simulated net ecosystem productivity of subtropical forests and its response to climate change in Zhejiang Province, China[J]. Science of The Total Environment, 838(Part 1): 155993. |
| [15] |
MASEYK K, GRÜNZWEIG J M, ROTENBERG E, et al., 2008. Respiration acclimation contributes to high carbon-use efficiency in a seasonally dry pine forest[J]. Global Change Biology, 14(7): 1553-1567.
DOI URL |
| [16] |
MCCREE K J, 1972. Test of current definitions of photosynthetically active radiation against leaf photosynthesis data[J]. Agricultural Meteorology, 10: 443-453.
DOI URL |
| [17] |
MCCUEN R H, 1974. A sensitivity and error analysis CF procedures used for estimating evaporation[J]. Journal of the American Water Resources Association, 10(3): 486-497.
DOI URL |
| [18] |
MELILLO J M, MCGUIRE A D, KICKLIGHTER D W, et al., 1993. Global climate change and terrestrial net primary production[J]. Nature, 363(6426): 234-240.
DOI |
| [19] |
PIAO S L, LUYSSAERT S, CIAIS P, et al., 2010. Forest annual carbon cost: A global-scale analysis of autotrophic respiration[J]. Ecology, 91(3): 652-661.
PMID |
| [20] |
PRIESTLEY C H B, TAYLOR R J, 1972. On the Assessment of Surface Heat Flux and Evaporation Using Large-Scale Parameters[J]. Monthly Weather Review, 100(2): 81-92.
DOI URL |
| [21] |
SONG Y Z, WANG J F, GE Y, et al., 2020. An optimal parameters-based geographical detector model enhances geographic characteristics of explanatory variables for spatial heterogeneity analysis: cases with different types of spatial data[J]. GIScience and Remote Sensing, 57(5): 593-610.
DOI URL |
| [22] |
WANG C, ZHAO W Z, ZHANG Y Y, 2022a. The Change in Net Ecosystem Productivity and its Driving Mechanism in a Mountain Ecosystem of Arid Regions, Northwest China[J]. Remote Sensing, 14(16): 4046.
DOI URL |
| [23] |
WANG J F, ZHANG T L, FU B J, 2016. A measure of spatial stratified heterogeneity[J]. Ecological Indicators, 67: 250-256.
DOI URL |
| [24] |
WANG J, FENG L, PALMER P I, et al., 2020. Large Chinese land carbon sink estimated from atmospheric carbon dioxide data[J]. Nature, 586: 720-723.
DOI |
| [25] | WANG M M, ZHAO J, WANG S Q, et al., 2021. Detection and attribution of positive net ecosystem productivity extremes in China's terrestrial ecosystems during 2000-2016[J]. Ecological Indicators, 132: 108323. |
| [26] |
WANG S Q, ZHOU L, CHEN J, et al., 2011. Relationships between net primary productivity and stand age for several forest types and their influence on China’s carbon balance[J]. Journal of Environmental Management, 92(6): 1651-1662.
DOI URL |
| [27] | WANG Y R, BUCHMANN N, HESSEN D O, et al., 2022b. Disentangling effects of natural and anthropogenic drivers on forest net ecosystem production[J]. Science of The Total Environment, 839: 156326. |
| [28] |
YAN H, WANG S Q, BILLESBACH D, et al., 2012. Global estimation of evapotranspiration using a leaf area index-based surface energy and water balance model[J]. Remote Sensing of Environment, 124: 581-595.
DOI URL |
| [29] |
YAN H, WANG S Q, BILLESBACH D, et al., 2015. Improved global simulations of gross primary product based on a new definition of water stress factor and a separate treatment of C3 and C4 plants[J]. Ecological Modelling, 297: 42-59.
DOI URL |
| [30] |
YAN H, WANG S Q, WANG J B, et al., 2019. Multi-model analysis of climate impacts on plant photosynthesis in China during 2000-2015[J]. International Journal of Climatology, 39(1): 5539-5555.
DOI URL |
| [31] |
YU G R, ZHU X, FU Y, et al., 2013. Spatial patterns and climate drivers of carbon fluxes in terrestrial ecosystems of China[J]. Global change biology, 19(3): 798-810.
DOI URL |
| [32] |
ZHANG Y, YAO Y T, WANG X H, et al., 2017. Mapping spatial distribution of forest age in China[J]. Earth and Space Science, 4(3): 108-116.
DOI URL |
| [33] |
ZHAO M S, RUNNING S W, 2010. Drought-induced reduction in global terrestrial net primary production from 2000 through 2009[J]. Science, 329(5994): 940-943.
DOI PMID |
| [34] | ZHU X D, QIN Z C, SONG L L, 2021. How land-sea interaction of tidal and sea breeze activity affect mangrove net ecosystem exchange[J]. Journal of Geophysical Research Atmospheres, 126(8): e2020JD034047. |
| [35] | 华朗钦, 张方敏, 翁升恒, 等, 2023. 1982-2020年安徽省植被生态系统NEP时空格局变化及归因分析[J]. 生态学报, 43(17): 1-15. |
|
HUA L Q, ZHANG F M, WENG S H, et al., 2023. Spatio-temporal pattern changes and attribution analysis of net ecosystem productivity in vegetation ecosystems in Anhui Province from 1982 to 2020[J]. Acta Ecologica Sinica, 43(17): 1-15
DOI URL |
|
| [36] | 黄麟, 邵全琴, 刘纪远, 2012. 江西省森林碳蓄积过程及碳源/汇的时空格局[J]. 生态学报, 32(10): 3010-3020. |
|
HUANG L, SHAO Q Q, LIU J Y, 2012. Forest carbon sequestration and carbon sink/source in Jiangxi Province[J]. Acta Ecologica Sinica, 32(10): 3010-3020.
DOI URL |
|
| [37] | 江洪, 虞嘉玮, 蒋世豪, 等, 2021. 基于CASA模型和SEVI指数的福建省植被NPP遥感估算与分析[J]. 海南大学学报(自然科学版), 39(4): 372-382. |
| JIANG H, YU J W, JIANG S H, et al., 2021. Estimation and analysis of vegetation net primary productivity of Fujian province using CASA model and SEVI information[J]. Natural Science Journal of Hainan University, 39(4): 372-382. | |
| [38] | 李俊晓, 李朝奎, 殷智慧, 2013. 基于ArcGIS的克里金插值方法及其应用[J]. 测绘通报 (9): 87-97. |
| LI J X, LI C K, YIN Z H, 2013. ArcGIS Based Kriging Interpolation Method and Its Application[J]. Bulletin of Surveying and Mapping (9): 87-97. | |
| [39] | 李振基, 丁鑫, 江凤英, 等, 2021. 福建植被志[M]. 福州: 福建科学技术出版社. |
| LI Z J, DING X, JIANG F Y, et al., 2021. Vegegraphy of Fujian[M]. Fuzhou: Fujian Science and Technology Publishing House. | |
| [40] | 刘春雨, 董晓峰, 王春燕, 等, 2018. 甘肃省县级行政单元NEP的时空异质性[J]. 兰州大学学报(自然科学版), 54(1): 82-89. |
| LIU C Y, DONG X F, WANG C Y, et al., 2018. Time and space variability of the county level administrative unit to NEP in Gansu Province[J]. Journal of Lanzhou University: Natural Sciences, 54(1): 82-89. | |
| [41] | 刘应帅, 余瑞, 郑彬彬, 等, 2022. 海南岛森林植被NEP季节性时空变化规律及气候驱动因素分析[J]. 热带生物学报, 13(2): 166-176. |
| LIU Y S, YU R, ZHENG B B, et al., 2022. Analysis of seasonal spatial and temporal variation patterns of forest vegetation NEP and climate drivers in Hainan Island[J]. Journal of Tropical Biology, 13(2): 166-176. | |
| [42] | 朴世龙, 何悦, 王旭辉, 等, 2022a. 中国陆地生态系统碳汇估算: 方法、进展、展望[J]. 中国科学:地球科学, 52(6): 1010-1020. |
| PIAO S L, HE Y, WANG X H, et al., 2022a. Estimating carbon sequestrations in terrestrial ecosystems in China: Methodology, progress and prospects[J]. Sciental Sinica Terrae, 52(6): 1010-1020. | |
| [43] | 朴世龙, 岳超, 丁金枝, 等, 2022b. 试论陆地生态系统碳汇在碳中和目标中的作用[J]. 中国科学:地球科学, 52(7): 1419-1426. |
| PIAO S L, YUE C, DING J Z, et al., 2022b. The role of terrestrial ecosystem carbon sinks in carbon neutrality goals[J]. Sciental Sinica Terrae, 52(7): 1419-1426. | |
| [44] | 孙滨峰, 赵红, 逯非, 等, 2018. 东北森林带森林生态系统固碳服务空间特征及其影响因素[J]. 生态学报, 38(14): 4975-4983. |
| SUN B F, ZHAO H, LU F, et al., 2018. Spatial and temporal patterns of carbon sequestration in the Northeastern Forest Regions and its impact factors analysis[J]. Acta Ecologica Sinica, 38(14): 4975-4983. | |
| [45] |
王劲峰, 徐成东, 2017. 地理探测器:原理与展望[J]. 地理学报, 72(1): 116-134.
DOI |
|
WANG J F, XU C D, 2017. Geodetector: Principle and prospective[J]. Acta Geographica Sinica, 72(1): 116-134.
DOI |
|
| [46] |
吴利禄, 高翔, 褚建民, 等, 2019. 民勤绿洲-荒漠过渡带梭梭人工林净碳交换及其影响因子[J]. 应用生态学报, 30(10): 3336-3346.
DOI |
| WU L L, GAO X, CHU J M, et al., 2019. Net carbon exchange and its driving factors of Haloxylon ammodendron plantation in the oasis-desert ecotone of Minqin, China[J]. Chinese Journal of Applied Ecology, 30(10): 3336-3346. | |
| [47] | 徐新良, 2017a. 中国GDP空间分布公里网格数据集[M]. 北京: 资源环境科学数据注册与出版系统. |
| XU X L, 2017a. Kilometer grid dataset of spatial distribution of China’s GDP[M]. Beijing: Resource and environmental science data registration and publication system. | |
| [48] | 徐新良, 2017b. 中国人口空间分布公里网格数据集[M]. 北京: 资源环境科学数据注册与出版系统. |
| XU X L, 2017b. Kilometer grid dataset of spatial distribution of China’s population[M]. Beijing: Resource and environmental science data registration and publication system. | |
| [49] | 杨元合, 石岳, 孙文娟, 等, 2022. 中国及全球陆地生态系统碳源汇特征及其对碳中和的贡献[J]. 中国科学: 生命科学, 52(4): 534-574. |
| YANG Y H, SHI Y, SUN W J, et al., 2022. Characteristics of carbon sources and sinks in Chinese and global terrestrial ecosystems and their contribution to carbon neutrality[J]. Scientia Sinica Vitae, 52(4): 534-574. | |
| [50] | 冶晓娟, 王永辉, 潘红忠, 等, 2022. 青海省植被NEP时空变化及驱动因素分析[J]. 干旱区研究, 39(5): 1673-1683. |
| YE X J, WANG Y H, PAN H Z, et al., 2022. Spatial-temporal variation and driving factors of vegetation net ecosystem productivity in Qinghai Province[J]. Arid Zone Research, 39(5): 1673-1683 | |
| [51] | 尹云鹤, 吴绍洪, 戴尔阜, 2010. 1971-2008年我国潜在蒸散时空演变的归因[J]. 科学通报, 55(22): 2226-2234. |
|
YIN Y H, WU S H, DAI E F, 2010. Determining factors in potential evapotranspiration changes over China in the period 1971-2008[J]. Chinese Science Bull, 55(22): 2226-2234.
DOI URL |
|
| [52] | 张越, 刘康, 张红娟, 等, 2019. 基于BIOME-BG模型的秦岭北坡太白红杉林碳源/汇动态和趋势研究[J]. 热带亚热带植物学报, 27(3): 235-249. |
| ZHANG Y, LIU K, ZHANG H J, et al., 2019. Carbon source/sink dynamics and trend of Larix chinensis in northern slope of Qinling mountains based on BIOME-BG Model[J]. Journal of Tropical and Subtropical Botany, 27(3): 235-249. | |
| [53] | 赵宁, 周蕾, 庄杰, 等, 2021. 中国陆地生态系统碳源/汇整合分析[J]. 生态学报, 41(19): 7648-7658. |
| ZHAO N, ZHOU L, ZHUANG J, et al., Integration analysis of the carbon sources and sinks in terrestrial ecosystems, China[J]. ACTA Ecologica Sinica, 41(19): 7648-7658. | |
| [54] | 周慧敏, 2021. 陆地生态系统净CO2交换的空间格局及其模型关键参数优化[D]. 上海: 华东师范大学. |
| ZHOU H M, 2021. Spatial pattern of net CO2 exchange in terrestrial ecosystems and optimization of its model parameters[D]. Shanghai: East China Normal University. | |
| [55] | 周立国, 宋清海, 张一平, 等, 2017. 4种森林生态系统光合作用光响应参数特征的比较[J]. 生态学杂志, 36(7): 1815-1824. |
| ZHOU L G, SONG Q H, ZHANG Y P, et al., 2017. Comparison of net ecosystem exchange light-response curve fitted parameters at four types of forest ecosystems[J]. Chinese Journal of Ecology, 36(7): 1815-1824. | |
| [56] |
朱万泽, 2013. 森林碳利用效率研究进展[J]. 植物生态学报, 37(11): 1043-1058.
DOI |
|
ZHU W Z, 2013. Advances in the carbon use efficiency of forest[J]. Chinese Journal of Plant Ecology, 37(11): 1043-1058.
DOI URL |
| [1] | 周玉祥, 赵玉, 聂仁东, 丁丁, 郭立华, 周佳峥. 下辽河平原土地沙漠化程度及预测研究[J]. 生态环境学报, 2023, 32(6): 1133-1139. |
| [2] | 郝蕾, 翟涌光, 戚文超, 兰穹穹. 2001-2020年内蒙古植被碳源/碳汇时空动态及对气候因子的响应[J]. 生态环境学报, 2023, 32(5): 825-834. |
| [3] | 于菲, 曾海龙, 房怀阳, 付玲芳, 林澍, 董家豪. 典型感潮河网浮游藻类功能群时空变化特征及水质评价[J]. 生态环境学报, 2023, 32(4): 756-765. |
| [4] | 王成武, 罗俊杰, 唐鸿湖. 基于InVEST模型的太行山沿线地区生态系统碳储量时空分异驱动力分析[J]. 生态环境学报, 2023, 32(2): 215-225. |
| [5] | 陈治中, 昝梅, 杨雪峰, 董煜. 新疆森林植被碳储量预测研究[J]. 生态环境学报, 2023, 32(2): 226-234. |
| [6] | 郑晓豪, 陈颖彪, 郑子豪, 郭城, 黄卓男, 周泳诗. 湖北省生态系统服务价值动态变化及其影响因素演变[J]. 生态环境学报, 2023, 32(1): 195-206. |
| [7] | 陈科屹, 王建军, 何友均, 张立文. 黑龙江大兴安岭重点国有林区森林碳储量及固碳潜力评估[J]. 生态环境学报, 2022, 31(9): 1725-1734. |
| [8] | 吴胜义, 王飞, 徐干君, 马浩, 党禹杰, 吴菲. 川西北高山峡谷区森林碳储量及空间分布研究--以四川洛须自然保护区为例[J]. 生态环境学报, 2022, 31(9): 1735-1744. |
| [9] | 李梦华, 韩颖娟, 赵慧, 王云霞. 基于地理探测器的宁夏植被覆盖度时空变化特征及其驱动因子分析[J]. 生态环境学报, 2022, 31(7): 1317-1325. |
| [10] | 马辉英, 李昕竹, 马鑫钰, 贡璐. 新疆天山北麓中段不同植被类型下土壤有机碳组分特征及其影响因素[J]. 生态环境学报, 2022, 31(6): 1124-1131. |
| [11] | 陈丽娟, 周文君, 易艳芸, 宋清海, 张一平, 梁乃申, 鲁志云, 温韩东, MOHD Zeeshan, 沙丽清. 云南哀牢山亚热带常绿阔叶林土壤CH4通量特征[J]. 生态环境学报, 2022, 31(5): 949-960. |
| [12] | 钱学诗, 李勇, 钱壮壮, 葛晓敏, 唐罗忠. 北亚热带东部次生阔叶林降水过程中的镉、铅、砷含量变化[J]. 生态环境学报, 2022, 31(5): 979-989. |
| [13] | 温智峰, 魏识广, 李林, 叶万辉, 练琚愉. 南亚热带常绿阔叶林植物不同分类水平上的空间分布格局及空间关联[J]. 生态环境学报, 2022, 31(3): 440-450. |
| [14] | 郝永佩, 宋晓伟, 赵文珺, 向发敏. 汾渭平原大气污染时空分布及相关因子分析[J]. 生态环境学报, 2022, 31(3): 512-523. |
| [15] | 余斐, 叶彩红, 许窕孜, 张中瑞, 朱航勇, 张耕, 华雷, 邓鉴锋, 丁晓纲. 韶关市花岗岩地区森林土壤重金属污染评价[J]. 生态环境学报, 2022, 31(2): 354-362. |
| 阅读次数 | ||||||
|
全文 |
|
|||||
|
摘要 |
|
|||||