生态环境学报 ›› 2022, Vol. 31 ›› Issue (9): 1725-1734.DOI: 10.16258/j.cnki.1674-5906.2022.09.002
陈科屹1( ), 王建军1, 何友均1,*(), 张立文2
收稿日期:2022-06-25
出版日期:2022-09-18
发布日期:2022-11-07
通讯作者:
*何友均(1976年生),男,研究员,博士,研究方向为森林多目标经营管理与评价。E-mail: hyjun163@163.com作者简介:陈科屹(1989年生),男,助理研究员,博士,研究方向为森林生态与森林经营管理。E-mail: Lowrychen@sina.com
基金资助:
CHEN Keyi1(), WANG Jianjun1, HE Youjun1,*(), ZHANG Liwen2
Received:2022-06-25
Online:2022-09-18
Published:2022-11-07
摘要:
国有林区是中国实施碳中和行动的重要区域,准确估算其森林植被碳储量及固碳潜力,对于指导制定应对气候变化策略,统筹区域生态-经济-社会协调发展具有重要意义。以黑龙江大兴安岭重点国有林区为研究对象,基于森林资源二类调查数据,在分树种(组)且分龄组的基础上,采用材积源生物量法对其森林植被碳储量和碳密度进行了测算。运用空间代替时间法,并结合林区植被生态区划情况和地带性顶级群落类型,对林区森林植被固碳潜力进行了评估。结果表明,(1)黑龙江大兴安岭重点国有林区森林植被总碳储量为2.7246×10⁸ Mg,平均碳密度为39.46 Mg∙hm-2。乔木林碳储量占比高达99.93%,其平均碳密度是灌木林的4.00倍、疏林的3.72倍。(2)不同区域森林植被碳储量和碳密度差异悬殊,碳储量最多和最少的区域分别是新林林业局(3.4497×10⁷ Mg)和盘中自然保护区(1.0936×10⁶ Mg),碳密度最大和最小的区域分别是双河自然保护区(59.68 Mg∙hm-2)和盘中自然保护区(22.11 Mg∙hm-2);自然保护区的设立和合理有序的人为干预对于提升森林植被固碳能力具有一定的积极作用。(3)落叶松林(Larix gmelinii)碳储量占比接近林区总碳储量的1/2,樟子松林(Pinus sylvestris var. mongolica)平均碳密度远高于其他森林类型。(4)碳储量最多和平均碳密度最大的林种分别是一般用材林和母树林。(5)中龄林是碳储量最多的龄组,平均碳密度随龄组的增加而增大。(6)林区总固碳潜力为1.9367×10⁸ Mg,主体贡献源于现存森林植被的生长。建议加强天然次生林保护与修复的理论研究和技术研发,提高森林生态系统质量和稳定性,增强其固碳增汇能力。创新森林植被固碳增汇管理,拓展林业碳汇生态产品价值实现路径。
中图分类号:
陈科屹, 王建军, 何友均, 张立文. 黑龙江大兴安岭重点国有林区森林碳储量及固碳潜力评估[J]. 生态环境学报, 2022, 31(9): 1725-1734.
CHEN Keyi, WANG Jianjun, HE Youjun, ZHANG Liwen. Estimations of Forest Carbon Storage and Carbon Sequestration Potential of Key State-Owned Forest Region in Daxing’anling, Heilongjiang Province[J]. Ecology and Environment, 2022, 31(9): 1725-1734.
| 树种(组) Species (group) | FBE | R | D | F | |||||||||
|---|---|---|---|---|---|---|---|---|---|---|---|---|---|
| 幼龄林 Sapling | 中龄林 Immature | 近熟林 Near-mature | 成熟林 Mature | 过熟林 Overmature | 幼龄林Sapling | 中龄林 Immature | 近熟林 Near-mature | 成熟林 Mature | 过熟林 Overmature | ||||
| 落叶松 Larix gmelinii | 1.416 | 1.644 | 1.281 | 1.229 | 1.150 | 0.212 | 0.205 | 0.211 | 0.188 | 0.239 | 0.490 | 0.521 | |
| 樟子松 Pinus sylvestris var. mongolica | 2.513 | 2.919 | 1.864 | 1.789 | 1.827 | 0.241 | 0.241 | 0.241 | 0.241 | 0.241 | 0.375 | 0.522 | |
| 杨树 Aspen spp. | 1.446 | 1.496 | 1.369 | 1.390 | 1.460 | 0.227 | 0.259 | 0.227 | 0.171 | 0.209 | 0.378 | 0.485 | |
| 桦树 Birch spp. | 1.424 | 1.526 | 1.396 | 1.252 | 1.109 | 0.248 | 0.229 | 0.279 | 0.235 | 0.190 | 0.541 | 0.491 | |
| 柳树 Willow spp. | 1.821 | 1.821 | 1.821 | 1.821 | 1.821 | 0.288 | 0.288 | 0.288 | 0.288 | 0.288 | 0.443 | 0.485 | |
| 红松 Pinus koraiensis | 1.510 | 1.558 | 1.267 | 1.413 | 1.340 | 0.221 | 0.223 | 0.211 | 0.217 | 0.215 | 0.396 | 0.511 | |
| 椴树 Linden spp. | 1.407 | 1.407 | 1.407 | 1.407 | 1.407 | 0.201 | 0.201 | 0.201 | 0.201 | 0.201 | 0.420 | 0.439 | |
| 蒙古栎 Quercus mongolica | 1.355 | 1.380 | 1.327 | 1.360 | 1.474 | 0.292 | 0.260 | 0.275 | 0.410 | 0.281 | 0.676 | 0.500 | |
| 水曲柳 Fraxinus mandschurica | 1.293 | 1.293 | 1.293 | 1.293 | 1.293 | 0.221 | 0.221 | 0.221 | 0.221 | 0.221 | 0.464 | 0.497 | |
| 云杉 Picea asperata | 1.734 | 2.326 | 1.516 | 1.473 | 1.427 | 0.224 | 0.185 | 0.224 | 0.244 | 0.302 | 0.342 | 0.521 | |
| 其他温带杉类 Other temperate fir species | 1.667 | 2.300 | 1.382 | 1.459 | 1.245 | 0.277 | 0.302 | 0.274 | 0.238 | 0.218 | 0.359 | 0.510 | |
| 其他温带松类 Other temperate pine species | 1.631 | 1.881 | 1.461 | 1.456 | 1.200 | 0.206 | 0.213 | 0.216 | 0.202 | 0.284 | 0.424 | 0.511 | |
| 软阔类 Soft broadleaf | 1.586 | 1.729 | 1.489 | 1.254 | 1.432 | 0.289 | 0.278 | 0.282 | 0.276 | 0.412 | 0.443 | 0.485 | |
| 硬阔类 Hard broadleaf | 1.674 | 1.799 | 1.543 | 1.172 | 1.368 | 0.261 | 0.257 | 0.296 | 0.160 | 0.294 | 0.598 | 0.497 | |
表1 各树种(组)生物量模型参数及含碳系数
Table 1 Biomass model parameters and carbon content coefficients of tree species (groups)
| 树种(组) Species (group) | FBE | R | D | F | |||||||||
|---|---|---|---|---|---|---|---|---|---|---|---|---|---|
| 幼龄林 Sapling | 中龄林 Immature | 近熟林 Near-mature | 成熟林 Mature | 过熟林 Overmature | 幼龄林Sapling | 中龄林 Immature | 近熟林 Near-mature | 成熟林 Mature | 过熟林 Overmature | ||||
| 落叶松 Larix gmelinii | 1.416 | 1.644 | 1.281 | 1.229 | 1.150 | 0.212 | 0.205 | 0.211 | 0.188 | 0.239 | 0.490 | 0.521 | |
| 樟子松 Pinus sylvestris var. mongolica | 2.513 | 2.919 | 1.864 | 1.789 | 1.827 | 0.241 | 0.241 | 0.241 | 0.241 | 0.241 | 0.375 | 0.522 | |
| 杨树 Aspen spp. | 1.446 | 1.496 | 1.369 | 1.390 | 1.460 | 0.227 | 0.259 | 0.227 | 0.171 | 0.209 | 0.378 | 0.485 | |
| 桦树 Birch spp. | 1.424 | 1.526 | 1.396 | 1.252 | 1.109 | 0.248 | 0.229 | 0.279 | 0.235 | 0.190 | 0.541 | 0.491 | |
| 柳树 Willow spp. | 1.821 | 1.821 | 1.821 | 1.821 | 1.821 | 0.288 | 0.288 | 0.288 | 0.288 | 0.288 | 0.443 | 0.485 | |
| 红松 Pinus koraiensis | 1.510 | 1.558 | 1.267 | 1.413 | 1.340 | 0.221 | 0.223 | 0.211 | 0.217 | 0.215 | 0.396 | 0.511 | |
| 椴树 Linden spp. | 1.407 | 1.407 | 1.407 | 1.407 | 1.407 | 0.201 | 0.201 | 0.201 | 0.201 | 0.201 | 0.420 | 0.439 | |
| 蒙古栎 Quercus mongolica | 1.355 | 1.380 | 1.327 | 1.360 | 1.474 | 0.292 | 0.260 | 0.275 | 0.410 | 0.281 | 0.676 | 0.500 | |
| 水曲柳 Fraxinus mandschurica | 1.293 | 1.293 | 1.293 | 1.293 | 1.293 | 0.221 | 0.221 | 0.221 | 0.221 | 0.221 | 0.464 | 0.497 | |
| 云杉 Picea asperata | 1.734 | 2.326 | 1.516 | 1.473 | 1.427 | 0.224 | 0.185 | 0.224 | 0.244 | 0.302 | 0.342 | 0.521 | |
| 其他温带杉类 Other temperate fir species | 1.667 | 2.300 | 1.382 | 1.459 | 1.245 | 0.277 | 0.302 | 0.274 | 0.238 | 0.218 | 0.359 | 0.510 | |
| 其他温带松类 Other temperate pine species | 1.631 | 1.881 | 1.461 | 1.456 | 1.200 | 0.206 | 0.213 | 0.216 | 0.202 | 0.284 | 0.424 | 0.511 | |
| 软阔类 Soft broadleaf | 1.586 | 1.729 | 1.489 | 1.254 | 1.432 | 0.289 | 0.278 | 0.282 | 0.276 | 0.412 | 0.443 | 0.485 | |
| 硬阔类 Hard broadleaf | 1.674 | 1.799 | 1.543 | 1.172 | 1.368 | 0.261 | 0.257 | 0.296 | 0.160 | 0.294 | 0.598 | 0.497 | |
| 植被生态小区Vegetation ecodistrict | 涉及区域Corresponding region |
|---|---|
| 大兴安岭北部樟子松兴安落叶松林生态小区 Ecodistrict of Pinus sylvestris var. mongolica and Larix gmelinii forest in thenorth of Daxing’anling | 漠河林业局、图强林业局、阿木尔林业局、塔河林业局、北极村自然保护区、岭峰自然保护区、盘中自然保护区 |
| 大兴安岭东部蒙古栎兴安落叶松林生态小区 Ecodistrict of Quercus mongolica and Larix gmelinii forest in theeast of Daxing’anling | 十八站林业局、呼中林业局、新林林业局、双河自然保护区、呼中自然保护区 |
| 黑嫩高平原蒙古栎林生态小区 Ecodistrict of Quercus mongolica forest in thehigh plain of Heihe-Nenjiang | 松岭林业局、加格达奇林业局、韩家园林业局、南瓮河自然保护区、绰纳河自然保护区、多布库尔自然保护区 |
表2 研究区植被生态区划
Table 2 Ecological regionalization of vegetation in the study area
| 植被生态小区Vegetation ecodistrict | 涉及区域Corresponding region |
|---|---|
| 大兴安岭北部樟子松兴安落叶松林生态小区 Ecodistrict of Pinus sylvestris var. mongolica and Larix gmelinii forest in thenorth of Daxing’anling | 漠河林业局、图强林业局、阿木尔林业局、塔河林业局、北极村自然保护区、岭峰自然保护区、盘中自然保护区 |
| 大兴安岭东部蒙古栎兴安落叶松林生态小区 Ecodistrict of Quercus mongolica and Larix gmelinii forest in theeast of Daxing’anling | 十八站林业局、呼中林业局、新林林业局、双河自然保护区、呼中自然保护区 |
| 黑嫩高平原蒙古栎林生态小区 Ecodistrict of Quercus mongolica forest in thehigh plain of Heihe-Nenjiang | 松岭林业局、加格达奇林业局、韩家园林业局、南瓮河自然保护区、绰纳河自然保护区、多布库尔自然保护区 |
| 区域 Region | 碳储量Carbon storage/Mg | 平均碳密度 Average carbon density/(Mg∙hm-2) | ||||
|---|---|---|---|---|---|---|
| 合计 Total | 乔木林 Arbor forest | 灌木林 Shrubwood | 疏林 Open forest | 苗圃 Nursery | ||
| 阿木尔林业局 Amuer Forestry Bureau | 1.6878×10⁷ | 1.6869×10⁷ | 5.2804×10³ | 3.1735×10³ | 0 | 37.97 |
| 北极村自然保护区 Beijicun Natural Reserve | 5.3070×10⁶ | 5.3064×10⁶ | 0 | 6.3747×10² | 0 | 40.59 |
| 绰纳河自然保护区 Chaonahe Natural Reserve | 5.2231×10⁶ | 5.2227×10⁶ | 0 | 4.0531×10² | 0 | 56.55 |
| 多布库尔自然保护区 Duobukuer Natural Reserve | 2.9910×10⁶ | 2.9910×10⁶ | 0 | 0 | 1.5808×10² | 36.15 |
| 韩家园林业局 Hanjiayuan Forestry Bureau | 2.2189×10⁷ | 2.2185×10⁷ | 3.7960×10³ | 2.7860×101 | 1.7784×10² | 35.89 |
| 呼中林业局 Huzhong Forestry Bureau | 3.1463×10⁷ | 3.1409×10⁷ | 5.3936×10⁴ | 4.9881×10² | 0 | 42.16 |
| 呼中自然保护区 Huzhong Natural Reserve | 8.2328×10⁶ | 8.1932×10⁶ | 3.9521×10⁴ | 0 | 4.9400×10² | 52.73 |
| 加格达奇林业局 Jiagedaqi Forestry Bureau | 2.0062×10⁷ | 2.0062×10⁷ | 0 | 4.3520×101 | 0 | 36.97 |
| 岭峰自然保护区 Lingfeng Natural Reserve | 3.0699×10⁶ | 3.0666×10⁶ | 3.3467×10³ | 0 | 0 | 45.27 |
| 南瓮河自然保护区 Nanwenghe Natural Reserve | 6.7677×10⁶ | 6.7674×10⁶ | 0 | 2.7828×10² | 0 | 47.88 |
| 盘中自然保护区 Panzhong Natural Reserve | 1.0936×10⁶ | 1.0936×10⁶ | 0 | 0 | 0 | 22.11 |
| 十八站林业局 Shibazhan Forestry Bureau | 1.5677×10⁷ | 1.5671×10⁷ | 2.5589×10² | 6.1629×10³ | 4.0508×10² | 29.69 |
| 双河自然保护区 Shuanghe Natural Reserve | 4.7940×10⁶ | 4.7906×10⁶ | 0 | 3.3895×10³ | 0 | 59.68 |
| 松岭林业局 Songling Forestry Bureau | 2.2955×10⁷ | 2.2950×10⁷ | 5.1663×10² | 4.8161×10³ | 2.6625×10² | 38.92 |
| 塔河林业局 Tahe Forestry Bureau | 3.2399×10⁷ | 3.2390×10⁷ | 7.0779×10³ | 6.9079×10² | 9.6824×10² | 40.80 |
| 图强林业局 Tuqiang Forestry Bureau | 1.6867×10⁷ | 1.6866×10⁷ | 2.2920×101 | 1.5510×101 | 2.0748×10² | 36.26 |
| 漠河林业局 Mohe Forestry Bureau | 2.1998×10⁷ | 2.1969×10⁷ | 1.3900×10⁴ | 1.3669×10⁴ | 8.5956×10² | 39.99 |
| 新林林业局 Xinlin Forestry Bureau | 3.4497×10⁷ | 3.4484×10⁷ | 1.2226×10⁴ | 6.4629×10² | 2.7298×10² | 41.80 |
| 全林区 The whole region | 2.7246×10⁸ | 2.7229×10⁸ | 1.3988×10⁵ | 3.4455×10⁴ | 4.2838×10³ | 39.46 |
表3 各区域森林植被碳储量和碳密度
Table 3 Carbon storage and carbon density of forest vegetation in different regions
| 区域 Region | 碳储量Carbon storage/Mg | 平均碳密度 Average carbon density/(Mg∙hm-2) | ||||
|---|---|---|---|---|---|---|
| 合计 Total | 乔木林 Arbor forest | 灌木林 Shrubwood | 疏林 Open forest | 苗圃 Nursery | ||
| 阿木尔林业局 Amuer Forestry Bureau | 1.6878×10⁷ | 1.6869×10⁷ | 5.2804×10³ | 3.1735×10³ | 0 | 37.97 |
| 北极村自然保护区 Beijicun Natural Reserve | 5.3070×10⁶ | 5.3064×10⁶ | 0 | 6.3747×10² | 0 | 40.59 |
| 绰纳河自然保护区 Chaonahe Natural Reserve | 5.2231×10⁶ | 5.2227×10⁶ | 0 | 4.0531×10² | 0 | 56.55 |
| 多布库尔自然保护区 Duobukuer Natural Reserve | 2.9910×10⁶ | 2.9910×10⁶ | 0 | 0 | 1.5808×10² | 36.15 |
| 韩家园林业局 Hanjiayuan Forestry Bureau | 2.2189×10⁷ | 2.2185×10⁷ | 3.7960×10³ | 2.7860×101 | 1.7784×10² | 35.89 |
| 呼中林业局 Huzhong Forestry Bureau | 3.1463×10⁷ | 3.1409×10⁷ | 5.3936×10⁴ | 4.9881×10² | 0 | 42.16 |
| 呼中自然保护区 Huzhong Natural Reserve | 8.2328×10⁶ | 8.1932×10⁶ | 3.9521×10⁴ | 0 | 4.9400×10² | 52.73 |
| 加格达奇林业局 Jiagedaqi Forestry Bureau | 2.0062×10⁷ | 2.0062×10⁷ | 0 | 4.3520×101 | 0 | 36.97 |
| 岭峰自然保护区 Lingfeng Natural Reserve | 3.0699×10⁶ | 3.0666×10⁶ | 3.3467×10³ | 0 | 0 | 45.27 |
| 南瓮河自然保护区 Nanwenghe Natural Reserve | 6.7677×10⁶ | 6.7674×10⁶ | 0 | 2.7828×10² | 0 | 47.88 |
| 盘中自然保护区 Panzhong Natural Reserve | 1.0936×10⁶ | 1.0936×10⁶ | 0 | 0 | 0 | 22.11 |
| 十八站林业局 Shibazhan Forestry Bureau | 1.5677×10⁷ | 1.5671×10⁷ | 2.5589×10² | 6.1629×10³ | 4.0508×10² | 29.69 |
| 双河自然保护区 Shuanghe Natural Reserve | 4.7940×10⁶ | 4.7906×10⁶ | 0 | 3.3895×10³ | 0 | 59.68 |
| 松岭林业局 Songling Forestry Bureau | 2.2955×10⁷ | 2.2950×10⁷ | 5.1663×10² | 4.8161×10³ | 2.6625×10² | 38.92 |
| 塔河林业局 Tahe Forestry Bureau | 3.2399×10⁷ | 3.2390×10⁷ | 7.0779×10³ | 6.9079×10² | 9.6824×10² | 40.80 |
| 图强林业局 Tuqiang Forestry Bureau | 1.6867×10⁷ | 1.6866×10⁷ | 2.2920×101 | 1.5510×101 | 2.0748×10² | 36.26 |
| 漠河林业局 Mohe Forestry Bureau | 2.1998×10⁷ | 2.1969×10⁷ | 1.3900×10⁴ | 1.3669×10⁴ | 8.5956×10² | 39.99 |
| 新林林业局 Xinlin Forestry Bureau | 3.4497×10⁷ | 3.4484×10⁷ | 1.2226×10⁴ | 6.4629×10² | 2.7298×10² | 41.80 |
| 全林区 The whole region | 2.7246×10⁸ | 2.7229×10⁸ | 1.3988×10⁵ | 3.4455×10⁴ | 4.2838×10³ | 39.46 |
| 树种(组) Species (group) | 碳储量 Carbon storage/Mg | 碳储量占比 Carbon storage ratio/% | 面积 Area/hm2 | 平均碳密度 Average carbon density/(Mg∙hm-2) |
|---|---|---|---|---|
| 落叶松 Larix gmelinii | 1.3364×10⁸ | 49.05 | 3.2075×10⁶ | 41.66 |
| 桦树 Birch spp. | 1.1633×10⁸ | 42.70 | 3.0174×10⁶ | 38.55 |
| 杨树 Aspen spp. | 8.9111×10⁶ | 3.27 | 3.4629×10⁵ | 25.73 |
| 樟子松 Pinus sylvestris var. mongolica | 5.8880×10⁶ | 2.16 | 9.3648×10⁴ | 62.87 |
| 蒙古栎 Quercus mongolica | 5.6706×10⁶ | 2.08 | 1.7630×10⁵ | 32.16 |
| 云杉 Picea asperata | 1.0504×10⁶ | 0.39 | 2.8712×10⁴ | 36.58 |
| 柳树 Willow spp. | 7.9191×10⁵ | 0.29 | 2.1802×10⁴ | 36.32 |
| 水曲柳 Fraxinus mandschurica | 2.3853×10⁴ | 0.01 | 5.5230×10² | 43.19 |
| 其他 Others | 1.5641×10⁵ | 0.06 | 1.4744×10⁴ | 10.31 |
表4 主要优势树种碳储量和碳密度
Table 4 Carbon storage and carbon density of dominant tree species
| 树种(组) Species (group) | 碳储量 Carbon storage/Mg | 碳储量占比 Carbon storage ratio/% | 面积 Area/hm2 | 平均碳密度 Average carbon density/(Mg∙hm-2) |
|---|---|---|---|---|
| 落叶松 Larix gmelinii | 1.3364×10⁸ | 49.05 | 3.2075×10⁶ | 41.66 |
| 桦树 Birch spp. | 1.1633×10⁸ | 42.70 | 3.0174×10⁶ | 38.55 |
| 杨树 Aspen spp. | 8.9111×10⁶ | 3.27 | 3.4629×10⁵ | 25.73 |
| 樟子松 Pinus sylvestris var. mongolica | 5.8880×10⁶ | 2.16 | 9.3648×10⁴ | 62.87 |
| 蒙古栎 Quercus mongolica | 5.6706×10⁶ | 2.08 | 1.7630×10⁵ | 32.16 |
| 云杉 Picea asperata | 1.0504×10⁶ | 0.39 | 2.8712×10⁴ | 36.58 |
| 柳树 Willow spp. | 7.9191×10⁵ | 0.29 | 2.1802×10⁴ | 36.32 |
| 水曲柳 Fraxinus mandschurica | 2.3853×10⁴ | 0.01 | 5.5230×10² | 43.19 |
| 其他 Others | 1.5641×10⁵ | 0.06 | 1.4744×10⁴ | 10.31 |
| 林种 Forest categories | 碳储量 Carbon storage/Mg | 碳储量占比 Carbon storage ratio/% | 平均碳密度 Average carbon density/(Mg∙hm-2) | |
|---|---|---|---|---|
| 防护林 Protection forest | 水源涵养林 Forest for conservation of water supply | 3.5389×10⁷ | 12.99 | 42.28 |
| 护岸林 Forest for protection of river bank | 1.8835×10⁷ | 6.91 | 36.94 | |
| 用材林 Timber forest | 一般用材林 General timber forest | 1.0573×10⁸ | 38.81 | 38.44 |
| 短轮伐期工业原料用材林 Timber for industrial raw materials in short rotation | 1.9590×10⁷ | 7.19 | 39.86 | |
| 特种用途林 Forest for special purpose | 国防林 Forest for national defense | 4.0757×10⁶ | 1.50 | 33.49 |
| 实验林 Forest for experiment | 2.5529×10⁵ | 0.09 | 41.00 | |
| 母树林 Forest for seed production | 5.2765×10⁵ | 0.19 | 47.64 | |
| 环境保护林 Forest for environmental protection | 4.2869×10⁵ | 0.16 | 43.38 | |
| 风景林 Forest for scenery | 1.0891×10⁵ | 0.04 | 39.50 | |
| 自然保护林 Forest for natural conservation | 1.6513×10⁷ | 6.06 | 44.24 | |
表5 不同林种碳储量和碳密度
Table 5 Carbon storage and carbon density in different forest categories
| 林种 Forest categories | 碳储量 Carbon storage/Mg | 碳储量占比 Carbon storage ratio/% | 平均碳密度 Average carbon density/(Mg∙hm-2) | |
|---|---|---|---|---|
| 防护林 Protection forest | 水源涵养林 Forest for conservation of water supply | 3.5389×10⁷ | 12.99 | 42.28 |
| 护岸林 Forest for protection of river bank | 1.8835×10⁷ | 6.91 | 36.94 | |
| 用材林 Timber forest | 一般用材林 General timber forest | 1.0573×10⁸ | 38.81 | 38.44 |
| 短轮伐期工业原料用材林 Timber for industrial raw materials in short rotation | 1.9590×10⁷ | 7.19 | 39.86 | |
| 特种用途林 Forest for special purpose | 国防林 Forest for national defense | 4.0757×10⁶ | 1.50 | 33.49 |
| 实验林 Forest for experiment | 2.5529×10⁵ | 0.09 | 41.00 | |
| 母树林 Forest for seed production | 5.2765×10⁵ | 0.19 | 47.64 | |
| 环境保护林 Forest for environmental protection | 4.2869×10⁵ | 0.16 | 43.38 | |
| 风景林 Forest for scenery | 1.0891×10⁵ | 0.04 | 39.50 | |
| 自然保护林 Forest for natural conservation | 1.6513×10⁷ | 6.06 | 44.24 | |
| 龄组 Age group | 合计 Total | 天然林 Natural forest | 人工林 Artificial forest | |||||
|---|---|---|---|---|---|---|---|---|
| 碳储量 Carbon storage/ Mg | 平均碳密度 Average carbon density/ (Mg∙hm-2) | 碳储量 Carbon storage/ Mg | 平均碳密度 Average carbon density/ (Mg∙hm-2) | 碳储量 Carbon storage/ Mg | 平均碳密度 Average carbon density/ (Mg∙hm-2) | |||
| 幼龄林 Sapling | 1.9664×10⁷ | 19.20 | 1.9159×10⁷ | 19.06 | 5.0471×10⁵ | 26.22 | ||
| 中龄林 Immature | 1.7303×10⁸ | 41.42 | 1.6938×10⁸ | 41.84 | 3.6446×10⁶ | 28.21 | ||
| 近熟林Near-mature | 4.2534×10⁷ | 45.72 | 4.1417×10⁷ | 45.90 | 1.1168×10⁶ | 39.85 | ||
| 成熟林 Mature | 3.2571×10⁷ | 48.90 | 3.2489×10⁷ | 48.87 | 8.1905×10⁴ | 60.50 | ||
| 过熟林 Overmature | 4.4901×10⁶ | 50.16 | 4.4861×10⁶ | 50.18 | 4.0109×10³ | 37.40 | ||
| 合计 Total | 2.7229×10⁸ | 39.53 | 2.6693×10⁸ | 39.78 | 5.3520×10⁶ | 30.08 | ||
表6 不同龄组森林植被碳储量和碳密度
Table 6 Forest vegetation carbon storage and carbon density in different age groups
| 龄组 Age group | 合计 Total | 天然林 Natural forest | 人工林 Artificial forest | |||||
|---|---|---|---|---|---|---|---|---|
| 碳储量 Carbon storage/ Mg | 平均碳密度 Average carbon density/ (Mg∙hm-2) | 碳储量 Carbon storage/ Mg | 平均碳密度 Average carbon density/ (Mg∙hm-2) | 碳储量 Carbon storage/ Mg | 平均碳密度 Average carbon density/ (Mg∙hm-2) | |||
| 幼龄林 Sapling | 1.9664×10⁷ | 19.20 | 1.9159×10⁷ | 19.06 | 5.0471×10⁵ | 26.22 | ||
| 中龄林 Immature | 1.7303×10⁸ | 41.42 | 1.6938×10⁸ | 41.84 | 3.6446×10⁶ | 28.21 | ||
| 近熟林Near-mature | 4.2534×10⁷ | 45.72 | 4.1417×10⁷ | 45.90 | 1.1168×10⁶ | 39.85 | ||
| 成熟林 Mature | 3.2571×10⁷ | 48.90 | 3.2489×10⁷ | 48.87 | 8.1905×10⁴ | 60.50 | ||
| 过熟林 Overmature | 4.4901×10⁶ | 50.16 | 4.4861×10⁶ | 50.18 | 4.0109×10³ | 37.40 | ||
| 合计 Total | 2.7229×10⁸ | 39.53 | 2.6693×10⁸ | 39.78 | 5.3520×10⁶ | 30.08 | ||
| 地类 Type of land use | 碳储量 Carbon storage/Mg | 碳容量 Carboncapacity/Mg | 固碳潜力 Carbon sequestration potential/Mg |
|---|---|---|---|
| 乔木林地 Arboreal lands | 2.7229×10⁸ | 4.1246×10⁸ | 1.4017×10⁸ |
| 灌木林地 Shrubland | 1.3988×10⁵ | 1.3988×10⁵ | - |
| 疏林地 Open forest land | 3.4455×10⁴ | 1.8336×10⁵ | 1.4891×10⁵ |
| 苗圃地 Nursery Land | 4.2838×10³ | 4.2838×10³ | - |
| 宜林荒山荒地 Barren mountains and wastelands suitable for forests | 0 | 5.2246×10⁶ | 5.2246×10⁶ |
| 宜林沙荒地 Wasteland suitable for forests | 0 | 1.2296×10⁶ | 1.2296×10⁶ |
| 其他宜林地 Other suitable land for forest | 0 | 4.6395×10⁷ | 4.6395×10⁷ |
| 未成林造林地 Afforest land | 0 | 1.2836×10⁵ | 1.2836×10⁵ |
| 其他无立木林地 Other non-standing woodlands | 0 | 3.1388×10⁵ | 3.1388×10⁵ |
| 火烧迹地 Burned area | 0 | 5.7425×10⁴ | 5.7425×10⁴ |
| 采伐迹地 Cutover land | 0 | 1.1875×10³ | 1.1875×10³ |
| 合计 Total | 2.7246×10⁸ | 4.6614×10⁸ | 1.9367×10⁸ |
表7 不同林地类型固碳潜力
Table 7 Carbon sequestration potential of different forest types
| 地类 Type of land use | 碳储量 Carbon storage/Mg | 碳容量 Carboncapacity/Mg | 固碳潜力 Carbon sequestration potential/Mg |
|---|---|---|---|
| 乔木林地 Arboreal lands | 2.7229×10⁸ | 4.1246×10⁸ | 1.4017×10⁸ |
| 灌木林地 Shrubland | 1.3988×10⁵ | 1.3988×10⁵ | - |
| 疏林地 Open forest land | 3.4455×10⁴ | 1.8336×10⁵ | 1.4891×10⁵ |
| 苗圃地 Nursery Land | 4.2838×10³ | 4.2838×10³ | - |
| 宜林荒山荒地 Barren mountains and wastelands suitable for forests | 0 | 5.2246×10⁶ | 5.2246×10⁶ |
| 宜林沙荒地 Wasteland suitable for forests | 0 | 1.2296×10⁶ | 1.2296×10⁶ |
| 其他宜林地 Other suitable land for forest | 0 | 4.6395×10⁷ | 4.6395×10⁷ |
| 未成林造林地 Afforest land | 0 | 1.2836×10⁵ | 1.2836×10⁵ |
| 其他无立木林地 Other non-standing woodlands | 0 | 3.1388×10⁵ | 3.1388×10⁵ |
| 火烧迹地 Burned area | 0 | 5.7425×10⁴ | 5.7425×10⁴ |
| 采伐迹地 Cutover land | 0 | 1.1875×10³ | 1.1875×10³ |
| 合计 Total | 2.7246×10⁸ | 4.6614×10⁸ | 1.9367×10⁸ |
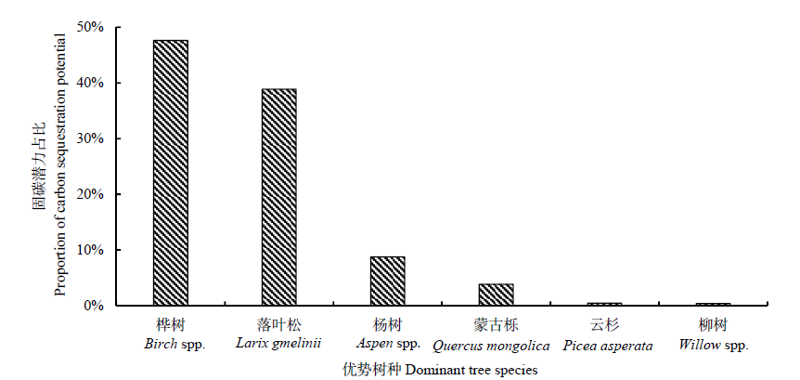
图1 乔木林主要优势树种固碳潜力占比
Figure 1 Proportion of carbon sequestration potential of dominant tree species in arbor forest
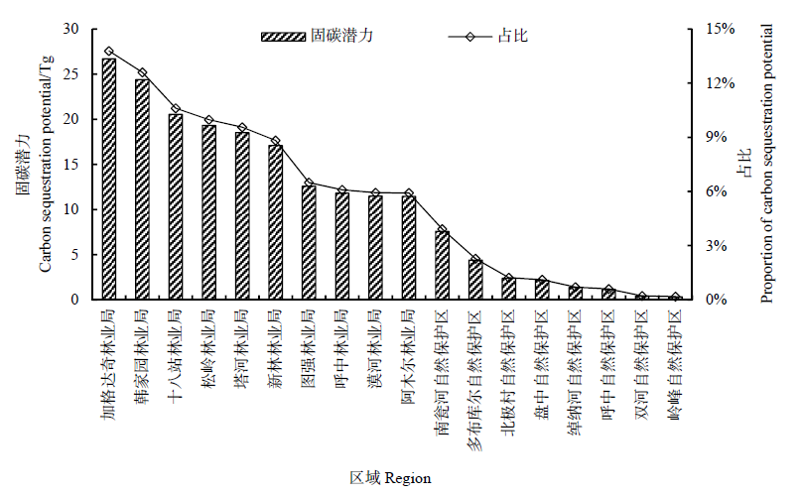
图2 不同区域的固碳潜力及其占比
Figure 2 Carbon sequestration potential and its proportion in different regions
| [1] |
AVITABILE V, CAMIA A, 2018. An assessment of forest biomass maps in Europe using harmonized national statistics and inventory plots[J]. Forest Ecology and Management, 409: 489-498.
DOI PMID |
| [2] |
FANG J Y, KATO T, GUO Z D, et al., 2014. Evidence for environmentally enhanced forest growth[J]. Proceedings of the National Academy of Sciences of the United States of America, 111(26): 9527-9532.
DOI PMID |
| [3] | FAO, 2020. Global Forest Resources Assessment 2020, Main report[R]. Rome: FAO. |
| [4] |
HAYWOOD A, STONE C, 2017. Estimating large area forest carbon stocks: Apragmatic design based strategy[J]. Forests, 8(4): 93-99.
DOI URL |
| [5] | HURTEAU M D, 2017. Quantifying the carbon balance of forest restoration and wildfire under projected climate in the fire-prone southwestern US[J]. PloS ONE, 12(1): e0169275. |
| [6] |
KALLIO A M I, SALMINEN O, SIEVÄNEN R, 2016. Forests in the Finnish low carbon scenarios[J]. Journal of Forest Economics, 23: 45-62.
DOI URL |
| [7] | REINMANN A B, HUTYRA L R, TRLICA A, et al., 2016. Assessing the global warming potential of human settlement expansion in a mesic temperate landscape from 2005 to 2050[J]. Science of the Total Environment, 545-546: 512-524. |
| [8] |
SHARMA T, KURZ W A, STINSON G, et al., 2013. A 100-year conservation experiment: impacts on forest carbon stocks and fluxes[J]. Forest Ecology and Management, 310: 242-255.
DOI URL |
| [9] |
WANG J, FENG L, PALMER P I, et al., 2020. Large Chinese land carbon sink estimated from atmospheric carbon dioxide data[J]. Nature, 586(7831): 720-723.
DOI URL |
| [10] |
YIN Y H, MA D Y, WU S H, 2018. Climate change risk to forests in China associated with warming[J]. Scientific Reports, 8: 493.
DOI PMID |
| [11] | 曹吉鑫, 田赟, 王小平, 等, 2009. 森林碳汇的估算方法及其发展趋势[J]. 生态环境学报, 18(5): 2001-2005. |
| CAO J X, TIAN Y, WANG X P, et al., 2009. Estimation methods of forest sequestration and their prospects[J]. Ecology and Environmental Sciences, 18(5): 2001-2005. | |
| [12] | 陈科屹, 刘润华, 张博, 等, 2021. 武汉市环城林带森林碳储量及其动态变化[J]. 水土保持研究, 28(2): 54-59, 66. |
| CHEN K Y, LIU R H, ZHANG B, et al., 2021. Forest carbon storage and its dynamic changes of the city-encircling forest belt of Wuhan City[J]. Research of Soil and Water Conservation, 28(2): 54-59, 66. | |
| [13] | 方精云, 刘国华, 徐嵩龄, 1996. 我国森林植被的生物量和净生产量[J]. 生态学报, 16(5): 497-508. |
| FANG J Y, LIU G H, XU S L, 2000. Biomass and net production of forest vegetation in China[J]. Acta Ecologica Sinica, 16(5): 497-508. | |
| [14] | 方精云, 朱江玲, 石岳, 2018. 生态系统对全球变暖的响应[J]. 科学通报, 63(2): 136-140. |
| FANG J Y, ZHU J L, SHI Y, 2018. The responses of ecosystems to global warming[J]. Chinese Science Bulletin, 63(2): 136-140. | |
| [15] | 冯丹娃, 刘向越, 曹玉昆, 2022. “双碳”目标下重点国有林区后发优势研究[J]. 学习与探索 (4): 148-152. |
| FENG D W, LIU X Y, CAO Y K, 2022. Research on backwardness advantage of key state-owned forest regions under “peak carbon dioxide emission and carbon neutrality” target[J]. Study and Exploration (4): 148-152. | |
| [16] | 顾云春, 1985. 大兴安岭林区森林群落的演替. 植物生态学报, 9(1): 64-70. |
| GU Y C, 1985. The succession of forest communities in the forest region of the Greater Xingan Moutains[J]. Acta Phytoecologica et Geobotanica Sinica, 9(1): 64-70. | |
| [17] | 国家发展和改革委员会应对气候变化司, 2014. 中国温室气体清单研究[M]. 北京: 中国环境出版社. |
| Department of Climate Change, National DEvelopment and Reform Commission, 2014. Greenhouse gas inventory research in China[M]. Beijing: China Environmental Press. | |
| [18] | 胡海清, 罗碧珍, 魏书精, 等, 2015. 大兴安岭5种典型林型森林生物碳储量[J]. 生态学报, 35(17): 5745-5760. |
| HU H Q, LUO B Z, WEI S J, et al., 2015. Estimating biological carbon storage of five typical forest types in the Daxing' anling Mountains, Heilongjiang, China[J]. Acta Ecologica Sinica, 35(17): 5745-5760. | |
| [19] | 李海奎, 雷渊才, 2010. 中国森林植被生物量和碳储量评估[M]. 北京: 中国林业出版社. |
| LI H K, LEI Y C, 2010. The assessment of forest vegetation biomass and carbon storage in China[M]. Beijing: China Forestry Publishing House. | |
| [20] | 李奇, 朱建华, 冯源, 等, 2018. 中国森林乔木林碳储量及其固碳潜力预测[J]. 气候变化研究进展, 14(3): 287-294. |
| LI Q, ZHU J H, FENG Y, et al., 2018. Carbon storage and carbon sequestration potential of the forest in China[J]. Climate Change Research, 14(3): 287-294. | |
| [21] | 刘迎春, 高显连, 付超, 等, 2019. 基于森林资源清查数据估算中国森林生物量固碳潜力[J]. 生态学报, 39(11): 4002-4010. |
| LIU Y C, GAO X L, FU C, et al., 2019. Estimation of carbon sequestration potential of forest biomass in China based on national forest resources inventory[J]. Acta Ecologica Sinica, 39(11): 4002-4010. | |
| [22] | 刘迎春, 于贵瑞, 王秋凤, 等, 2015. 基于成熟林生物量整合分析中国森林碳容量和固碳潜力[J]. 中国科学: 生命科学, 45(2): 210-222. |
|
LIU Y C, YU G R, WANG Q F, et al., 2015. Carbon carry capacity and carbon sequestration potential in China based on an integrated analysis of mature forestbiomass[J]. Scientia Sinica Vitae, 45(2): 210-222.
DOI URL |
|
| [23] | 屈红军, 孙晓新, 2021. 大兴安岭过火区不同森林生态系统碳储量的变化[J]. 东北林业大学学报, 49(1): 112-116. |
| QU H J, SUN X X, 2021. Changes of carbon storage offorest ecosystems in “5∙6” forest fire area in Daxing’an Mountains[J]. Journal of Northeast Forestry University, 49(1): 112-116. | |
| [24] | 任继勤, 夏景阳, 2017. 基于碳密度-林龄关系的黑龙江省森林碳汇潜力预测[J]. 环境科学研究, 30(4): 552-558. |
| REN J Q, XIA J Y, 2017. Prediction of forest carbon sink potential in Heilongjiang Province: The carbon density-age relationship-based approach[J]. Research of Environmental Sciences, 30(4): 552-558. | |
| [25] | 史山丹, 赵鹏武, 周梅, 等, 2012. 大兴安岭南部温带山杨天然次生林不同生长阶段生物量及碳储量[J]. 生态环境学报, 21(3): 428-433. |
| SHI S D, ZHAO P W, ZHOU M, et al., 2012. Biomass and carbon storage of the secondary forest (Populus davidiana) at different stand growing stages in southern Daxinganling temperature zone[J]. Ecology and Environmental Sciences, 21(3): 428-433. | |
| [26] | 徐文铎, 何兴元, 陈玮, 等, 2008. 中国东北植被生态区划[J]. 生态学杂志, 27(11): 1853-1860. |
| XU W D, HE X Y, CHEN W, et al., 2008. Ecological division of vegetations in Northeast China[J]. Chinese Journal of Ecology, 27(11): 1853-1860. | |
| [27] | 曾伟生, 陈新云, 蒲莹, 等, 2018. 基于国家森林资源清查数据的不同生物量和碳储量估计方法的对比分析[J]. 林业科学研究, 31(1): 66-71. |
| ZENG W S, CHEN X Y, PU Y, et al., 2018. Comparison of different methods for estimating forest biomass and carbon storage based on National Forest Inventory data[J]. Forest Research, 31(1): 66-71. | |
| [28] | 张春华, 王莉媛, 宋茜薇, 等, 2018. 1973-2013年黑龙江省森林碳储量及其动态变化[J]. 中国环境科学, 38(12): 4678-4686. |
| ZHANG C H, WANG L Y, SONG Q W, et al., 2018. Biomass carbon stocks and dynamics of forests in Heilongjiang Province from 1973 to 2013[J]. China Environmental Science, 38(12): 4678-4686. | |
| [29] | 张颖, 李晓格, 温亚利, 2022. 碳达峰碳中和背景下中国森林碳汇潜力分析研究[J]. 北京林业大学学报, 44(1): 38-47. |
| ZHANG Y, LI X G, WEN Y L, 2022. Forest carbon sequestration potential in China under the background of carbon emission peak and carbon neutralization[J]. Journal of Beijing Forestry University, 44(1): 38-47. | |
| [30] | 张逸如, 刘晓彤, 高文强, 等, 2021. 天然林保护工程区近20年森林植被碳储量动态及碳汇(源)特征[J]. 生态学报, 41(13): 5093-5105. |
| ZHANG Y R, LIU X T, GAO W Q, et al., 2021. Dynamic changes of forest vegetation carbon storage and the characteristics of carbon sink (source) in the Natural Forest Protection Project region for the past 20 years[J]. Acta Ecologica Sinica, 41(13): 5093-5105. | |
| [31] | 张煜星, 王雪军, 2021a. 全国森林蓄积生物量模型建立和碳变化研究[J]. 中国科学: 生命科学, 51(2):199-214. |
|
ZHANG Y X, WANG X J, 2021a. Study on forest volume-to-biomass modeling and carbon storage dynamics in China[J]. Scientia Sinica Vitae, 51(2): 199-214.
DOI URL |
|
| [32] | 张煜星, 王雪军, 蒲莹, 等, 2021b. 1949-2018年中国森林资源碳储量变化研究[J]. 北京林业大学学报, 43(5): 1-14. |
| ZHANG Y X, WANG X J, PU Y, et al., 2021b. Changes in forest resource carbon storage in China between 1949 and 2018[J]. Journal of Beijing Forestry University, 43(5): 1-14. | |
| [33] | 赵苗苗, 赵娜, 刘羽, 等, 2019. 森林碳计量方法研究进展[J]. 生态学报, 39(11): 3797-3807. |
| ZHAO M M, ZHAO N, LIU Y, et al., 2019. An overview of forest carbon measurement methods[J]. Acta Ecologica Sinica, 39(11): 3797-3807. | |
| [34] | 朱万泽, 2020. 成熟森林固碳研究进展[J]. 林业科学, 56(3): 117-126. |
| ZHU W Z, 2020. Advances in the carbon sequestration of mature forests[J]. Scientia Silvae Sinicae, 56(3): 117-126. |
| [1] | 陈科屹, 林田苗, 王建军, 何友均, 张立文. 天保工程20年对黑龙江大兴安岭国有林区森林碳库的影响[J]. 生态环境学报, 2023, 32(6): 1016-1025. |
| [2] | 陈治中, 昝梅, 杨雪峰, 董煜. 新疆森林植被碳储量预测研究[J]. 生态环境学报, 2023, 32(2): 226-234. |
| [3] | 吴胜义, 王飞, 徐干君, 马浩, 党禹杰, 吴菲. 川西北高山峡谷区森林碳储量及空间分布研究--以四川洛须自然保护区为例[J]. 生态环境学报, 2022, 31(9): 1735-1744. |
| [4] | 秦艳培, 徐少君, 田耀武. 黄河流域河南段植被和土壤及其碳密度空间分异研究[J]. 生态环境学报, 2022, 31(9): 1745-1753. |
| [5] | 何亚婷, 谢和生, 何友均. 不同经营模式对蒙古栎天然次生林碳储量的影响[J]. 生态环境学报, 2022, 31(2): 215-223. |
| 阅读次数 | ||||||
|
全文 |
|
|||||
|
摘要 |
|
|||||