
生态环境学报 ›› 2026, Vol. 35 ›› Issue (9): 1393-1401.DOI: 10.16258/j.cnki.1674-5906.2026.09.006
马雪莹1,3,4( ), 杜宏茹1,2,*(), 马红莲1, 赵雪纯1,2, 林涛3, 周耘天1,2
收稿日期:2025-12-24
修回日期:2026-07-16
接受日期:2026-08-17
出版日期:2026-09-18
发布日期:2026-09-16
通讯作者:
杜宏茹, E-mail: 作者简介:马雪莹(2001年生),女,硕士研究生,主要从事土地资源管理。E-mail: maxueyingxm@163.com
基金资助:
Ma Xueying1,3,4(), Du Hongru1,2,*(), Ma Honglian1, Zhao Xuechun1,2, Lin Tao3, Zhou Yuntian1,2
Received:2025-12-24
Revised:2026-07-16
Accepted:2026-08-17
Online:2026-09-18
Published:2026-09-16
摘要:
【目的】开展长时序景观生态风险评价及稳定性分析,为干旱区生态风险精准防控与区域生态安全格局的构建提供科学依据。【方法】基于2000-2020年5期土地利用数据计算景观生态风险指数,开展景观生态风险评价;并结合Slope趋势分析与变异系数构建稳定性矩阵,揭示风险演变及稳定性特征。【结果】 1)研究区内景观生态风险以中风险区(约53%)和较低风险区(约25%)为主,高风险区占比最低,仅约2.5%,主要集聚于塔里木、准噶尔盆地边缘绿洲带。2)20年间,新疆生态风险总体呈稳定向好态势,风险稳定区与风险降低区合计占研究区面积的82.59%,其中风险降低区主要分布于中天山地区,风险稳定区广泛分布于新疆大部分区域。3)新疆景观生态风险变化类型以基本稳定区为主,占全疆面积的70.09%;稳中微升区和波动升高区合计占17.57%,主要分布于山地生态敏感区及环盆地绿洲带,表明局部区域仍存在风险升高和波动性较强的特征。【结论】新疆景观生态风险整体以中低风险为主,其空间分异与波动特征受人类活动强度及生态本底敏感性的共同影响;对于不同的风险变化类型,需制定差异化分区管控对策。
中图分类号:
马雪莹, 杜宏茹, 马红莲, 赵雪纯, 林涛, 周耘天. 新疆景观生态风险评价及稳定性分析[J]. 生态环境学报, 2026, 35(9): 1393-1401.
Ma Xueying, Du Hongru, Ma Honglian, Zhao Xuechun, Lin Tao, Zhou Yuntian. Landscape Ecological Risk Assessment and Stability Analysis in Xinjiang[J]. Ecology and Environmental Sciences, 2026, 35(9): 1393-1401.
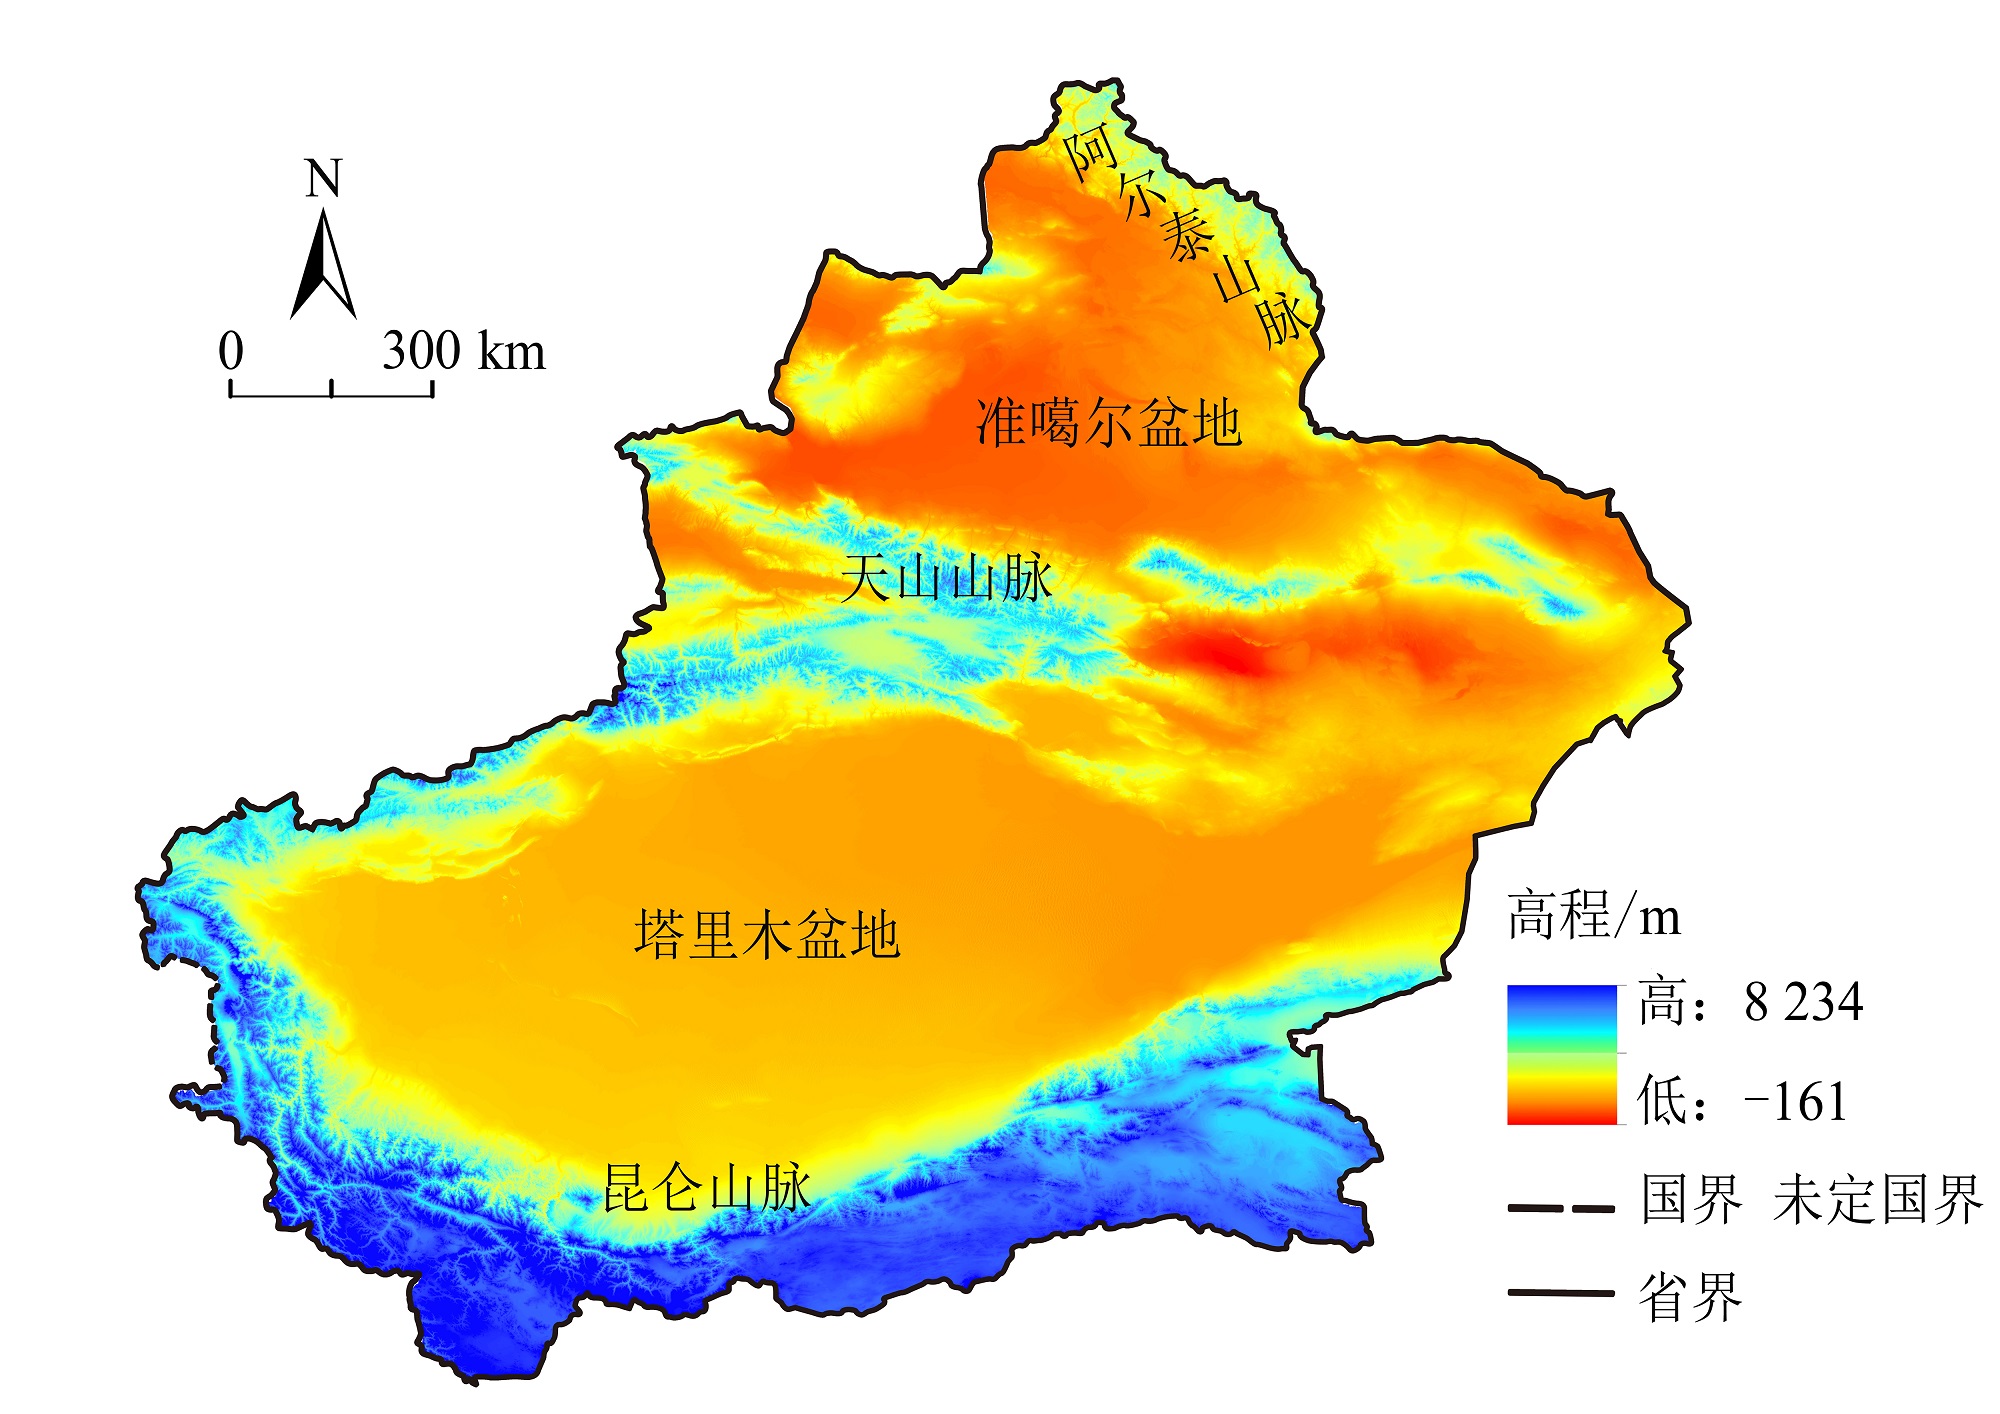
图1 研究区概况 本图基于国家测绘地理信息局标准地图服务网站下载的审图号为新S(2023)061号的标准地图制作,底图无修改
Figure 1 Overview of the study area
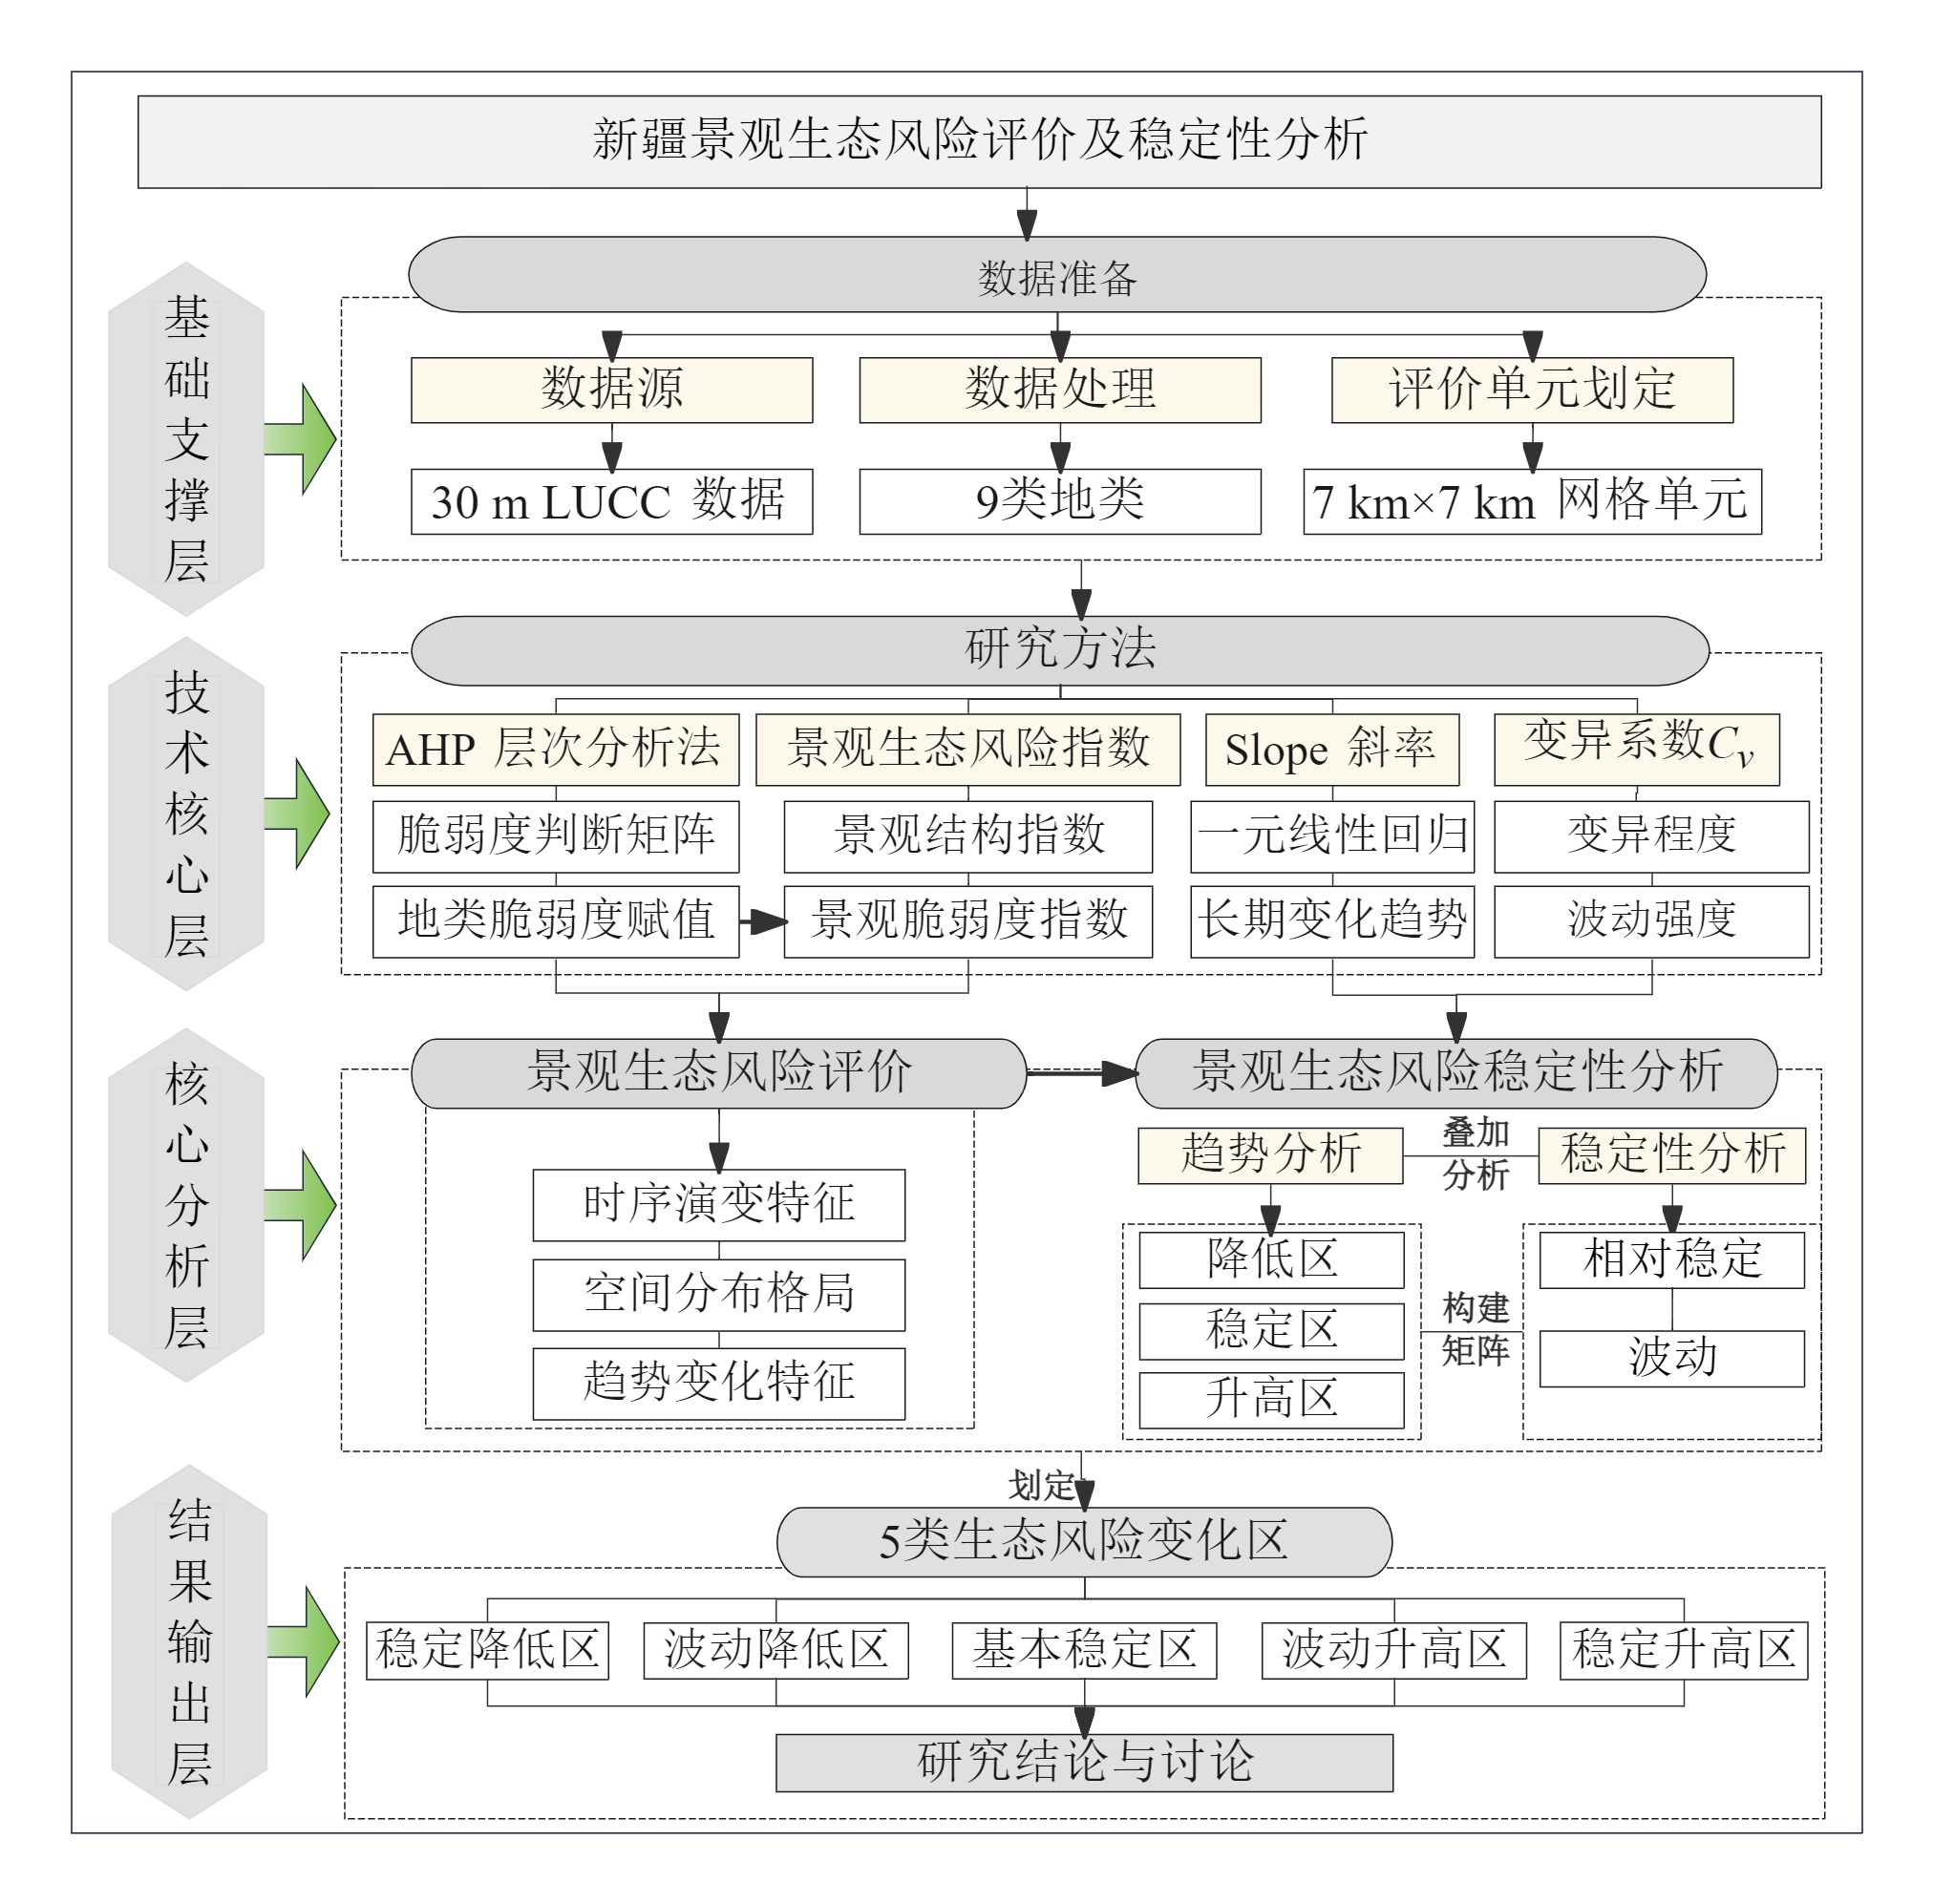
图2 研究框架
Figure 2 Research framework
| 变化幅度/变化特征 | 风险降低 | 风险稳定 | 风险升高 |
|---|---|---|---|
| 相对稳定 | 稳中微降区 | 基本稳定区 | 稳中微升区 |
| 波动变化 | 波动降低区 | 基本稳定区 | 波动升高区 |
表1 稳定性分析矩阵
Table 1 Stability analysis matrix
| 变化幅度/变化特征 | 风险降低 | 风险稳定 | 风险升高 |
|---|---|---|---|
| 相对稳定 | 稳中微降区 | 基本稳定区 | 稳中微升区 |
| 波动变化 | 波动降低区 | 基本稳定区 | 波动升高区 |
| 风险等级/年份 | 2000年 | 2005年 | 2010年 | 2015年 | 2020年 | |
|---|---|---|---|---|---|---|
| 低风险区 | 面积/104km2 | 15.97 | 15.93 | 12.84 | 12.88 | 12.61 |
| 占比/% | 9.74 | 9.72 | 7.84 | 7.86 | 7.70 | |
| 较低风险区 | 面积/104km2 | 38.88 | 38.67 | 39.38 | 39.33 | 39.85 |
| 占比/% | 23.73 | 23.60 | 24.03 | 24.00 | 24.32 | |
| 中风险区 | 面积/104km2 | 84.88 | 84.12 | 88.03 | 87.65 | 87.53 |
| 占比/% | 51.80 | 51.34 | 53.72 | 53.49 | 53.42 | |
| 较高风险区 | 面积/104km2 | 20.06 | 21.06 | 19.20 | 19.71 | 19.88 |
| 占比/% | 12.24 | 12.85 | 11.72 | 12.03 | 12.13 | |
| 高风险区 | 面积/104km2 | 4.07 | 4.08 | 4.41 | 4.29 | 3.98 |
| 占比/% | 2.49 | 2.49 | 2.69 | 2.62 | 2.43 | |
表2 2000-2020年不同等级景观生态风险的面积与占比
Table 2 Area and proportion of landscape ecological risk classes, 2000?2020
| 风险等级/年份 | 2000年 | 2005年 | 2010年 | 2015年 | 2020年 | |
|---|---|---|---|---|---|---|
| 低风险区 | 面积/104km2 | 15.97 | 15.93 | 12.84 | 12.88 | 12.61 |
| 占比/% | 9.74 | 9.72 | 7.84 | 7.86 | 7.70 | |
| 较低风险区 | 面积/104km2 | 38.88 | 38.67 | 39.38 | 39.33 | 39.85 |
| 占比/% | 23.73 | 23.60 | 24.03 | 24.00 | 24.32 | |
| 中风险区 | 面积/104km2 | 84.88 | 84.12 | 88.03 | 87.65 | 87.53 |
| 占比/% | 51.80 | 51.34 | 53.72 | 53.49 | 53.42 | |
| 较高风险区 | 面积/104km2 | 20.06 | 21.06 | 19.20 | 19.71 | 19.88 |
| 占比/% | 12.24 | 12.85 | 11.72 | 12.03 | 12.13 | |
| 高风险区 | 面积/104km2 | 4.07 | 4.08 | 4.41 | 4.29 | 3.98 |
| 占比/% | 2.49 | 2.49 | 2.69 | 2.62 | 2.43 | |
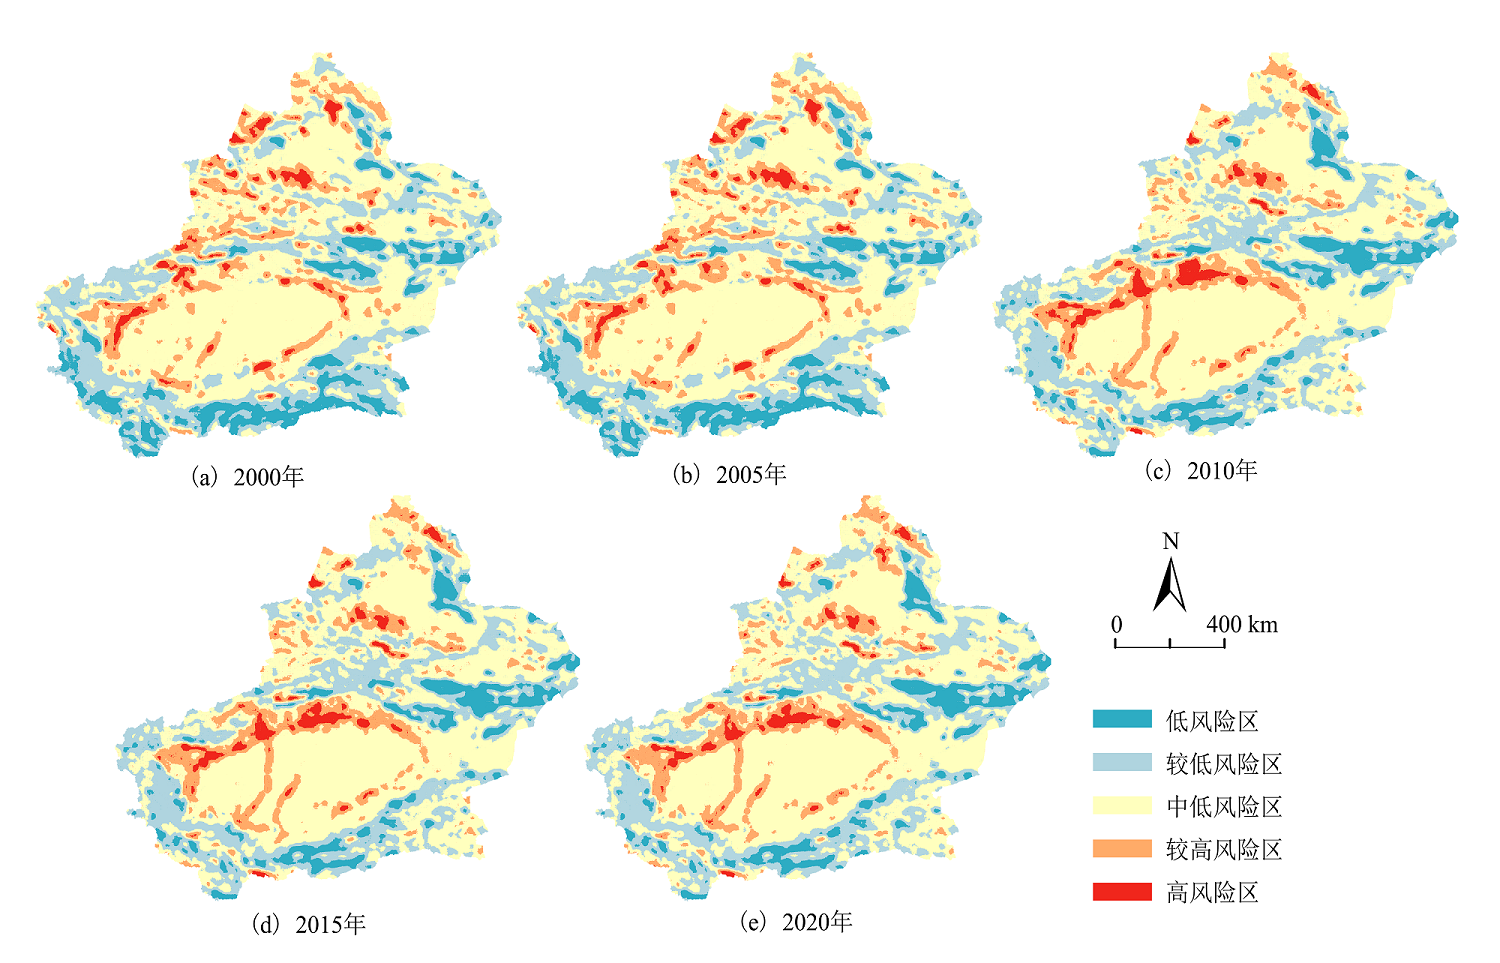
图3 2000-2020新疆景观生态风险格局
Figure 3 2000?2020 distribution of landscape ecological risk in Xinjiang
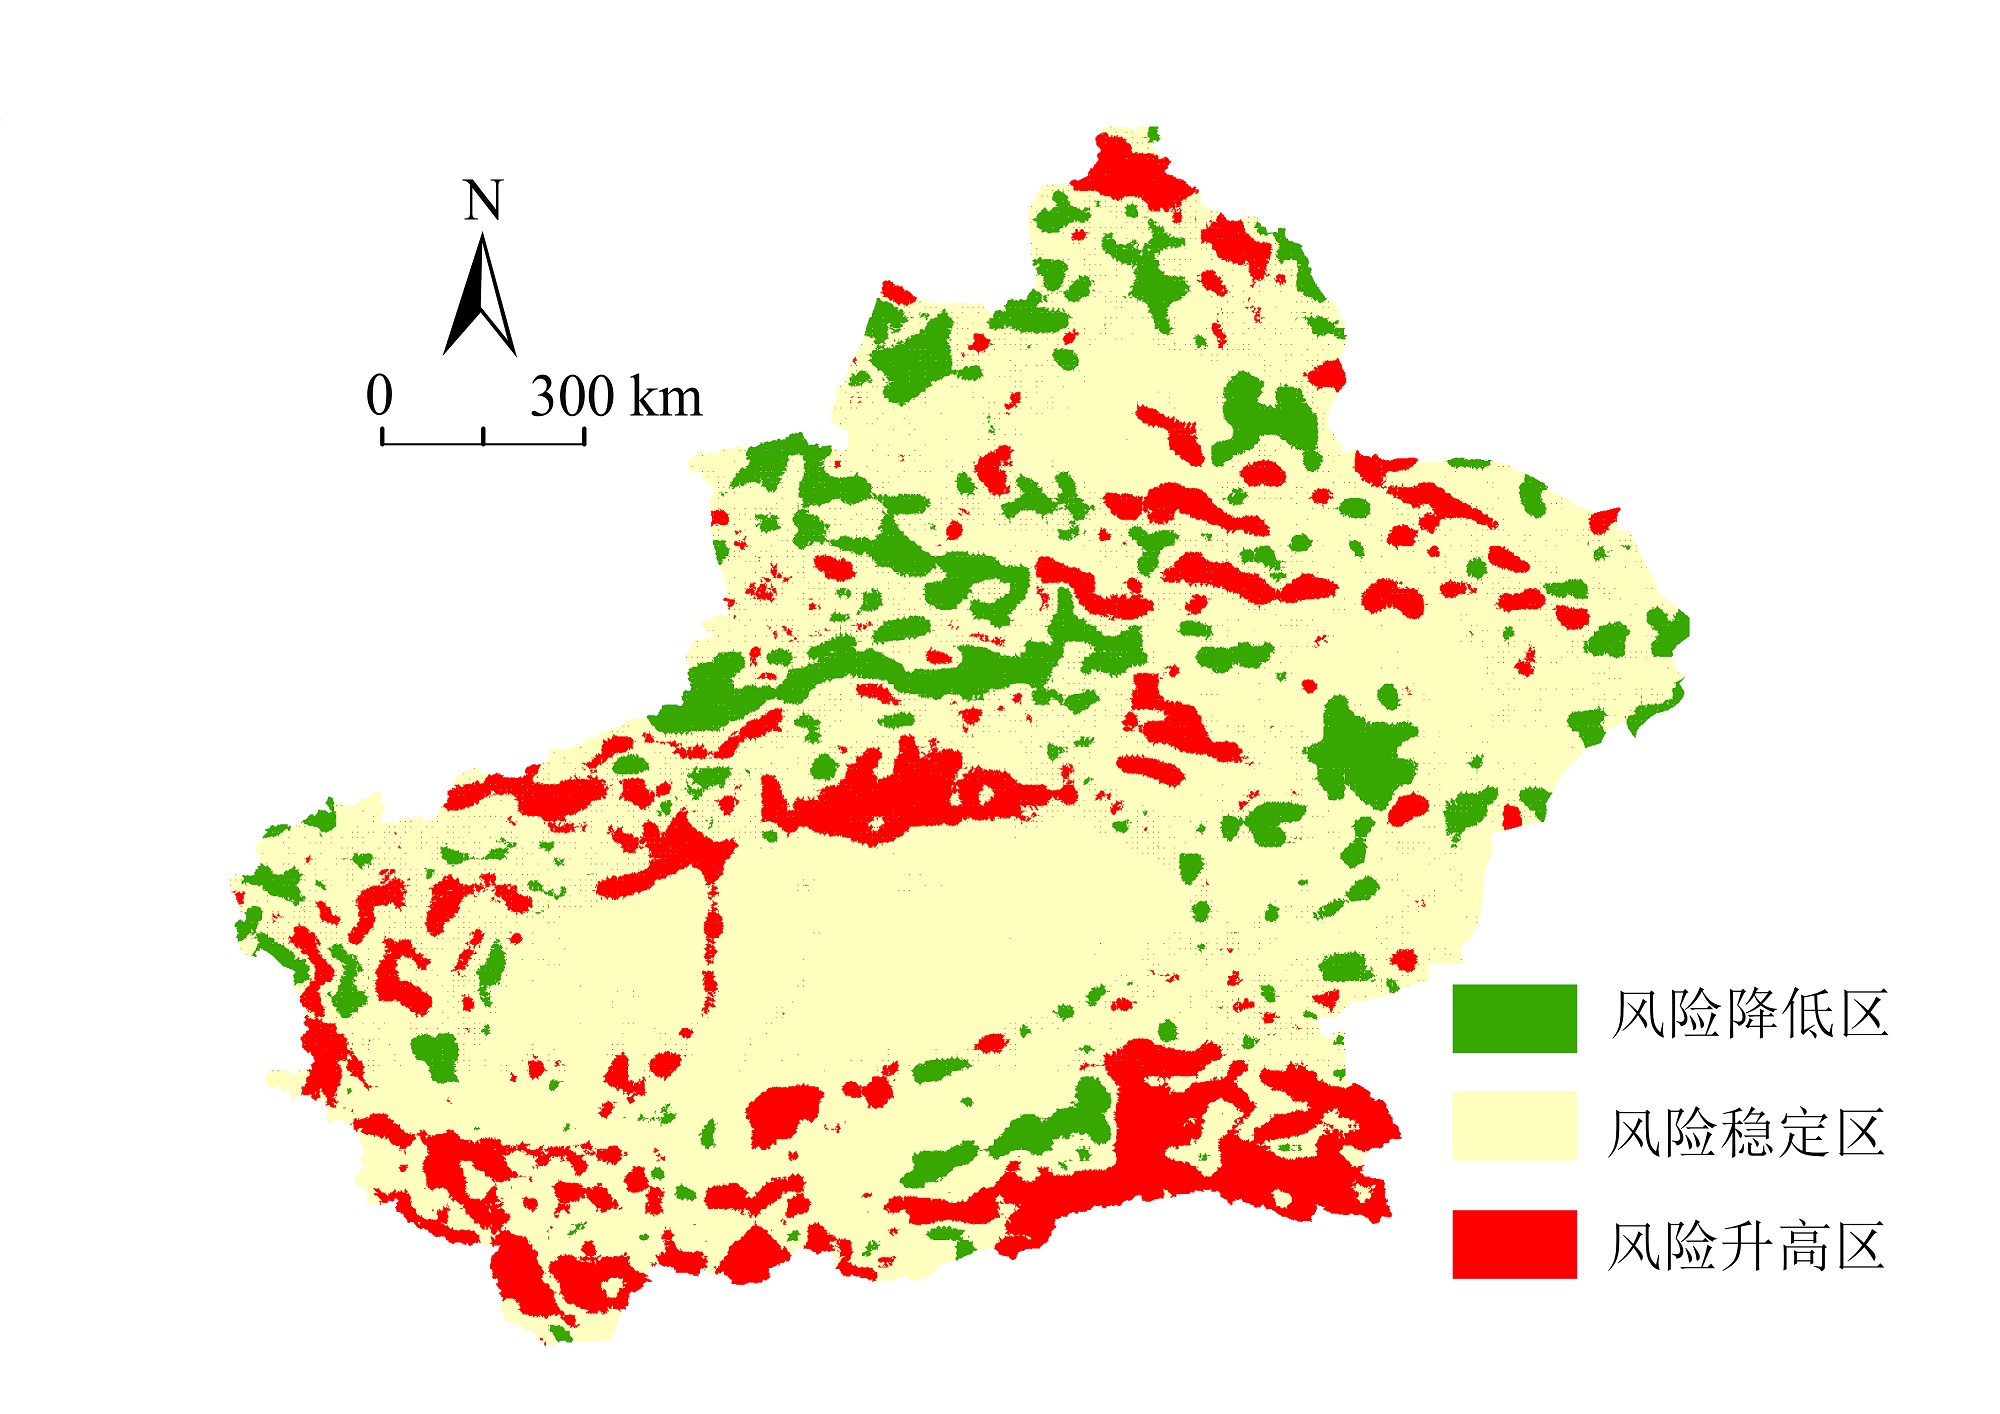
图4 新疆景观生态风险趋势分析
Figure 4 Trend analysis of landscape ecological risk in Xinjiang
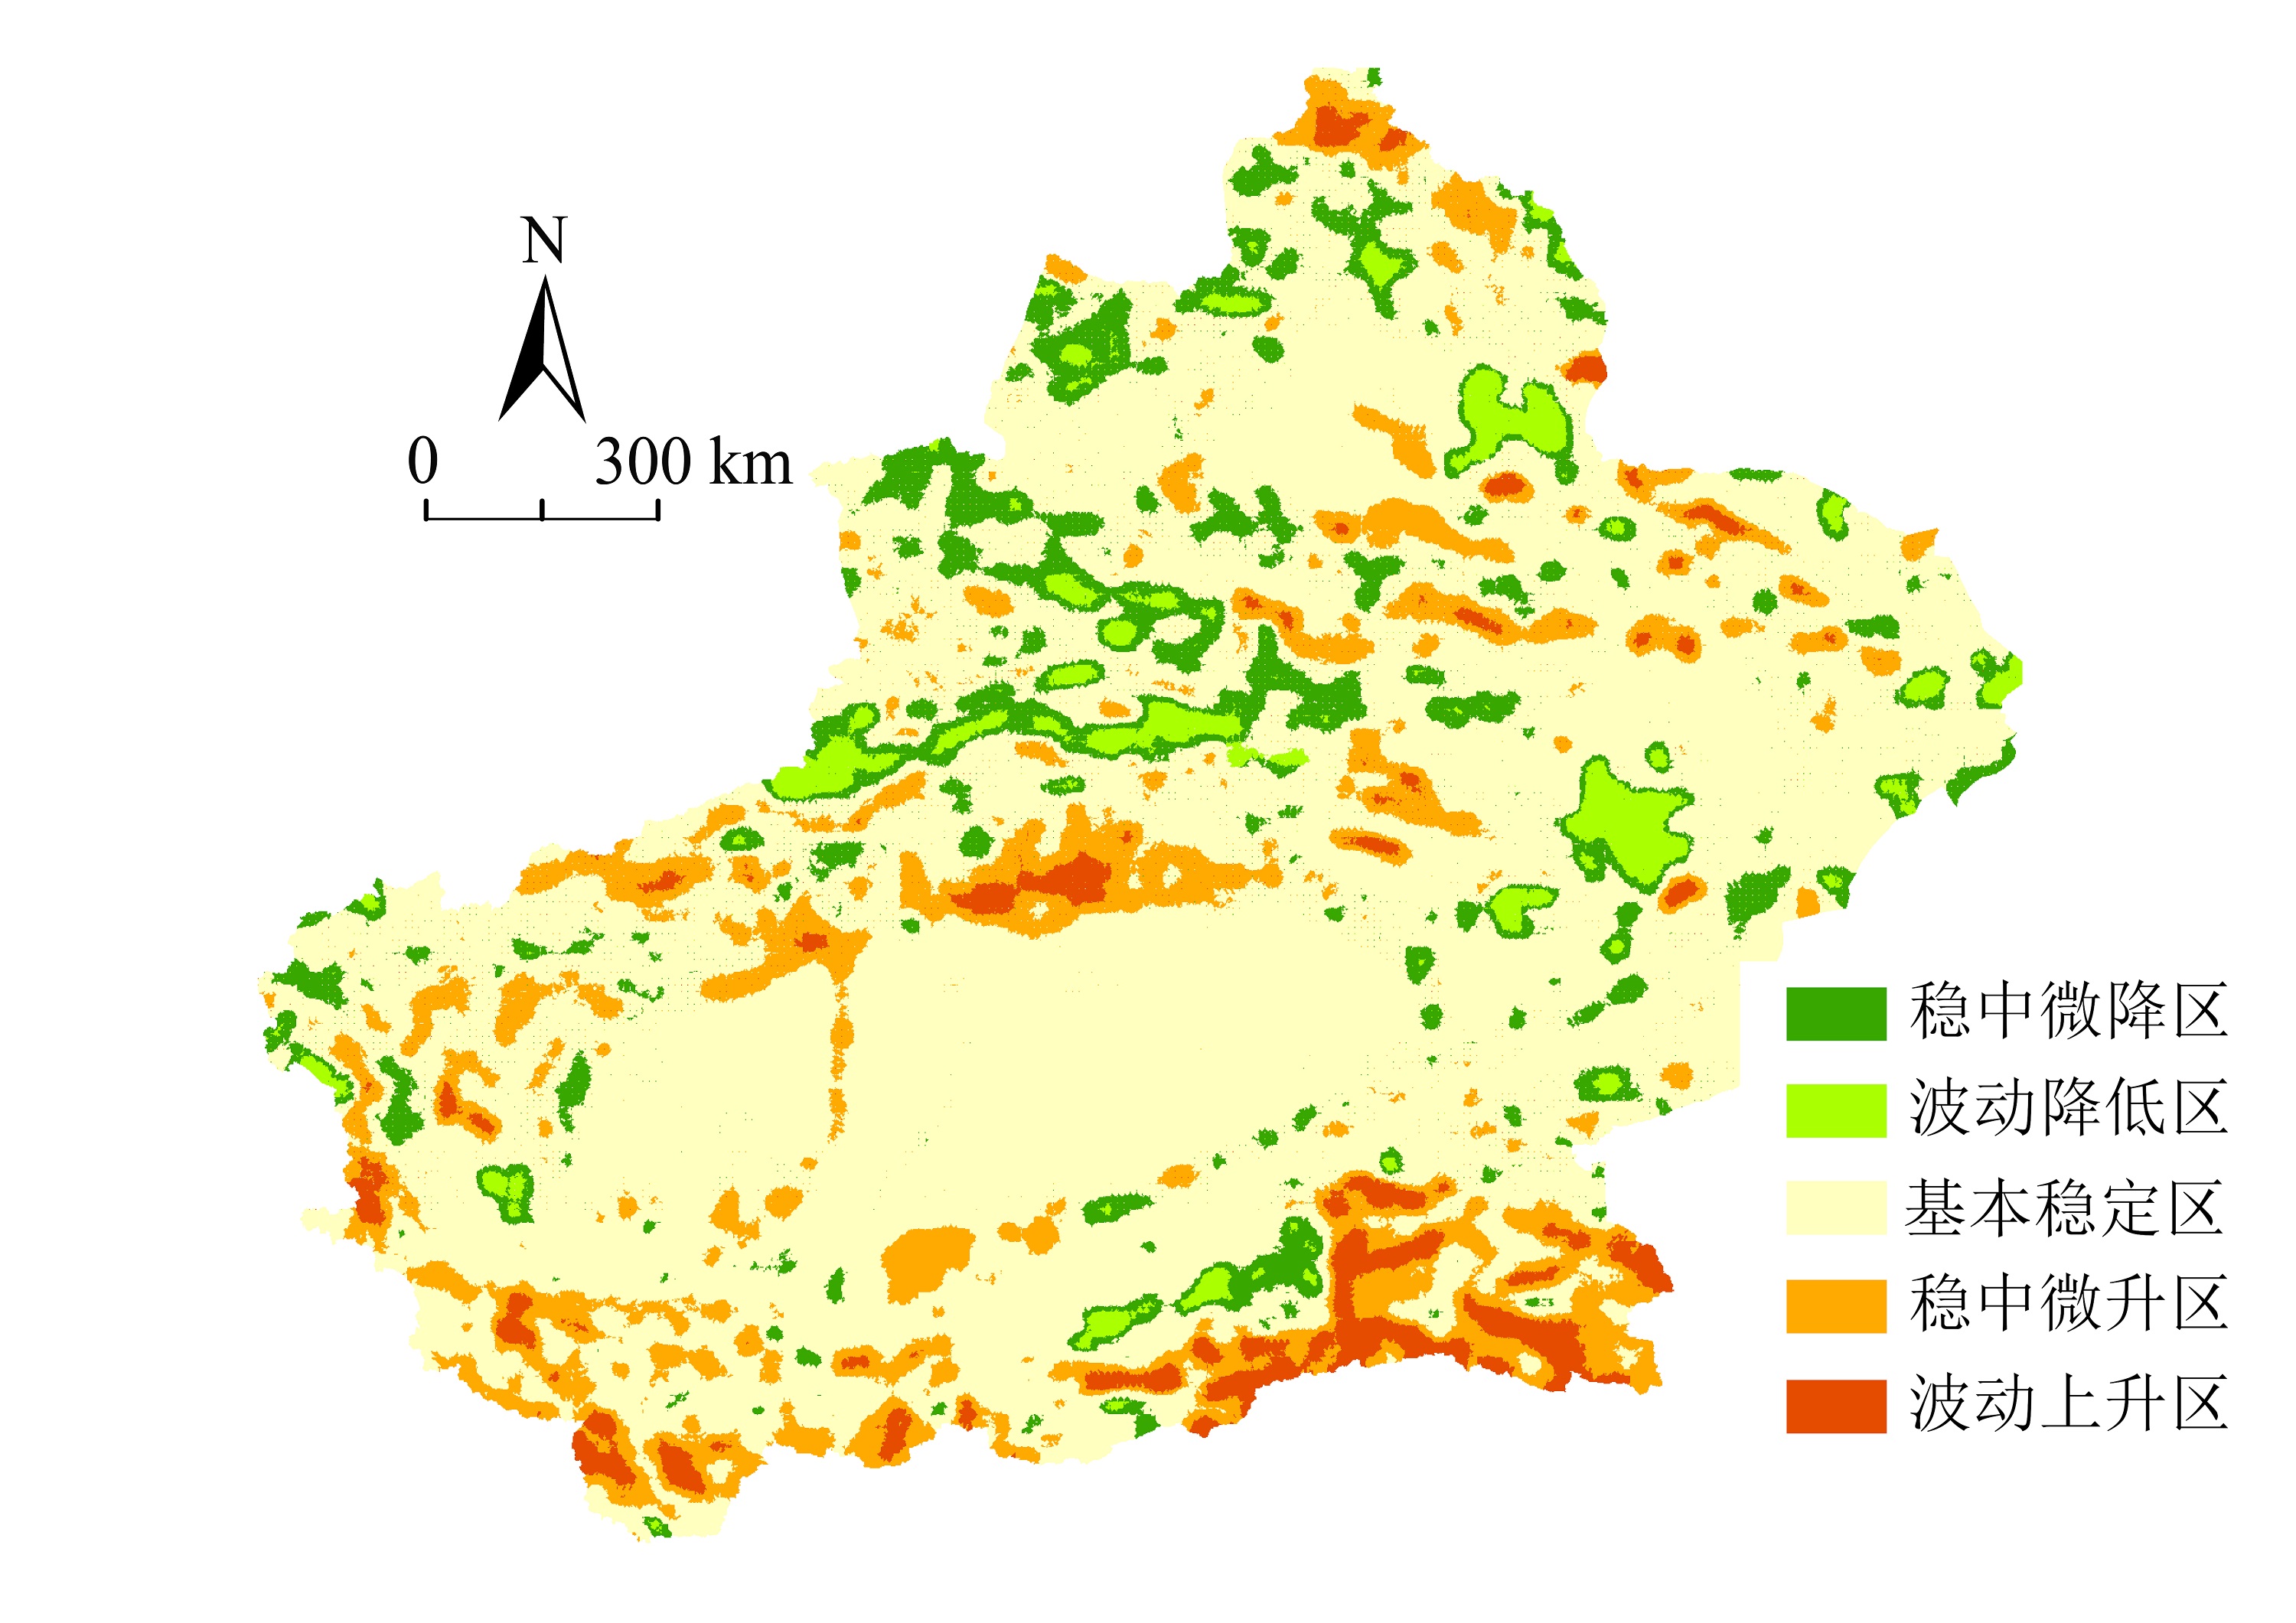
图5 新疆景观生态风险稳定性分析
Figure 5 Stability analysis of landscape ecological risk in Xinjiang
| [1] |
Bivand R, Müller W G, Reder M, 2009. Power calculations for global and local Moran’s I[J]. Computational Statistics & Data Analysis, 53(8): 2859-2872.
DOI URL |
| [2] |
Fan J H, Wang Y, Zhou Z, et al., 2016. Dynamic ecological risk assessment and management of land use in the middle reaches of the Heihe River based on landscape patterns and spatial statistics[J]. Sustainability, 8(6): 536.
DOI URL |
| [3] |
Li C H, Qin F, Liu Z Z, et al., 2024. Multi-Scenario assessment of landscape ecological risk in the transitional zone between the warm temperate zone and the northern subtropical zone[J]. Frontiers in Ecology and Evolution, 12: 1471164.
DOI URL |
| [4] |
Wang S, Xu Q L, Yi J H, 2025. Multi-scale identification of driving forces for landscape ecological risk: A case study of the basin containing three plateau lakes in Yunnan, China[J]. Ecological Indicators, 170: 113037.
DOI URL |
| [5] |
Wang W C, Xue X R, Wang Z, et al., 2026. Multiscale driving mechanisms and spatial non-stationarity of landscape ecological risk based on an OPGD-MGWR framework: Evidence from township-level units in the Nanjing metropolitan area (NMA), China[J]. Ecological Indicators, 186: 114840.
DOI URL |
| [6] |
Zhang J, Hao X, Li X, et al., 2024. Evaluation and regulation strategy for ecological security in the Tarim River Basin based on the ecological footprint[J]. Journal of Cleaner Production, 435: 140488.
DOI URL |
| [7] |
Zhang Z Q, Pan H L, Gan J, et al., 2025. Spatiotemporal evolution and scenario simulation of landscape ecological risk in hilly-gully regions: A case study of Zichang City[J]. Land, 14(12): 2358.
DOI URL |
| [8] | 陈全通, 殷浩然, 李艳红, 等, 2022. 秦巴山地景观生态风险的时空分异[J]. 水土保持通报, 42(3): 239-246. |
| Chen Q T, Yin H R, Li Y H, et al., 2022. Spatial and temporal differentiation of landscape ecological risk in Qinling-Daba mountains[J]. Bulletin of Soil and Water Conservation, 42(3): 239-246. | |
| [9] |
丁建丽, 葛翔宇, 王敬哲, 2021. 中国艾比湖湿地识别及其时空动态变化[J]. 自然资源学报, 36(8): 1949-1963.
DOI |
|
Ding J L, Ge X Y, Wang J Z, 2021. Ebinur Lake wetland identification and its spatio-temporal dynamic changes[J]. Journal of Natural Resources, 36(8): 1949-1963.
DOI URL |
|
| [10] |
高彬嫔, 李琛, 吴映梅, 等, 2021. 川滇生态屏障区景观生态风险评价及影响因素[J]. 应用生态学报, 32(5): 1603-1613.
DOI |
| Gao B P, Li C, Wu Y M, et al., 2021. Landscape ecological risk assessment and influencing factors in ecological conservation area in Sichuan-Yunnan Provinces, China[J]. Chinese Journal of Applied Ecology, 32(5): 1603-1613. | |
| [11] | 国家林业和草原局, 2023. 新疆: 从 “沙进人退” 到 “绿进沙退” [EB/OL]. [2023-07-04] https://www.forestry.gov.cn/c/www/hm/510100.jhtml. |
| National Forestry and Grassland Administration, 2023. Xinjiang: From “sand advancing and people retreating” to “green advancing and sand retreating” [EB/OL]. [2023-07-04]. https://www.forestry.gov.cn/c/www/hm/510100.jhtml. | |
| [12] | 李皓, 翟月鹏, 杨小龙, 等, 2022. 基于层次分析-有序加权平均多准则评估的雄安新区生态安全格局模拟研究[J]. 生态学报, 42(1): 150-160. |
| Li H, Zhai Y P, Yang X L, et al., 2022. Simulating ecological security patterns in the Xiong’an New Area based on the multicriteria evaluation of AHP-OWA[J]. Acta Ecologica Sinica, 42(1): 150-160. | |
| [13] | 李鹏辉, 徐丽萍, 张军民, 等, 2020. 干旱区内陆河流域三维生态足迹时空变化分析--以玛纳斯河流域为例[J]. 生态学报, 40(19): 6776-6787. |
| Li P H, Xu L P, Zhang J M, et al., 2020. Spatio-temporal changes of three-dimensional ecological footprint in inland river basins in Arid Region: A case study of the Manas River Basin[J]. Acta Ecologica Sinica, 40(19): 6776-6787. | |
| [14] |
李思琪, 王海兵, 袁晓飞, 等, 2025. 毛乌素沙地景观生态风险时空演变及驱动力[J]. 中国沙漠, 45(5): 230-240.
DOI |
|
Li S Q, Wang H B, Yuan X F, et al., 2025. Temporal and spatial evolution of landscape ecological risks and driving forces in the Mu Us Sandy Land[J]. Journal of Desert Research, 45(5): 230-240.
DOI |
|
| [15] | 刘敏, 蔡海生, 张学玲, 等, 2025. 基于Geodetector-GTWR的江西省景观生态风险及驱动因素[J]. 环境科学, 46(10): 6455-6464. |
|
Liu M, Cai H S, Zhang X L, et al., 2025. Landscape ecological risk and driving factors in Jiangxi Province based on Geodetector-GTWR[J]. Environmental Science, 46(10): 6455-6464.
DOI URL |
|
| [16] | 刘时栋, 徐丽萍, 张婕, 2019. 新疆土地生态安全时空变化[J]. 生态学报, 39(11): 3871-3884. |
| Liu S D, Xu L P, Zhang J, 2019. Spatiotemporal change of land ecological security in Xinjiang[J]. Acta Ecologica Sinica, 39(11): 3871-3884. | |
| [17] | 马丽莎, 郑江华, 彭建, 等, 2024. 新疆生态脆弱性特征及其驱动力[J]. 生态学报, 44(20): 9053-9066. |
| Ma L S, Zheng J H, Peng J, et al., 2024. Research on the characteristics and driving forces of ecological vulnerability in Xinjiang[J]. Acta Ecologica Sinica, 44(20): 9053-9066. | |
| [18] |
彭建, 党威雄, 刘焱序, 等, 2015. 景观生态风险评价研究进展与展望[J]. 地理学报, 70(4): 664-677.
DOI |
|
Peng J, Dang W X, Liu Y X, et al., 2015. Review on landscape ecological risk assessment[J]. Acta Geographica Sinica, 70(4): 664-677.
DOI |
|
| [19] | 乔斌, 曹晓云, 孙玮婕, 等, 2023. 基于生态系统服务价值和景观生态风险的生态分区识别与优化策略--以祁连山国家公园青海片区为例[J]. 生态学报, 43(3): 986-1004. |
| Qiao B, Cao X Y, Sun W J, et al., 2023. Ecological zoning identification and optimization strategies based on ecosystem service value and landscape ecological risk: Taking Qinghai area of Qilian Mountain National Park as an example[J]. Acta Ecologica Sinica, 43(3): 986-1004. | |
| [20] |
孙丽蓉, 周冬梅, 岑国璋, 等, 2021. 基于地理探测器模型的疏勒河流域景观生态风险评价及驱动因素分析[J]. 干旱区地理, 44(5): 1384-1395.
DOI |
|
Sun L R, Zhou D M, Cen G Z, et al., 2021. Landscape ecological risk assessment and driving factors of the Shule River Basin based on the geographic detector model[J]. Arid Land Geography, 44(5): 1384-1395.
DOI |
|
| [21] | 田颖, 李冰, 王水, 2015. 江苏沿海地区景观格局的生态风险研究[J]. 水土保持研究, 22(1): 241-245, 251. |
| Tian Y, Li B, Wang S, 2015. Study on landscape ecological risk of the coastal areas of Jiangsu Province[J]. Research of Soil and Water Conservation. 22(1): 241-245, 251. | |
| [22] |
王成武, 尧良杰, 汪宙峰, 等, 2024. 2000-2020年三江源地区景观生态风险评价及驱动因素[J]. 干旱区研究, 41(11): 1908-1920.
DOI |
|
Wang C W, Yao L J, Wang Z F, et al., 2024. Landscape ecological risk assessment and driving factors analysis in the Three River Source Region from 2000 to 2020[J]. Arid Zone Research, 41(11): 1908-1920.
DOI |
|
| [23] | 汪勇政, 梁哲, 余浩然, 等, 2024. 基于PLUS模型的汾河流域景观生态风险时空分异及多情景模拟[J]. 生态科学, 43(1): 35-45. |
| Wang Y Z, Liang Z, Yu H R, et al., 2024. Spatial-temporal differentiation and multi-scenario simulation of landscape ecological risk assessment in Fenhe River Basin based on PLUS model[J]. Ecological Science, 43(1): 35-45. | |
| [24] |
谢小平, 陈芝聪, 王芳, 等, 2017. 基于景观格局的太湖流域生态风险评估[J]. 应用生态学报, 28(10): 3369-77.
DOI |
| Xie X P, Chen Z C, Wang F, et al., 2017. Ecological risk assessment of Taihu Lake Basin based on landscape pattern[J]. Chinese Journal of Applied Ecology, 28(10): 3369-77. | |
| [25] | 杨柳, 李志英, 王绍邦, 等, 2025. 基于土地利用转型的昆明市景观生态风险时空演变[J]. 西北林学院学报, 40(6): 213-220, 240. |
| Yang L, Li Z Y, Wang S B, et al., 2025. Spatial and temporal evolution of landscape ecological risk in Kunming based on land use transition[J]. Journal of Northwest Forestry University, 40(6): 213-220, 240. | |
| [26] |
张子涵, 王瑾杰, 丁建丽, 等, 2025. 基于PLUS模型的艾比湖流域景观生态风险分析及预测[J]. 干旱区地理, 48(2): 308-322.
DOI |
|
Zhang Z H, Wang J J, Ding J L, et al., 2025. Analysis and prediction of landscape ecological risk in Ebinur Lake Basin based on PLUS model[J]. Arid Land Geography, 48(2): 308-322.
DOI |
|
| [27] | 张芷祺, 程琳琳, 李明睿, 等, 2026. 基于景观生态风险评价的生态安全格局构建: 以北京生态涵养区为例[J]. 环境科学, 47(5): 3285-3296. |
| Zhang Z Q, Cheng L L, Li M R, et al., 2026. Ecological security pattern construction based on landscape ecological risk assessment: A case study of Beijing ecological conservation area[J]. Environmental Science, 47(5): 3285-3296. | |
| [28] |
周玉祥, 赵玉, 聂仁东, 等, 2023. 下辽河平原土地沙漠化程度及预测研究[J]. 生态环境学报, 32(6): 1133-1139.
DOI |
| Zhou Y X, Zhao Y, Nie R D, et al., 2023. Characterization and prediction of land desertification in the lower Liaohe River Plain[J]. Ecology and Environmental Sciences, 32(6): 1133-1139. |
| [1] | 张涛, 杨慧, 曹建华, 周孟霞, 康志强. 基于岩性分区的广西植被净生态系统生产力时空演变特征研究[J]. 生态环境学报, 2026, 35(5): 702-713. |
| [2] | 石镕瑞, 杨小雄, 马骥, 黄珊珊, 杨玥, 卢盛权, 吴广. 滇桂黔石漠化片区生态环境质量时空演变及驱动力分析[J]. 生态环境学报, 2025, 34(7): 1147-1162. |
| [3] | 王宗阳, 曾雪兰, 祝振昌, 郭芬, 罗丽娟, 张武英, 杜青平, 张远. 湛江市红树林植被及土壤碳密度空间分布及其驱动机制分析[J]. 生态环境学报, 2025, 34(11): 1705-1714. |
| [4] | 宋小龙, 马明德, 王鹏, 李陇堂, 米文宝, 宋永永. 2000—2022年宁夏不同地理分区生长季植被覆盖度时空非平稳性特征[J]. 生态环境学报, 2024, 33(6): 853-868. |
| [5] | 张杨, 徐永明, 卢响军, 莫亚萍, 吉蒙, 祝善友. 基于OCO-2遥感数据的新疆维吾尔自治区大气XCO2空间化研究[J]. 生态环境学报, 2024, 33(2): 231-241. |
| [6] | 冯自贤, 佘璐, 王秀慧, 杨璐, 杨晨. 基于改进遥感生态指数的宁夏生态环境质量时空变化[J]. 生态环境学报, 2024, 33(1): 131-143. |
| [7] | 陈治中, 昝梅, 杨雪峰, 董煜. 新疆森林植被碳储量预测研究[J]. 生态环境学报, 2023, 32(2): 226-234. |
| [8] | 阮惠华, 许剑辉, 张菲菲. 2001—2020年粤港澳大湾区植被和地表温度时空变化研究[J]. 生态环境学报, 2022, 31(8): 1510-1520. |
| [9] | 李梦华, 韩颖娟, 赵慧, 王云霞. 基于地理探测器的宁夏植被覆盖度时空变化特征及其驱动因子分析[J]. 生态环境学报, 2022, 31(7): 1317-1325. |
| [10] | 李美娇, 何凡能, 赵彩杉, 杨帆. 全球历史LUCC数据集新疆地区耕地数据可靠性评估[J]. 生态环境学报, 2022, 31(6): 1215-1224. |
| [11] | 杨媛媛, 佘志鹏, 宋进喜, 朱大为. 2000年以来浐灞河流域不同地貌区植被变化特征及影响因素研究[J]. 生态环境学报, 2022, 31(2): 224-230. |
| [12] | 朱生堡, 唐光木, 张云舒, 徐万里, 葛春辉, 马海刚. 水旱长期耕作下土壤团聚体及有机碳动态变化[J]. 生态环境学报, 2022, 31(11): 2152-2160. |
| [13] | 李海萍, 李光一, 万华伟, 李利平. 基于矩阵分析法的鸟类与哺乳动物物种丰富度空间差异研究——以新疆为例[J]. 生态环境学报, 2021, 30(7): 1333-1341. |
| [14] | 董鑫, 郎嘉钰, 楚原梦冉, 赵姗姗, 张晋东, 白文科. 川金丝猴家域的季节性差异[J]. 生态环境学报, 2021, 30(7): 1342-1352. |
| [15] | 张静, 杜加强, 盛芝露, 张杨成思, 吴金华, 刘博. 1982—2015年黄河流域植被NDVI时空变化及影响因素分析[J]. 生态环境学报, 2021, 30(5): 929-937. |
| 阅读次数 | ||||||
|
全文 |
|
|||||
|
摘要 |
|
|||||
