生态环境学报 ›› 2024, Vol. 33 ›› Issue (2): 231-241.DOI: 10.16258/j.cnki.1674-5906.2024.02.007
张杨1( ), 徐永明1,*(), 卢响军2, 莫亚萍1, 吉蒙1, 祝善友1
收稿日期:2023-09-07
出版日期:2024-02-18
发布日期:2024-04-03
通讯作者:
*徐永明。E-mail: xym30@263.net作者简介:张杨(1999年生),女,硕士研究生,研究方向为大气环境遥感。E-mail: 20211211035@nuist.edu.cn
基金资助:
ZHANG Yang1(), XU Yongming1,*(), LU Xiangjun2, MO Yaping1, JI Meng1, ZHU Shanyou1
Received:2023-09-07
Online:2024-02-18
Published:2024-04-03
摘要:
二氧化碳(CO2)是导致全球变暖最主要的温室气体,掌握准确的CO2空间分布信息可以有效评估碳减排成效,对于推进碳达峰、碳中和工作具有重要意义。相比站点观测,碳卫星能够获取大尺度的CO2分布信息,但是由于其幅宽较窄以及云覆盖的影响,大气CO2卫星遥感数据存在大量缺值区域,不能获得空间连续的大气CO2分布。以新疆维吾尔自治区为研究区,基于2019年OCO-2卫星大气二氧化碳柱平均干空气混合比(XCO2)数据,结合气温、地形、植被、大气NO2浓度等相关变量,综合对比了多元线性回归(MLR)、地理加权回归(GWR)、支持向量机(SVR)、随机森林(RF)、极端梯度提升树(XGBoost)和极端随机树(ERT)等方法在生成大气XCO2空间连续数据中的表现。交叉验证结果表明,RF、XGBoost和ERT这3种集成学习模型精度明显优于SVR、GWR和MLR模型,其中ERT模型精度最高,决定系数R2为0.748,平均绝对误差σMAE为0.489×10⁻⁶。基于ERT模型生成了新疆2019年逐月大气XCO2空间连续数据,该地区大气XCO2空间差异和季节变化都很明显。在空间分布格局上总体呈现与地形“三山夹两盆”相似的空间分布特征,裸地XCO2年均值最高,林地和草原的XCO2年均值最低;季节变化特征与植被生长周期相似,春冬季浓度较高,夏秋季浓度较低,最高值出现在4月,最低值出现在8月,不同土地覆盖类型的大气XCO2季节变化与全区域类似,其中草原和林地的季节差异最大,裸地季节差异最小。该研究为基于碳卫星遥感数据生成时空连续的大尺度XCO2数据提供了参考和借鉴。
中图分类号:
张杨, 徐永明, 卢响军, 莫亚萍, 吉蒙, 祝善友. 基于OCO-2遥感数据的新疆维吾尔自治区大气XCO2空间化研究[J]. 生态环境学报, 2024, 33(2): 231-241.
ZHANG Yang, XU Yongming, LU Xiangjun, MO Yaping, JI Meng, ZHU Shanyou. Spatialization of Atmospheric XCO2 in Xinjiang Uygur Autonomous Region based on OCO-2 Remote Sensing Data[J]. Ecology and Environment, 2024, 33(2): 231-241.

图1 研究区概况 文本所有地图基于自然资源部标准地图服务网站GS (2019) 1822号标准地图制作,底图边界无修改
Figure 1 Overview of the studied area
| 数据名称 | 数据来源 | 时间分辨率 | 空间分辨率 | 数据时间 |
|---|---|---|---|---|
| XCO2 | OCO-2 | 16 d | 1.29 km× 2.25 km | 2019 |
| NDVI | MODIS/MOD13A3 | 月 | 1 km×1 km | 2019 |
| 气象再分析数据 | ERA5-Land | 月 | 0.1°×0.1° | 2019 |
| 大气NO2 | Sentinel-5P | d | 1.1132 km× 1.1132 km | 2019 |
| 夜间灯光数据 | NPP/VIIRS | 月 | 500 m× 500 m | 2019 |
| DEM | SRTM/SRTMGL1_v003 | ‒ | 30 m×30 m | 2000 |
| 土地覆盖 | MODIS/MCD12Q1 | ‒ | 500 m×500 m | 2019 |
表1 数据信息
Table 1 Data information table
| 数据名称 | 数据来源 | 时间分辨率 | 空间分辨率 | 数据时间 |
|---|---|---|---|---|
| XCO2 | OCO-2 | 16 d | 1.29 km× 2.25 km | 2019 |
| NDVI | MODIS/MOD13A3 | 月 | 1 km×1 km | 2019 |
| 气象再分析数据 | ERA5-Land | 月 | 0.1°×0.1° | 2019 |
| 大气NO2 | Sentinel-5P | d | 1.1132 km× 1.1132 km | 2019 |
| 夜间灯光数据 | NPP/VIIRS | 月 | 500 m× 500 m | 2019 |
| DEM | SRTM/SRTMGL1_v003 | ‒ | 30 m×30 m | 2000 |
| 土地覆盖 | MODIS/MCD12Q1 | ‒ | 500 m×500 m | 2019 |

图2 新疆维吾尔自治区2019年每月OCO-2观测数据空间覆盖
Figure 2 Spatial coverage of monthly OCO-2 observations in Xinjiang Uygur Autonomous Region in 2019
| 月份 | VIF | |||||||
|---|---|---|---|---|---|---|---|---|
| NDVI | 气温 | 风速 | 风向 | 高程 | 大气NO2 | 夜间灯光 | ||
| 1 | 1.18 | 4.94 | 1.82 | 1.05 | 5.13 | 1.15 | 1.03 | |
| 2 | 1.94 | 3.80 | 1.62 | 1.08 | 3.27 | 1.83 | 1.05 | |
| 3 | 1.33 | 3.30 | 1.35 | 1.43 | 3.09 | 1.57 | 1.02 | |
| 4 | 1.60 | 3.09 | 1.56 | 1.51 | 3.94 | 2.04 | 1.00 | |
| 5 | 1.74 | 4.20 | 1.39 | 1.29 | 4.39 | 2.13 | 1.02 | |
| 6 | 2.52 | 6.97 | 1.48 | 1.28 | 7.76 | 3.04 | 1.05 | |
| 7 | 1.71 | 5.49 | 1.12 | 1.02 | 8.39 | 3.23 | 1.02 | |
| 8 | 1.79 | 8.07 | 1.48 | 1.22 | 9.07 | 1.78 | 1.02 | |
| 9 | 1.49 | 6.22 | 1.11 | 1.30 | 5.75 | 1.49 | 1.00 | |
| 10 | 1.17 | 3.75 | 1.15 | 1.26 | 4.01 | 1.54 | 1.01 | |
| 11 | 1.10 | 2.09 | 1.86 | 1.17 | 3.24 | 1.28 | 1.03 | |
| 12 | 1.47 | 5.36 | 1.43 | 1.03 | 4.81 | 1.26 | 1.07 | |
表2 多重共线性回归分析结果
Table 2 Results of multiple covariance regression analysis
| 月份 | VIF | |||||||
|---|---|---|---|---|---|---|---|---|
| NDVI | 气温 | 风速 | 风向 | 高程 | 大气NO2 | 夜间灯光 | ||
| 1 | 1.18 | 4.94 | 1.82 | 1.05 | 5.13 | 1.15 | 1.03 | |
| 2 | 1.94 | 3.80 | 1.62 | 1.08 | 3.27 | 1.83 | 1.05 | |
| 3 | 1.33 | 3.30 | 1.35 | 1.43 | 3.09 | 1.57 | 1.02 | |
| 4 | 1.60 | 3.09 | 1.56 | 1.51 | 3.94 | 2.04 | 1.00 | |
| 5 | 1.74 | 4.20 | 1.39 | 1.29 | 4.39 | 2.13 | 1.02 | |
| 6 | 2.52 | 6.97 | 1.48 | 1.28 | 7.76 | 3.04 | 1.05 | |
| 7 | 1.71 | 5.49 | 1.12 | 1.02 | 8.39 | 3.23 | 1.02 | |
| 8 | 1.79 | 8.07 | 1.48 | 1.22 | 9.07 | 1.78 | 1.02 | |
| 9 | 1.49 | 6.22 | 1.11 | 1.30 | 5.75 | 1.49 | 1.00 | |
| 10 | 1.17 | 3.75 | 1.15 | 1.26 | 4.01 | 1.54 | 1.01 | |
| 11 | 1.10 | 2.09 | 1.86 | 1.17 | 3.24 | 1.28 | 1.03 | |
| 12 | 1.47 | 5.36 | 1.43 | 1.03 | 4.81 | 1.26 | 1.07 | |
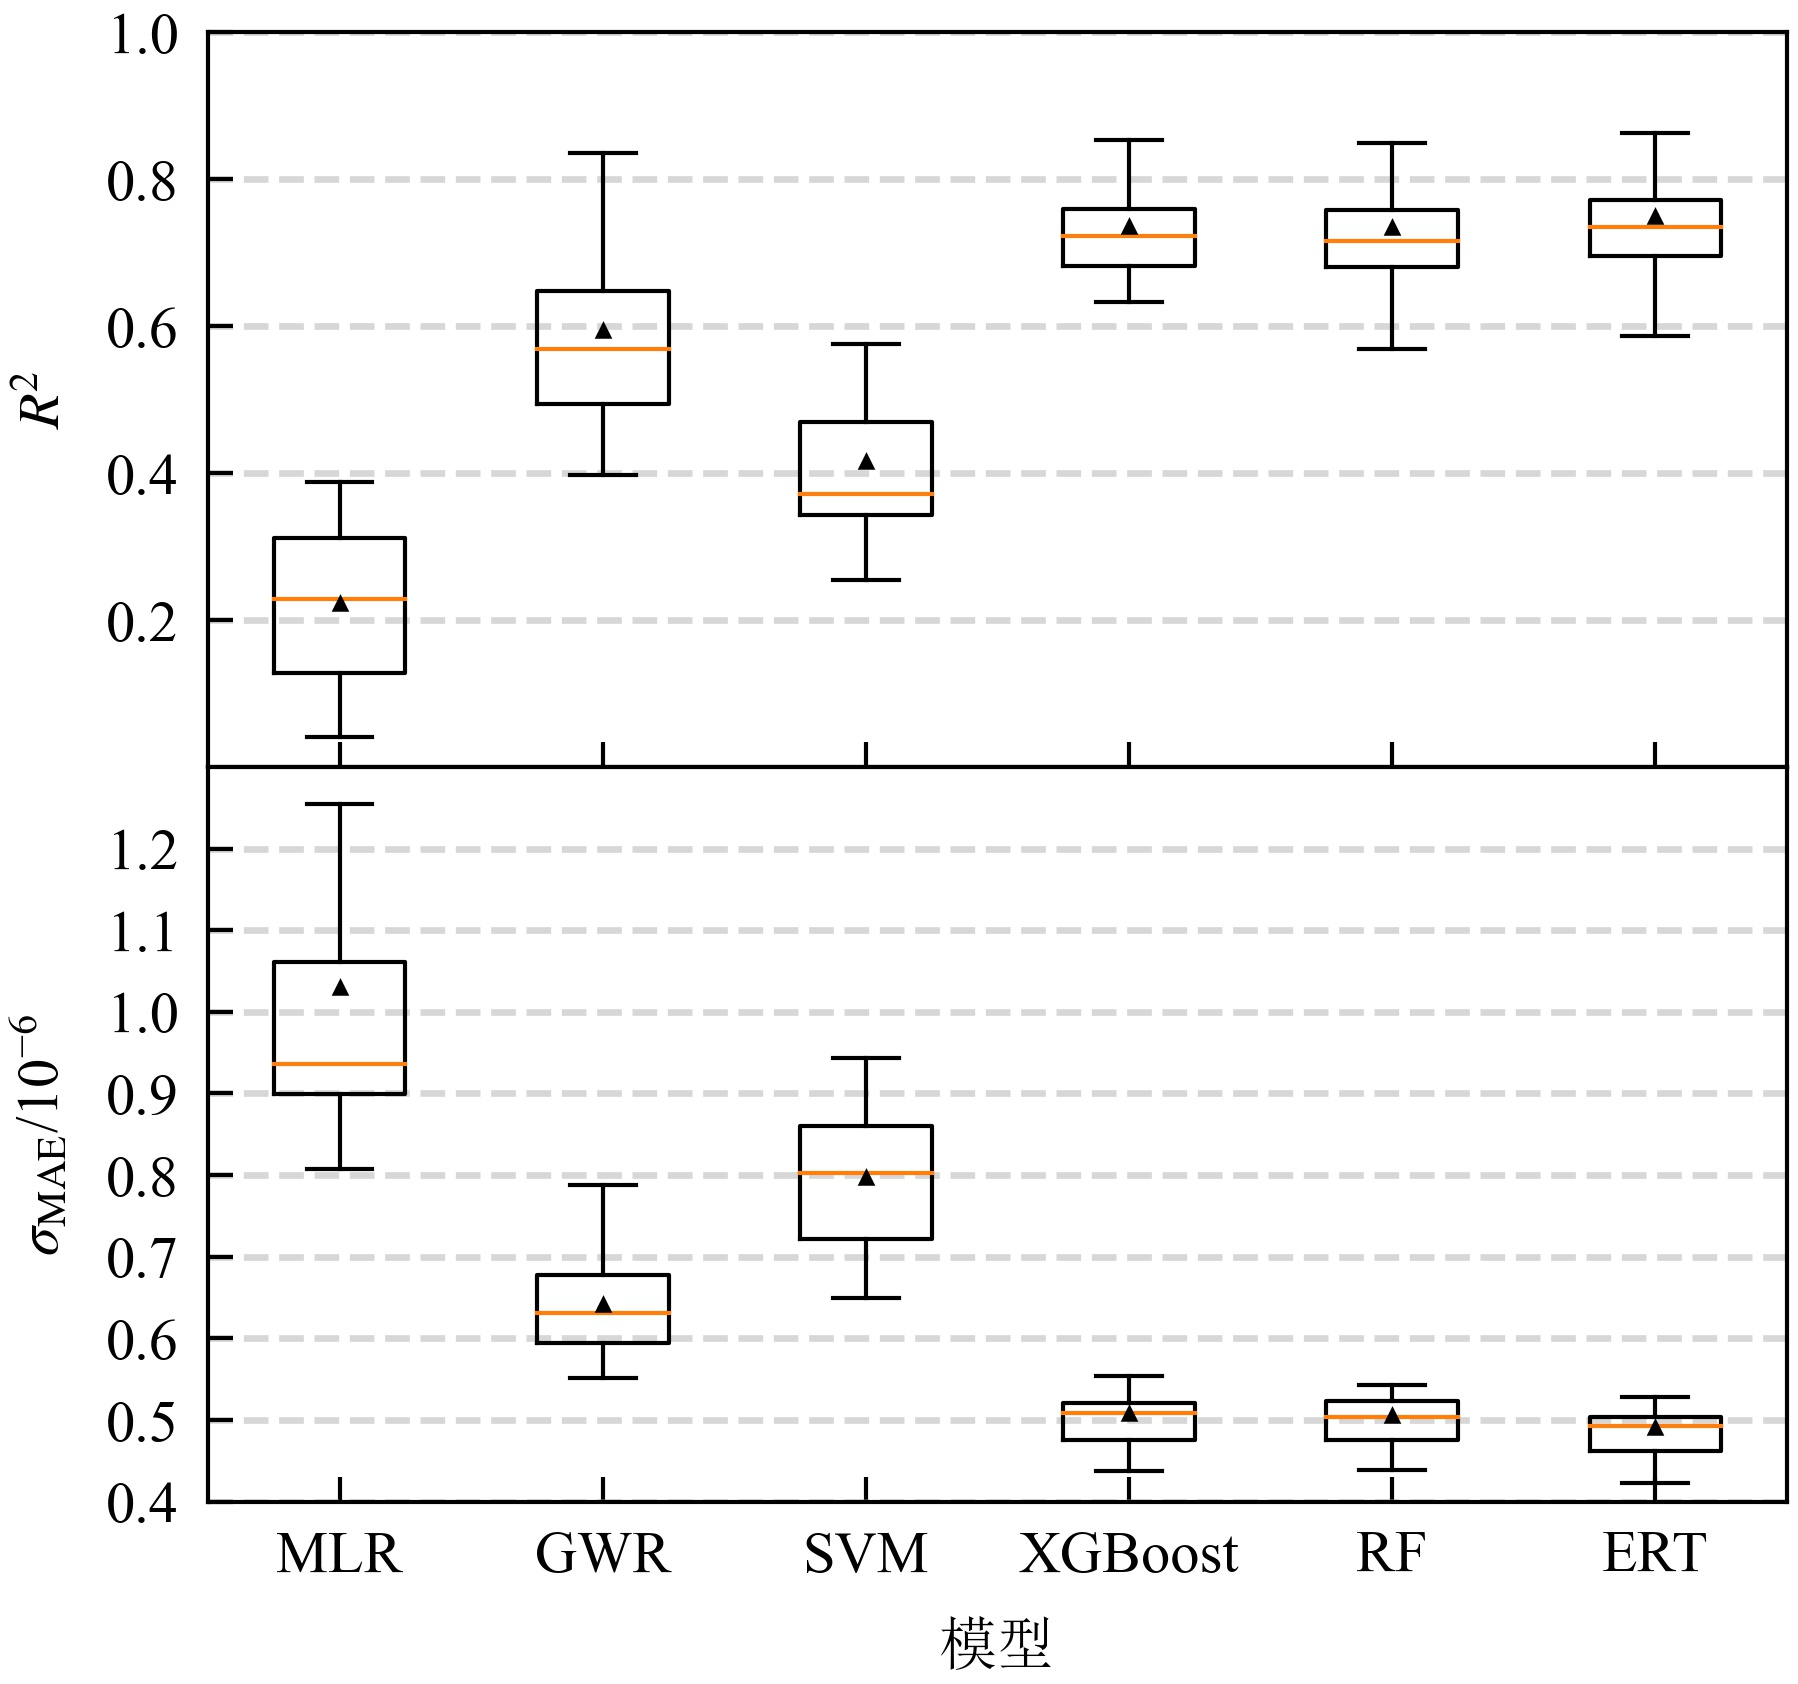
图3 6种模型的交叉验证精度箱型图
Figure 3 Box plot of cross-validation accuracy for 7 models

图4 模型估算值与遥感观测值散点图
Figure 4 Scatter plot of model estimates and remote sensing observations
| 范围 (×10−6) | 数量 | σMBE (×10−6) | σMAE (×10−6) |
|---|---|---|---|
| 395-405 | 22691 | 0.359 | 0.544 |
| 405-415 | 313536 | −0.024 | 0.468 |
| 415-425 | 748 | −1.80 | 1.90 |
表3 数据集不同区间的误差统计结果
Table 3 Error statistics for different intervals of the dataset
| 范围 (×10−6) | 数量 | σMBE (×10−6) | σMAE (×10−6) |
|---|---|---|---|
| 395-405 | 22691 | 0.359 | 0.544 |
| 405-415 | 313536 | −0.024 | 0.468 |
| 415-425 | 748 | −1.80 | 1.90 |
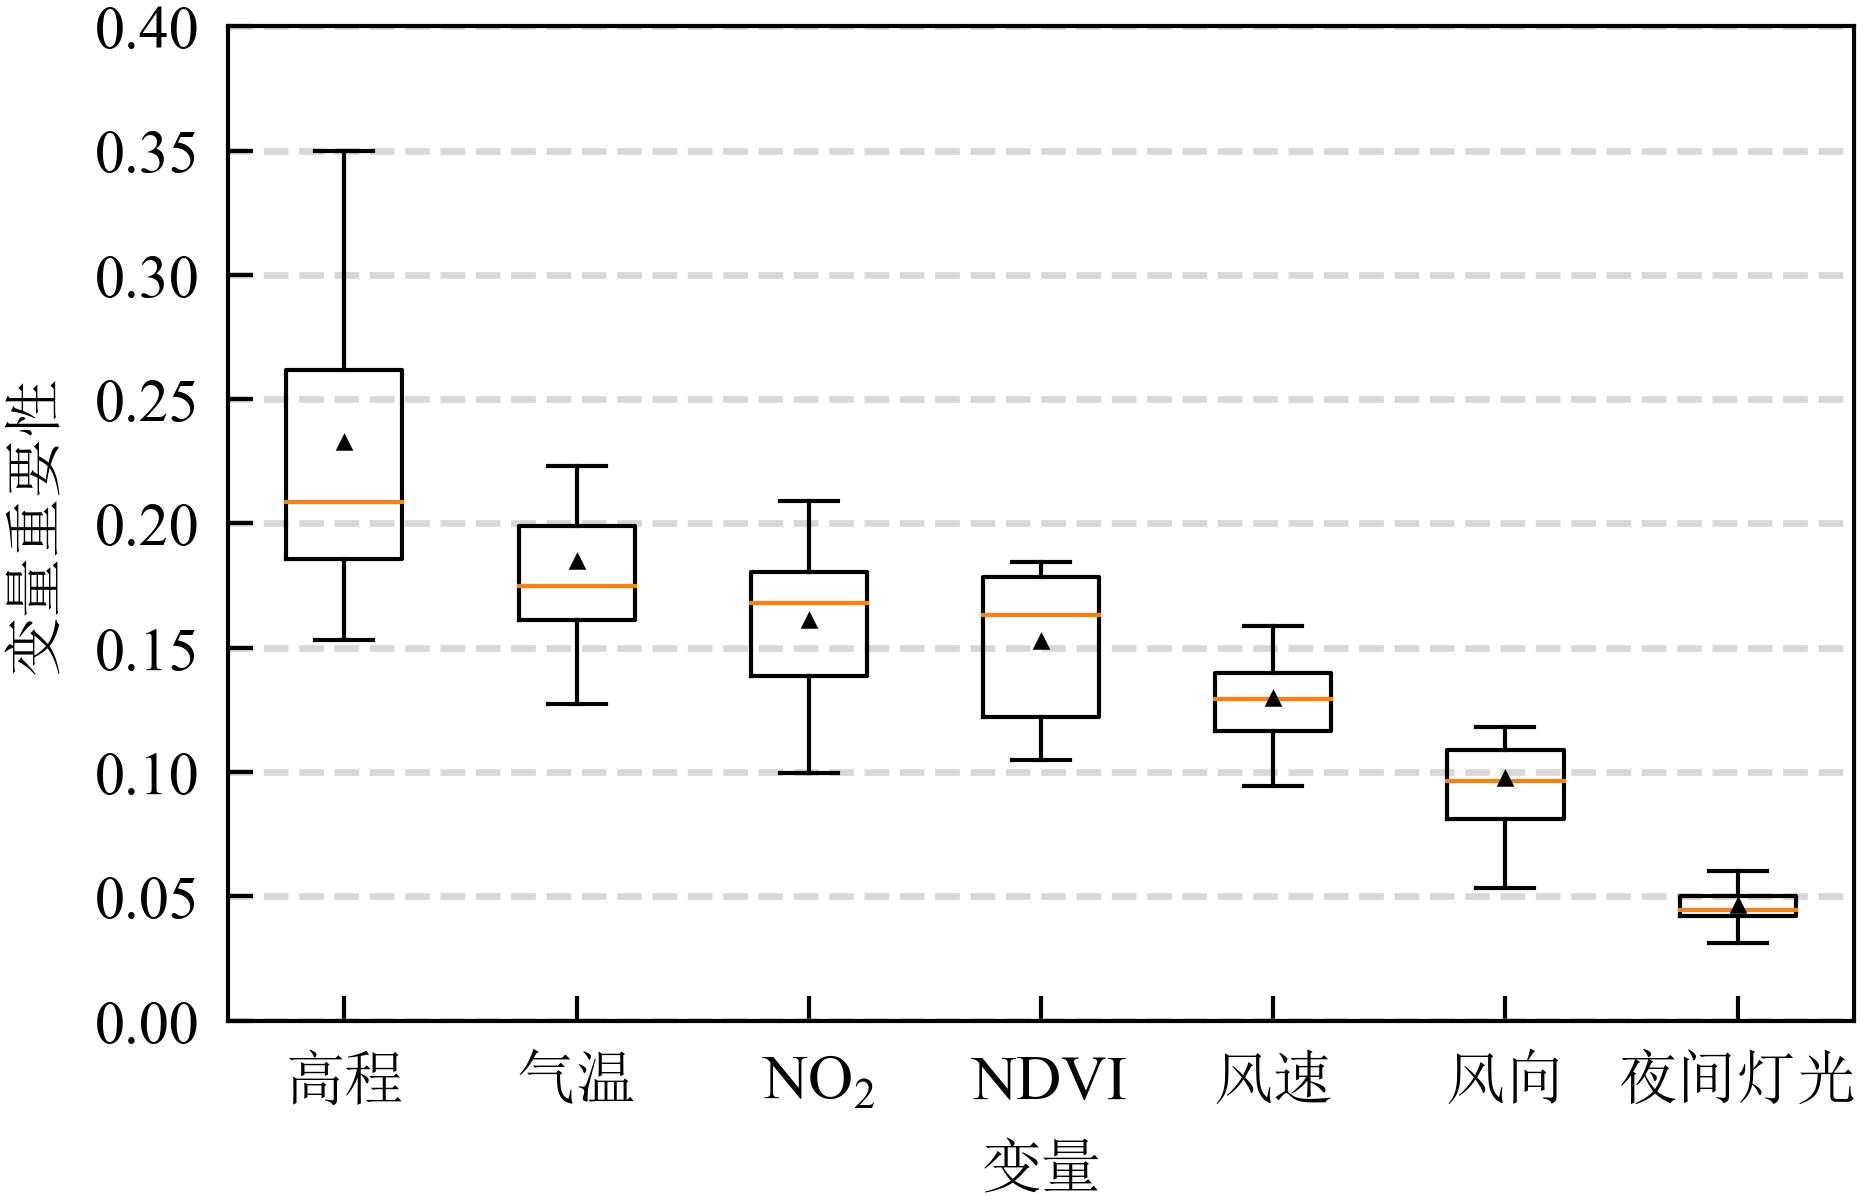
图5 ERT模型变量重要性
Figure 5 Importance of ERT model variables
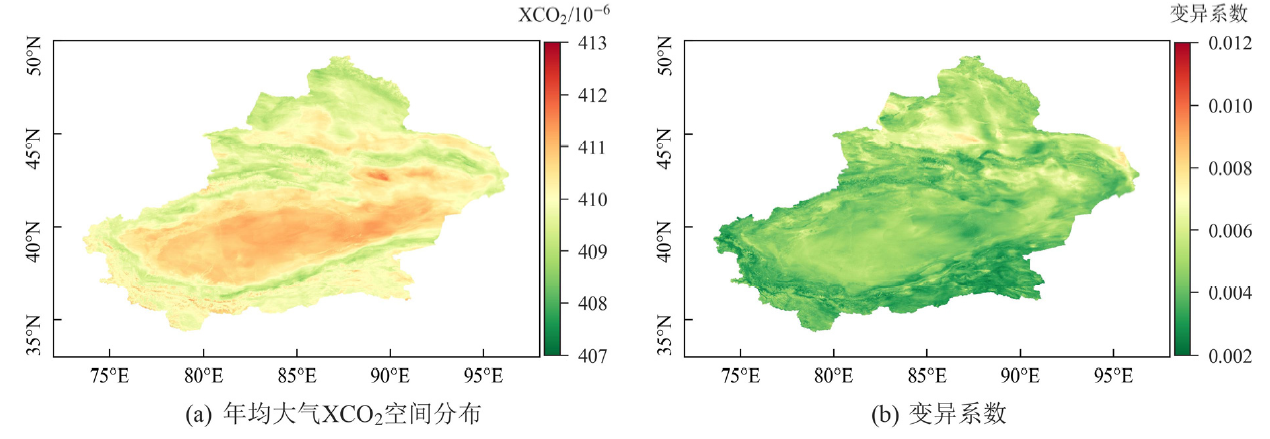
图6 新疆维吾尔自治区2019年大气XCO2空间分布特征
Figure 6 Spatial distribution characteristics of atmospheric XCO2 of Xinjiang Uygur Autonomous Region in 2019
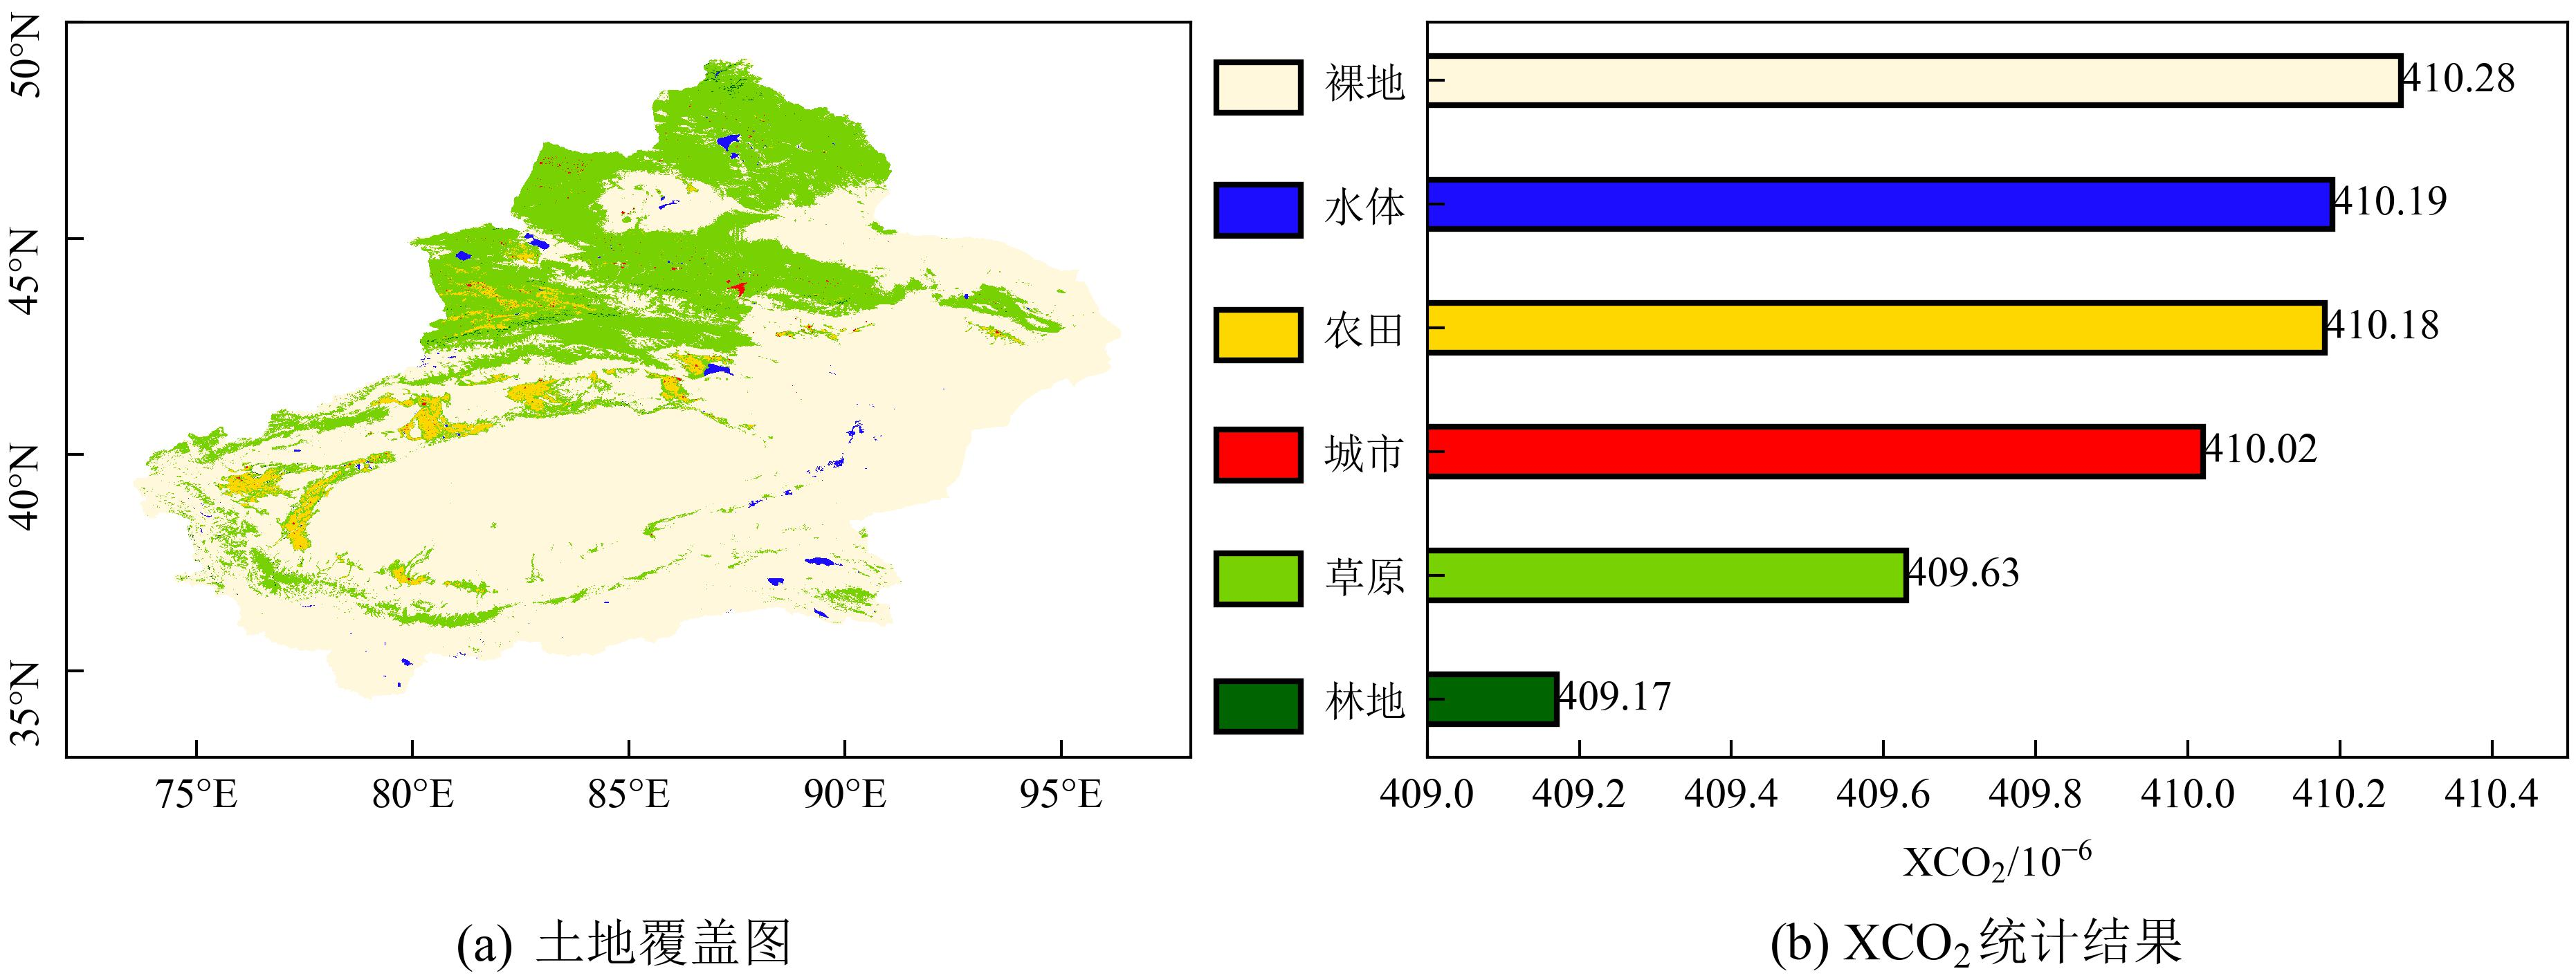
图7 新疆维吾尔自治区2019年土地覆盖图及XCO2统计结果
Figure 7 Landcover map and XCO2 statistics results of Xinjiang Uygur Autonomous Region in 2019

图8 新疆维吾尔自治区2019年每月XCO2空间分布
Figure 8 Spatial distribution of monthly XCO2 in Xinjiang Uygur Autonomous Region in 2019
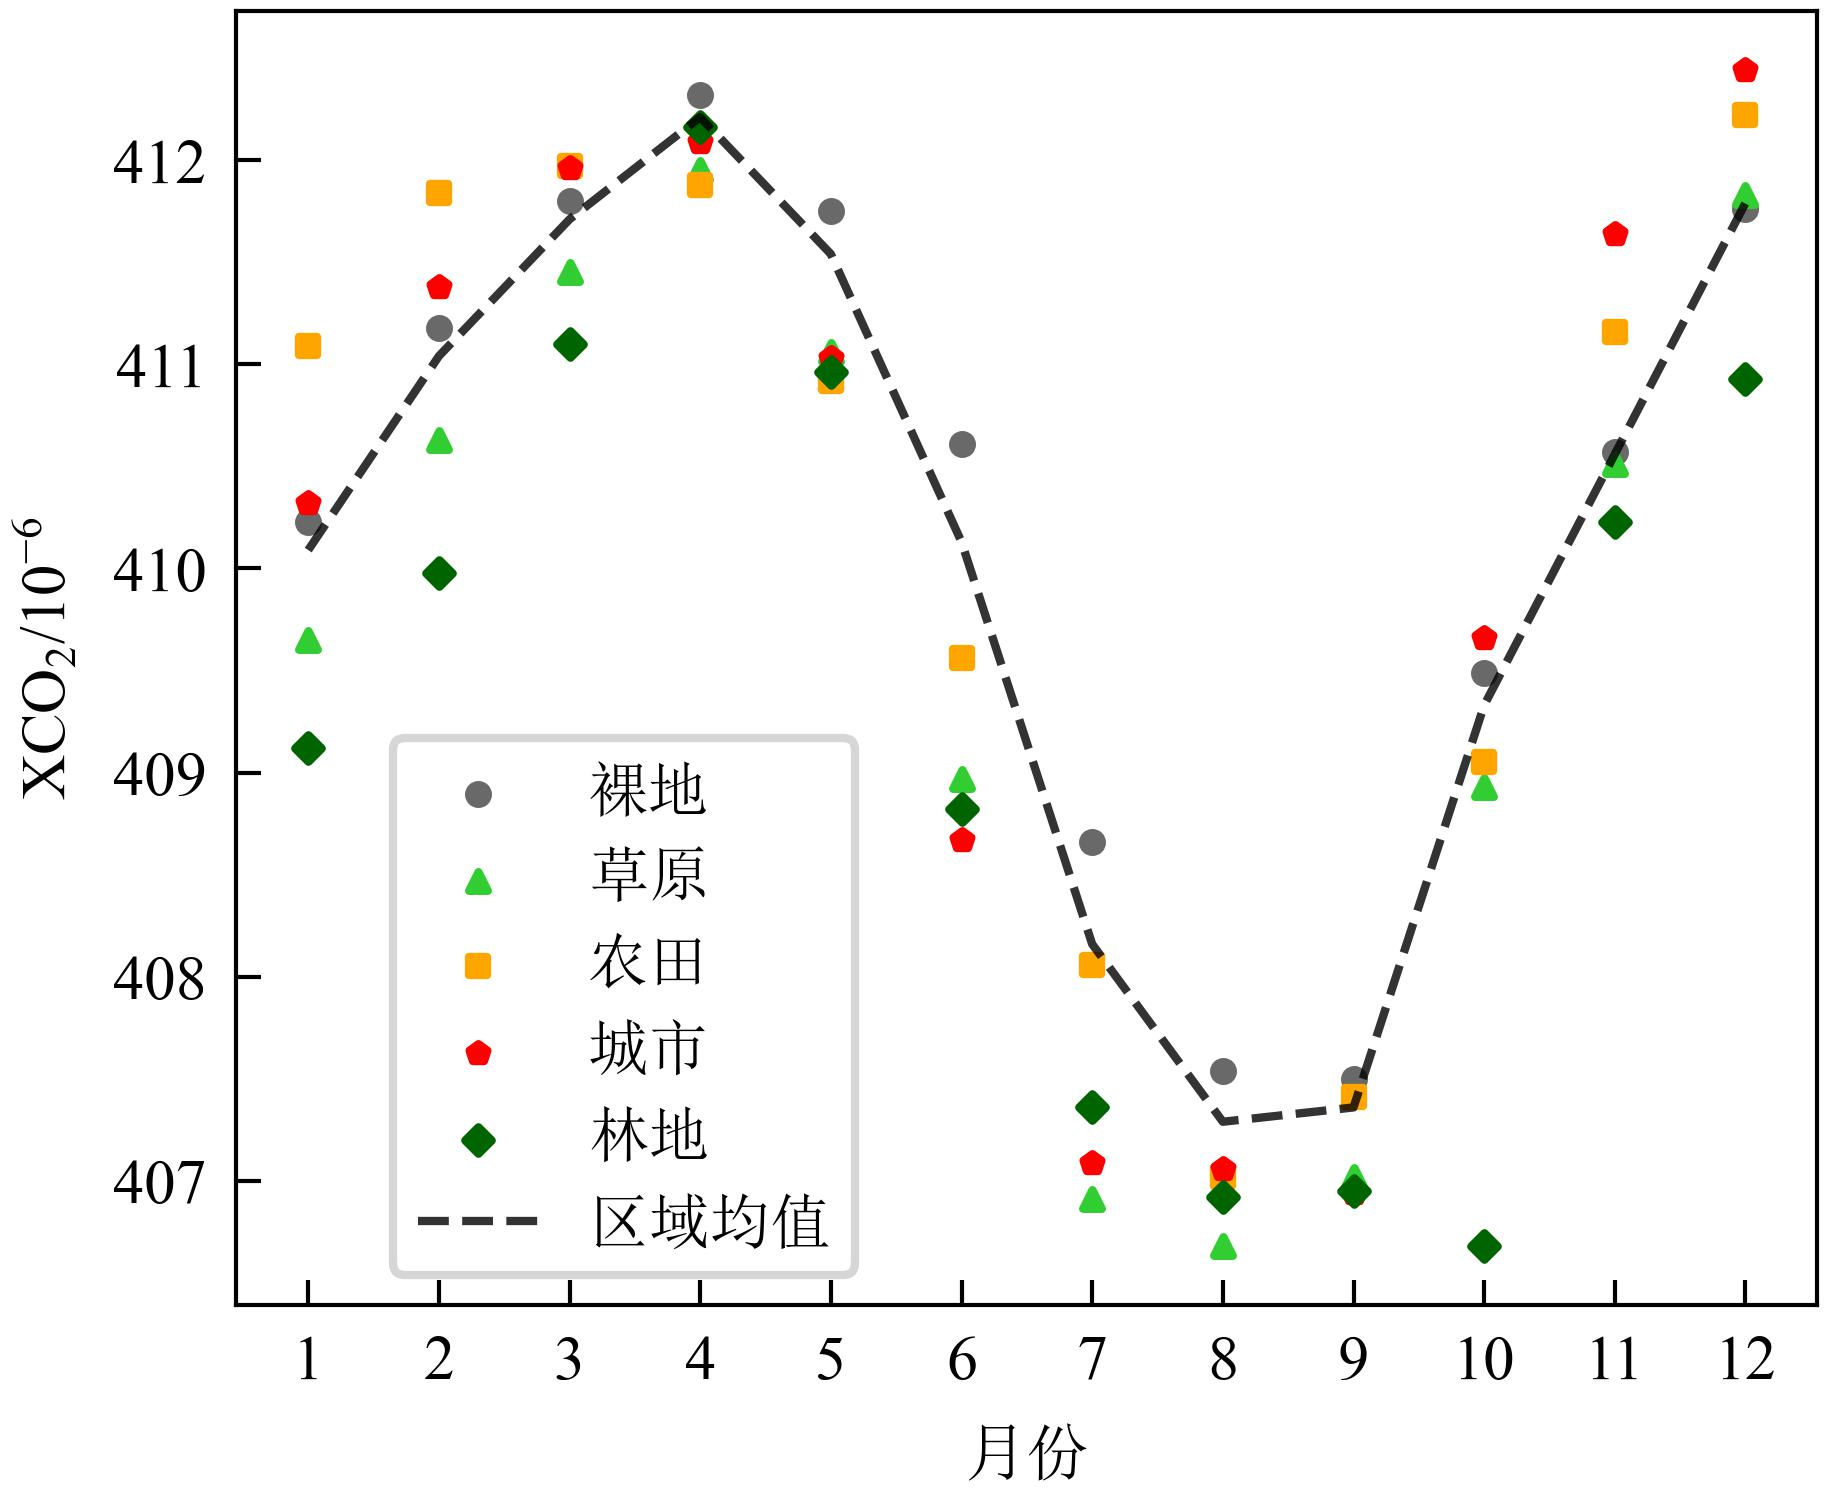
图9 不同土地覆盖类型的XCO2变化情况
Figure 9 XCO2 changes in different land cover types
| [1] |
AUMANN H H, CHAHINE M T, GAUTIER C, et al., 2003. AIRS/AMSU/ HSB on the aqua mission: Design, science objectives, data products, and processing systems[J]. IEEE Transactions on Geoscience and Remote Sensing, 41(2): 253-264.
DOI URL |
| [2] |
BHATTACHARJEE S, CHEN J, 2020. Prediction of satellite-based column CO2 concentration by combining emission inventory and LULC information[J]. IEEE Transactions on Geoscience and Remote Sensing, 58(12): 8285-8300.
DOI URL |
| [3] |
BOVENSMANN H, BURROWS J P, BUCHWITZ M, et al., 1999. SCIAMACHY: Mission objectives and measurement modes[J]. Journal of the Atmospheric Sciences, 56(2): 127-150.
DOI URL |
| [4] |
BREIMAN L, 2001. Random forests[J]. Machine Learning, 45(1): 5-32.
DOI URL |
| [5] | BRUNSDON C, FOTHERINGHAM S, CHARLTON M, 1998. Geographically weighted regression[J]. Journal of the Royal Statistical Society: Series D (The Statistician), 47(3): 431-443. |
| [6] |
CHEN H P, SUN J Q, 2019. Increased population exposure to extreme droughts in China due to 0.5 ℃ of additional warming[J]. Environmental Research Letters, 14(6): 064011.
DOI |
| [7] |
CHEN J, SHI X Y, GU L, et al., 2023. Impacts of climate warming on global floods and their implication to current flood defense standards[J]. Journal of Hydrology, 618(4): 129236.
DOI URL |
| [8] | CHEN T Q, GUESTRIN C, 2016. Xgboost: A scalable tree boosting system[C]// Proceedings of the 22nd acm sigkdd international conference on knowledge discovery and data mining. San Francisco: Association for Computing Machinery: 785-794. |
| [9] |
CRISP D, POLLOCK H R, ROSENBERG R, et al., 2017. The on-orbit performance of the Orbiting Carbon Observatory-2 (OCO-2) instrument and its radiometrically calibrated products[J]. Atmospheric Measurement Techniques, 10(1): 59-81.
DOI URL |
| [10] |
ELDERING A, WENNBERG P O, CRISP D, et al., 2017. The Orbiting Carbon Observatory-2 early science investigations of regional carbon dioxide fluxes[J]. Science, 358(6360): eaam5745.
DOI URL |
| [11] |
FALAHATKAR S, MOUSAVI S M, FARAJZADEH M, 2017. Spatial and temporal distribution of carbon dioxide gas using GOSAT data over IRAN[J]. Environmental Monitoring and Assessment, 189(12): 627.
DOI PMID |
| [12] |
GEURTS P, ERNST D, WEHENKEL L, 2006. Extremely randomized trees[J]. Machine Learning, 63(1): 3-42.
DOI URL |
| [13] |
GOLKAR F, AL-WARDY M, SAFFARI S F, et al., 2019. Using OCO-2 satellite data for investigating the variability of atmospheric CO2 concentration in relationship with precipitation, relative humidity, and vegetation over Oman[J]. Water, 12(1): 101.
DOI URL |
| [14] |
GUO M, XU J W, WANG X F, et al., 2015. Estimating CO2 concentration during the growing season from MODIS and GOSAT in East Asia[J]. International Journal of Remote Sensing, 36(17): 4363-4383.
DOI URL |
| [15] |
HOEGH-GULDBERG O, JACOB D, TAYLOR M, et al., 2019. The human imperative of stabilizing global climate change at 1.5 ℃[J]. Science, 365(6459): eaaw6974.
DOI URL |
| [16] |
HOFMANN D J, BUTLER J H, TANS P P, 2009. A new look at atmospheric carbon dioxide[J]. Atmospheric Environment, 43(12): 2084-2086.
DOI URL |
| [17] |
JONES M W, PETERS G P, GASSER T, et al., 2023. National contributions to climate change due to historical emissions of carbon dioxide, methane, and nitrous oxide since 1850[J]. Scientific Data, 10(1): 155.
DOI PMID |
| [18] |
KIEL M, O’DELL C W, FISHER B, et al., 2019. How bias correction goes wrong: measurement of XCO2 affected by erroneous surface pressure estimates[J]. Atmospheric Measurement Techniques, 12(4): 2241-2259.
DOI URL |
| [19] |
KIM J B, SO J M, BAE D H, 2020. Global warming impacts on severe drought characteristics in Asia monsoon region[J]. Water, 12(5): 1360.
DOI URL |
| [20] |
LI J, JIA K, WEI X Q, et al., 2022. High-spatiotemporal resolution mapping of spatiotemporally continuous atmospheric CO2 concentrations over the global continent[J]. International Journal of Applied Earth Observation and Geoinformation, 108: 102743.
DOI URL |
| [21] |
LIU Q W, WU S M, LEI Y L, et al., 2021. Exploring spatial characteristics of city-level CO2 emissions in China and their influencing factors from global and local perspectives[J]. Science of the Total Environment, 754: 142206.
DOI URL |
| [22] |
LIU Y, WANG X F, GUO M, et al., 2012. Mapping the FTS SWIR L2 product of XCO2 and XCH4 data from the GOSAT by the Kriging method: A case study in East Asia[J]. International Journal of Remote Sensing, 33(10): 3004-3025.
DOI URL |
| [23] |
PARK C, JEONG S, PARK H, et al., 2021. Evaluation of the potential use of satellite-derived XCO2 in detecting CO2 enhancement in megacities with limited ground observations: A case study in Seoul using orbiting carbon Observatory-2[J]. Asia-Pacific Journal of Atmospheric Sciences, 57(2): 289-299.
DOI |
| [24] |
RAN Y H, LI X, 2019. TanSat: A new star in global carbon monitoring from China[J]. Science Bulletin, 64(5): 284-285.
DOI PMID |
| [25] |
SIABI Z, FALAHATKAR S, ALAVI S J, 2019. Spatial distribution of XCO2 using OCO-2 data in growing seasons[J]. Journal of Environmental Management, 244: 110-118.
DOI URL |
| [26] |
SMOLA A J, SCHÖLKOPF B, 2004. A tutorial on support vector regression[J]. Statistics and Computing, 14(3): 199-222.
DOI URL |
| [27] |
WANG L B, ROHLI R V, LIN Q G, et al., 2022. Impact of extreme heatwaves on population exposure in China due to additional warming[J]. Sustainability, 14(18): 11458.
DOI URL |
| [28] |
WATANABE H, HAYASHI K, SAEKI T, et al., 2015. Global mapping of greenhouse gases retrieved from GOSAT Level 2 products by using a kriging method[J]. International Journal of Remote Sensing, 36(6): 1509-1528.
DOI URL |
| [29] |
YANG D X, LIU Y, CAI Z N, et al., 2018. First global carbon dioxide maps produced from TanSat measurements[J]. Advances in Atmospheric Sciences, 35(6): 621-623.
DOI |
| [30] |
YOKOTA T, YOSHIDA Y, EGUCHI N, et al., 2009. Global concentrations of CO2 and CH4 retrieved from GOSAT: First preliminary results[J]. Sola, 5: 160-163.
DOI URL |
| [31] |
ZENG Z C, LEI L P, STRONG K, et al., 2017. Global land mapping of satellite-observed CO2 total columns using spatio-temporal geostatistics[J]. International Journal of Digital Earth, 10(4): 426-456.
DOI URL |
| [32] |
ZHANG M Q, LIU G J, 2023. Mapping contiguous XCO2 by machine learning and analyzing the spatio-temporal variation in China from 2003 to 2019[J]. Science of The Total Environment, 858(Part 2): 159588.
DOI URL |
| [33] | 陈慧, 缪启龙, 买买提艾力·买买提依明, 等, 2015. 塔克拉玛干沙漠腹地春、夏季CO2通量特征[J]. 干旱区地理, 38(3): 487-493. |
| CHEN H, MIAO Q L, ALI M, et al., 2015. CO2 flux characteristics of Taklimakan Desert in spring and summer[J]. Arid Land Geography, 38(3): 487-493. | |
| [34] | 陈良富, 尚华哲, 范萌, 等, 2021. 高分五号卫星大气参数探测综述[J]. 遥感学报, 25(9): 1917-1931. |
|
CHEN L F, SHANG H Z, FAN M, et al., 2021. Mission overview of the GF-5 satellite for atmospheric parameter monitoring[J]. National Remote Sensing Bulletin, 25(9): 1917-1931.
DOI URL |
|
| [35] | 付宏臣, 孙艳玲, 陈莉, 等, 2020. 基于AOD数据与GWR模型的2016年新疆地区PM2.5和PM10时空分布特征[J]. 环境科学学报, 40(1): 27-35. |
| FU H C, SUN Y L, CHEN L, et al., 2020. Temporal and spatial distribution characteristics of PM2.5 and PM10 in Xinjiang region in 2016 based on AOD data and GWR model[J]. Acta Scientiae Circumstantiae, 40(1): 27-35. | |
| [36] | 刘良云, 陈良富, 刘毅, 等, 2022. 全球碳盘点卫星遥感监测方法、进展与挑战[J]. 遥感学报, 26(2): 243-267. |
|
LIU L Y, CHEN L F, LIU Y, et al., 2022. Satellite remote sensing for global stocktaking: methods, progress and perspectives[J]. National Remote Sensing Bulletin, 26(2): 243-267.
DOI URL |
|
| [37] | 孟倩文, 尹球, 2016. 中国区域CO2多年时空变化的卫星遥感分析[J]. 遥感技术与应用, 31(2): 203-213. |
| MENG Q W, YIN Q, 2016. Remote sensing analysis of multi-years spatial and temporal variation of CO2 in China[J]. Remote Sensing Technology and Application, 31(2): 203-213. | |
| [38] | 莫露, 巫兆聪, 张熠, 2021. 中国XCO2时空分布与影响因素分析[J]. 中国环境科学, 41(6): 2562-2570. |
| MO L, WU Z C, ZHANG Y, 2021. Spatial and temporal variations of XCO2 in China and its influencing factors analysis[J]. China Environmental Science, 41(6): 2562-2570. | |
| [39] | 肖钟湧, 陈颖锋, 林晓凤, 等, 2022. 基于多源卫星遥感数据的中国2003年-2018年CO2时空变化研究[J]. 遥感学报, 26(12): 2486-2496. |
|
XIAO Z Y, CHEN Y F, LIN X F et al., 2022. The temporal and spatial variation of CO2 column concentration over China from 2003 to 2018 based on multi-source satellite remote sensing data[J]. National Remote Sensing Bulletin, 26(12): 2486-2496.
DOI URL |
| [1] | 袁茜, 傅开道, 陶雨晨, 张年, 杨丽莎. 澜沧江(云南段)水-气界面氧化亚氮释放通量时空分布特征及其影响因素研究[J]. 生态环境学报, 2024, 33(1): 54-61. |
| [2] | 吴雅睿, 王美景, 王涛, 杨梅焕. 新冠疫情下NO2时空变化特征——以陕西省为例[J]. 生态环境学报, 2023, 32(3): 514-524. |
| [3] | 李姝亭, 胡冠九, 罗小三. 大气环境中全(多)氟烷基化合物(PFASs)的来源、分布及健康风险研究进展[J]. 生态环境学报, 2023, 32(12): 2103-2114. |
| [4] | 刘明宇, 郑旭, 强丽媛, 李鲁华, 张若宇, 王家平. 1994-2020年中国农用薄膜使用量变化与农膜微塑料污染现状分析[J]. 生态环境学报, 2023, 32(11): 2050-2061. |
| [5] | 孙正, 曹亚非, 王德彩, 刘峰, 宋效东, 张甘霖, 吴华勇. 近30年京津冀电镀场地时空演变特征及趋势预测[J]. 生态环境学报, 2023, 32(1): 183-194. |
| [6] | 魏小锋, 韩红, 闫学军, 王在峰, 李圣增, 田勇, 梁第, 马明亮, 张桂芹. 基于卫星遥感与CMB模型的济南市冬季重污染过程PM2.5溯源分析[J]. 生态环境学报, 2022, 31(6): 1175-1183. |
| [7] | 贺斌, 胡茂川. 广东省各区县农业面源污染负荷估算及特征分析[J]. 生态环境学报, 2022, 31(4): 771-776. |
| [8] | 王金杰, 赵安周, 胡小枫. 京津冀植被净初级生产力时空分布及自然驱动因子分析[J]. 生态环境学报, 2021, 30(6): 1158-1167. |
| [9] | 郑诗禹, 张绿水, 郭晓敏, 黄子峻, 肖以华. 不同森林郁闭度环境内空气负氧离子的时空变化及环境影响要素研究——以广州帽峰山为例[J]. 生态环境学报, 2021, 30(11): 2204-2212. |
| [10] | 王薇, 程歆玥, 胡春, 夏斯涵, 王甜. 城市街道峡谷PM2.5时空分布特征与空气质量评价——以合肥市长淮街道为例[J]. 生态环境学报, 2021, 30(11): 2157-2164. |
| 阅读次数 | ||||||
|
全文 |
|
|||||
|
摘要 |
|
|||||