生态环境学报 ›› 2022, Vol. 31 ›› Issue (1): 89-99.DOI: 10.16258/j.cnki.1674-5906.2022.01.011
符传博1,3( ), 丹利2,*(), 刘丽君1,3, 佟金鹤1,3
收稿日期:2021-07-06
出版日期:2022-01-18
发布日期:2022-03-10
通讯作者:
*丹利,研究员,博士研究生导师,E-mail: danli@tea.ac.cn作者简介:符传博(1985年生),男,正高级工程师,主要从事大气环境与气候模拟的研究。E-mail: hnfuchuanbo@163.com
基金资助:
FU Chuanbo1,3(), DAN Li2,*(), LIU Lijun1,3, TONG Jinhe1,3
Received:2021-07-06
Online:2022-01-18
Published:2022-03-10
摘要:
三亚市位于海南岛最南端,旅游资源丰富,生态环境良好,是海南建设国际旅游岛和国家生态文明试验区的重要城市之一。2019年秋季三亚市出现的一次臭氧(Ozone,O3)污染过程,为科学认识三亚市此次O3污染特征及气象学成因,也为进一步开展O3污染预警预报和科学治理提供技术支撑,利用2019年11月1—6日三亚市生态环境局对外发布的大气污染物数据,以及地面常规观测数据,结合ECMWF发布的第5代资料(the fifth generation ECMWF reanalysis data,ERA5),采用相关分析和后向轨迹模型对其进行分析。结果表明,11月4日和5日O3-8 h(臭氧最大8 h滑动平均)分别为162 μg∙m-3和180 μg∙m-3,超标百分比为101.25%和112.50%。5日O3-1 h(臭氧最大1 h平均)达到了203 μg∙m-3,超标百分比为101.50%。14:00—19:00是O3质量浓度高值时段,气温偏高,相对湿度偏小,风速偏弱等气象条件的出现促进了此次O3污染过程的发生。天气形势特征分析表明,低层冷空气扩散南下,低空风场逆转为东北风,有利于北方污染气团向三亚市输送;后向轨迹分析表明,污染时段的影响气流主要来自中国内陆地区,经过广东省珠三角地区到达三亚市。通过物理量场的计算可知,受五指山山脉的阻挡,低层气流绕山辐合明显,污染时段三亚市上空气流辐合中心值高达-12×10-5·s-1,加之10 m风速(v10 m wind)和垂直切变较弱,不利于三亚市O3的扩散。
中图分类号:
符传博, 丹利, 刘丽君, 佟金鹤. 2019年秋季三亚市一次典型臭氧污染个例气象成因解析[J]. 生态环境学报, 2022, 31(1): 89-99.
FU Chuanbo, DAN Li, LIU Lijun, TONG Jinhe. Characteristics of A Typical Ozone Pollution Event and Its Meteorological Reason in Sanya City in Autumn 2019[J]. Ecology and Environment, 2022, 31(1): 89-99.
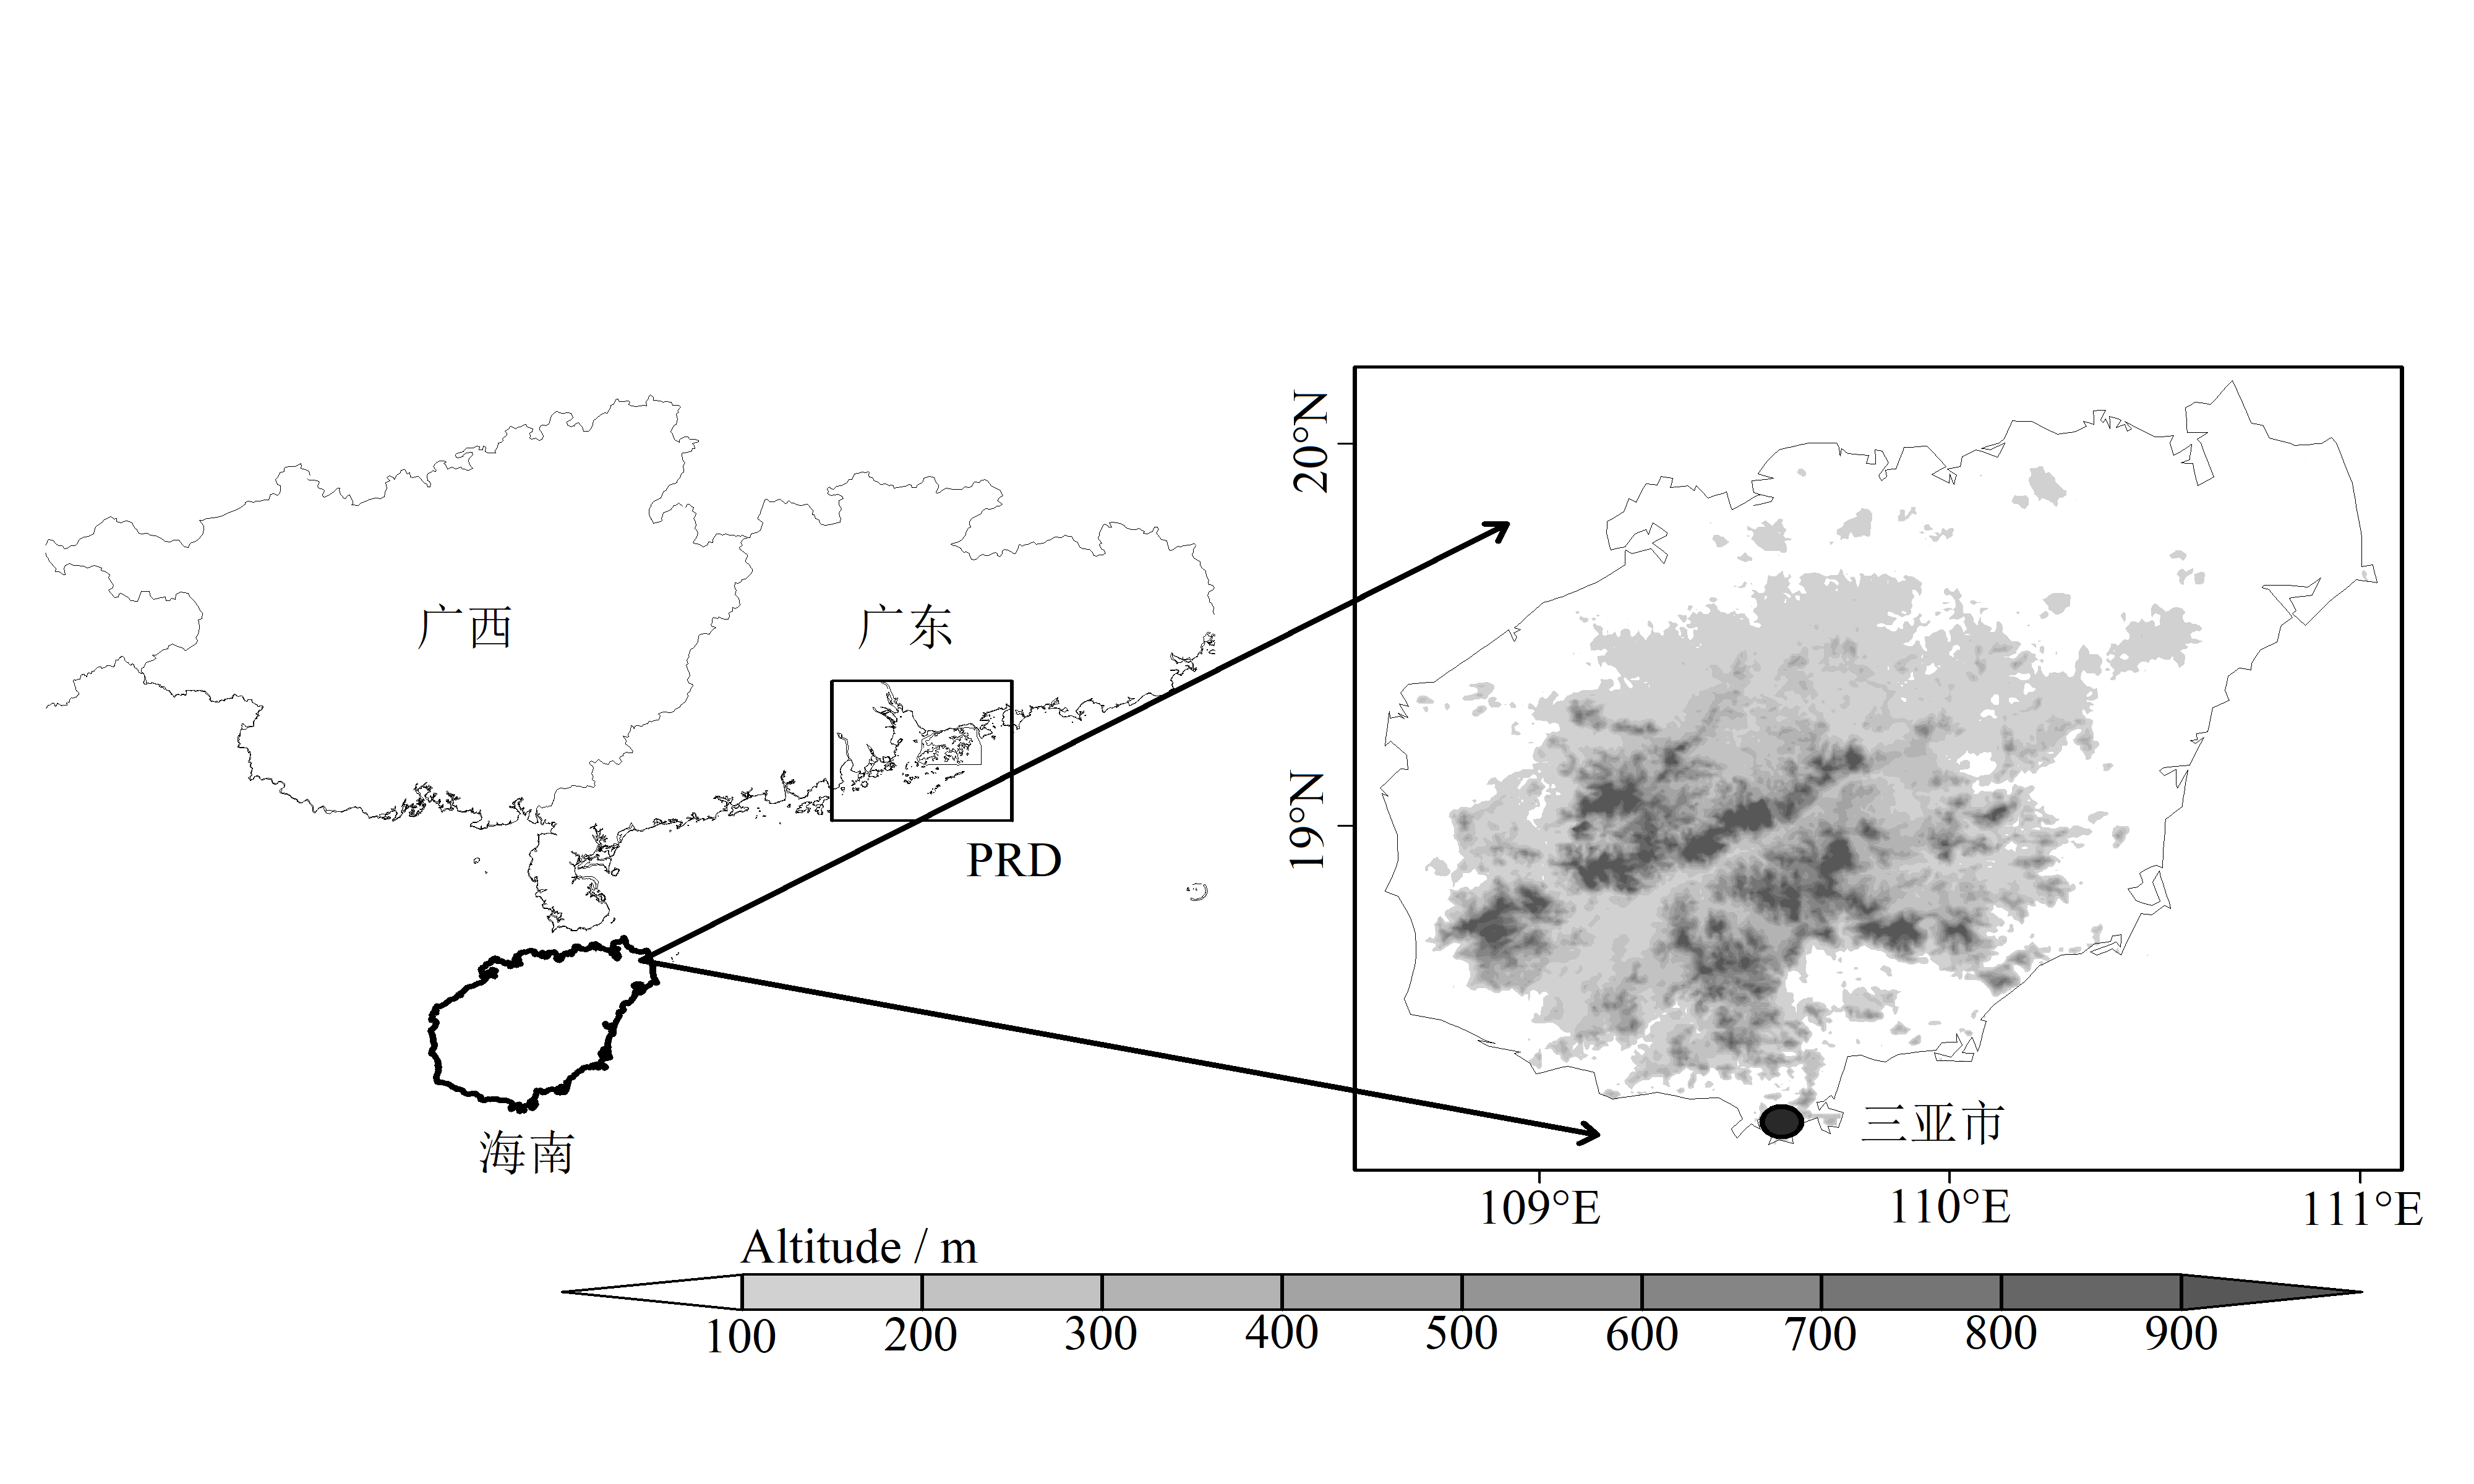
图1 三亚市地理位置示意图
Figure 1 Geographical distribution of Sanya City
| 日期 Date | AQI | PM2.5/ (μg∙m-3) | PM10/ (μg∙m-3) | SO2/ (μg∙m-3) | NO2/ (μg∙m-3) | O3-8 h/ (μg∙m-3) | O3-1 h/ (μg∙m-3) | CO/ (mg∙m-3) |
|---|---|---|---|---|---|---|---|---|
| 1 | 26 | 6 | 14 | 4 | 5 | 52 | 59 | 0.4 |
| 2 | 37 | 12 | 29 | 4 | 4 | 74 | 79 | 0.4 |
| 3 | 67 | 20 | 39 | 4 | 13 | 120 | 136 | 0.4 |
| 4 | 102 | 46 | 76 | 7 | 20 | 162 | 185 | 0.7 |
| 5 | 119 | 40 | 71 | 7 | 16 | 180 | 203 | 0.6 |
| 6 | 82 | 36 | 62 | 6 | 14 | 141 | 144 | 0.6 |
表1 2019年11月1—6日三亚市AQI和大气污染物质量浓度对比
Table 1 Comparison of AQI and air pollutant concentration in Sanya City from November 1-6, 2019
| 日期 Date | AQI | PM2.5/ (μg∙m-3) | PM10/ (μg∙m-3) | SO2/ (μg∙m-3) | NO2/ (μg∙m-3) | O3-8 h/ (μg∙m-3) | O3-1 h/ (μg∙m-3) | CO/ (mg∙m-3) |
|---|---|---|---|---|---|---|---|---|
| 1 | 26 | 6 | 14 | 4 | 5 | 52 | 59 | 0.4 |
| 2 | 37 | 12 | 29 | 4 | 4 | 74 | 79 | 0.4 |
| 3 | 67 | 20 | 39 | 4 | 13 | 120 | 136 | 0.4 |
| 4 | 102 | 46 | 76 | 7 | 20 | 162 | 185 | 0.7 |
| 5 | 119 | 40 | 71 | 7 | 16 | 180 | 203 | 0.6 |
| 6 | 82 | 36 | 62 | 6 | 14 | 141 | 144 | 0.6 |
| 日期 Date | 日降水量 Daily precipitation/ mm | 平均气温 Average temperature/ ℃ | 相对湿度 Relative humidity/ % | 平均风速 Average wind speed/ (m∙s-1) | 平均气压 Average pressure/ hPa |
|---|---|---|---|---|---|
| 1 | 105.8 | 22.7 | 100 | 6.2 | 965.0 |
| 2 | 3.9 | 23.3 | 90 | 8.5 | 964.8 |
| 3 | 0.0 | 23.1 | 81 | 4.9 | 964.9 |
| 4 | 0.0 | 23.1 | 78 | 5.5 | 965.3 |
| 5 | 0.0 | 22.3 | 72 | 4.0 | 964.5 |
| 6 | 0.0 | 21.6 | 79 | 4.0 | 962.9 |
表2 2019年11月1—6日三亚市气象要素对比
Table 2 Comparison of meteorological factors in Sanya City from November 1-6, 2019
| 日期 Date | 日降水量 Daily precipitation/ mm | 平均气温 Average temperature/ ℃ | 相对湿度 Relative humidity/ % | 平均风速 Average wind speed/ (m∙s-1) | 平均气压 Average pressure/ hPa |
|---|---|---|---|---|---|
| 1 | 105.8 | 22.7 | 100 | 6.2 | 965.0 |
| 2 | 3.9 | 23.3 | 90 | 8.5 | 964.8 |
| 3 | 0.0 | 23.1 | 81 | 4.9 | 964.9 |
| 4 | 0.0 | 23.1 | 78 | 5.5 | 965.3 |
| 5 | 0.0 | 22.3 | 72 | 4.0 | 964.5 |
| 6 | 0.0 | 21.6 | 79 | 4.0 | 962.9 |
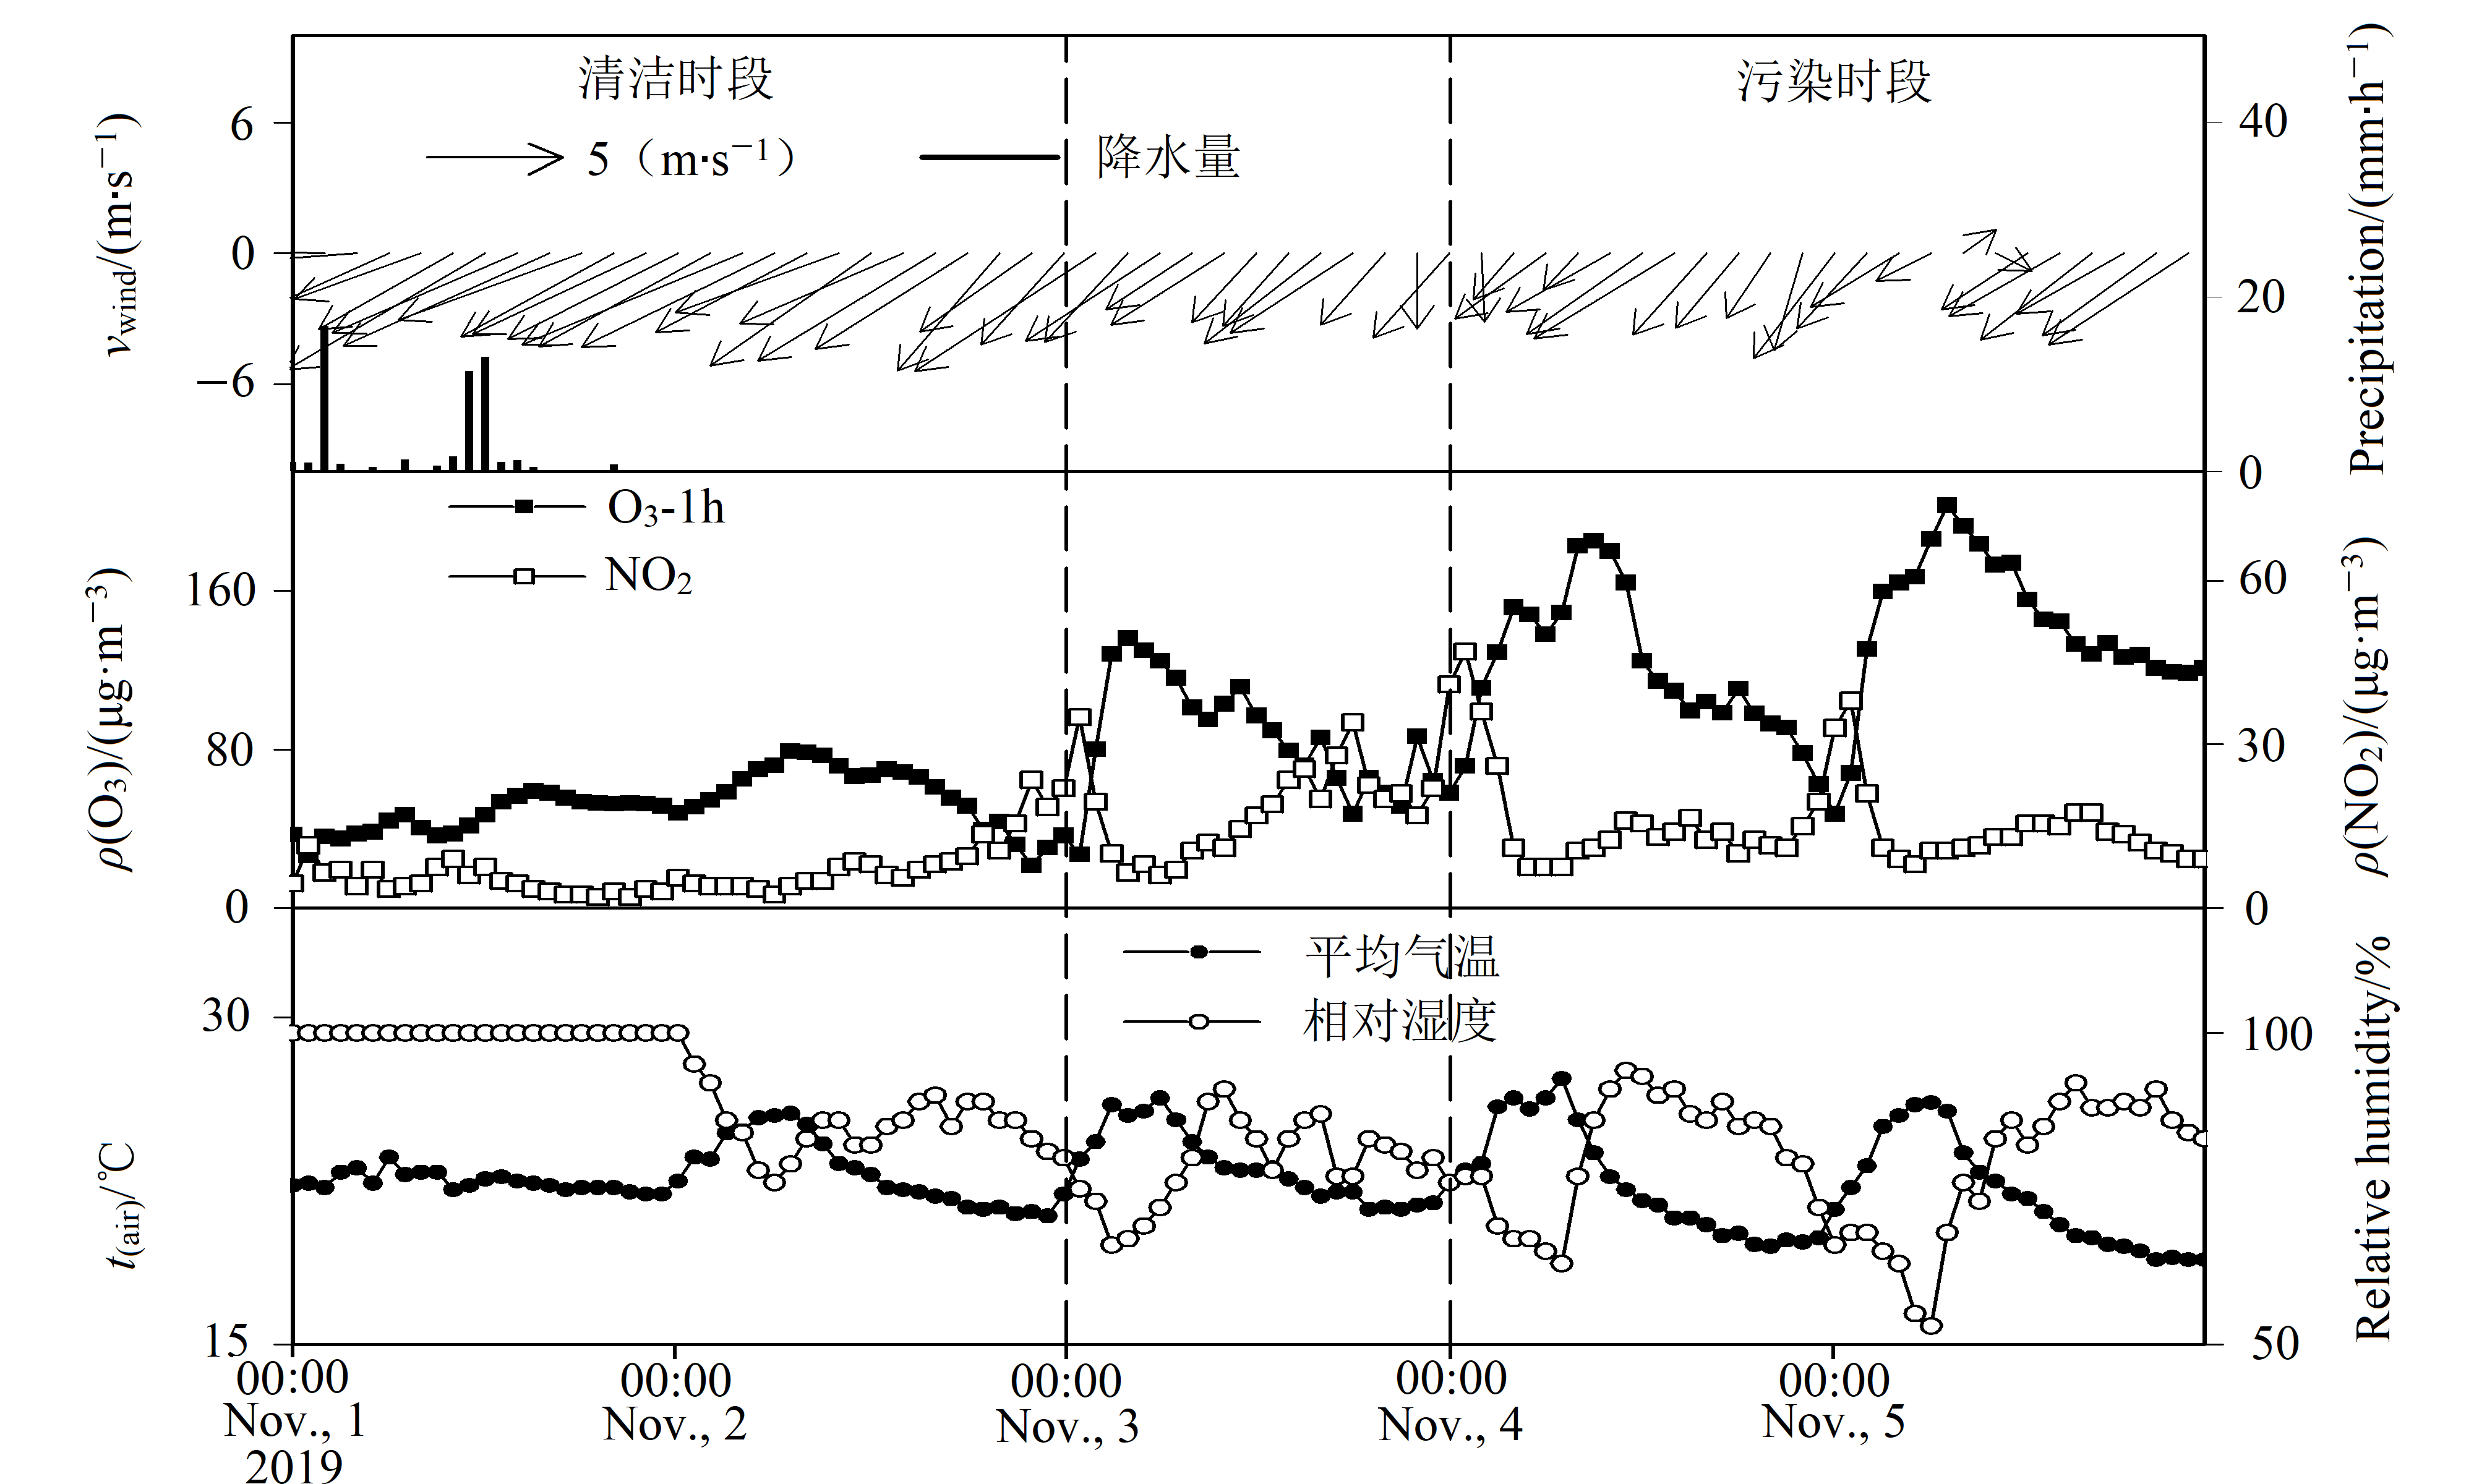
图2 2019年11月1—5日三亚市O3、NO2质量浓度和气象要素逐时变化
Figure 2 Hourly variation of O3, NO2 and meteorological factors in Sanya City from November 1st to 5th, 2019
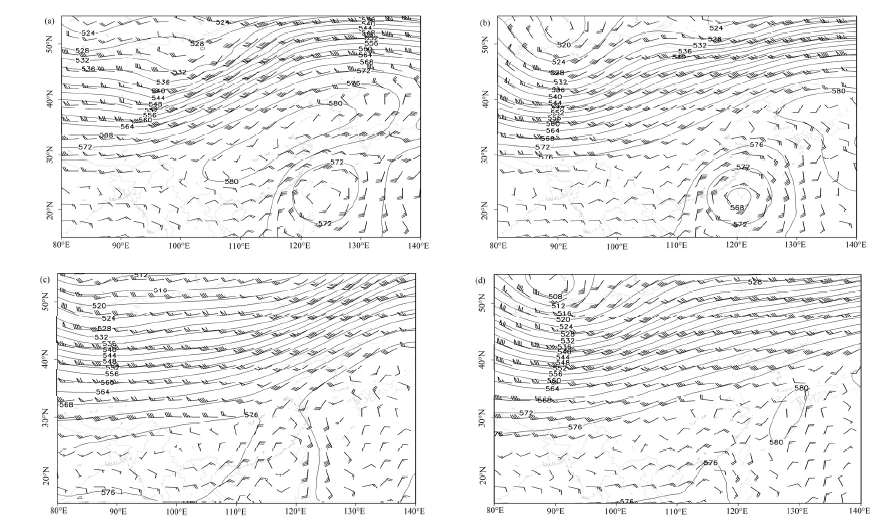
图3 2019年11月初500 hPa高度场和风场 (a)11月1日、(b)11月2日、(c)11月4日、(d)11月5日高度场(黑色实线,100 dagpm)和风速(m∙s-1)
Figure 3 500 hPa geopotential height and wind fields in early November 2019 (a) Nov., 1, (b) Nov., 2, (c) Nov., 4, (d) Nov., 5 of geopotential height (black contours, 100 dagpm) and wind speed (m∙s-1)

图4 2019年11月初主要气象要素场分布 (a)11月1日、(b)11月2日、(c)11月4日、(d)11月5日
Figure 4 Distribution of main meteorological parameter fields in early November 2019 (a) Nov., 1, (b) Nov., 2, (c) Nov., 4, (d) Nov., 5
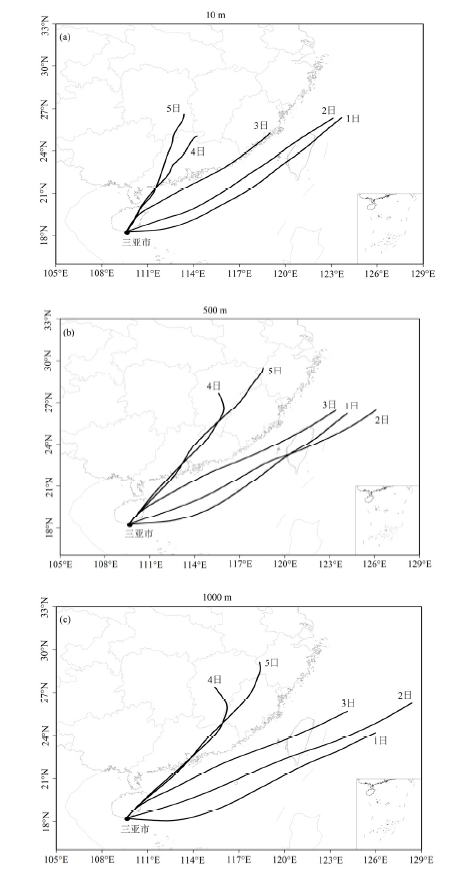
图5 2019年11月1日—5日08时三亚市不同高度48 h后向轨迹
Figure 5 48h backward trajectories of air parcel at different altitudes during the period of 1 to 5 November at 08:00, 2019 in Sanya City

图6 2019年11月初950 hPa风场、气温和垂直速度分布 (a)11月1日14:00、(b)11月2日14:00、(c)11月4日14:00、(d)11月5日14:00风场、气温和垂直速度。正数代表垂直向下运动,负数代表垂直向上运动
Figure 6 Distribution of 950 hPa wind field, air temperature and vertical velocity fields in early November 2019 (a) Nov., 1 at 14:00, (b) Nov., 2 at 14:00, (c) Nov., 4 at 14:00, (d) Nov., 5 at 14:00 of wind field, air temperature and vertical speed. Positive numbers represent vertical downward movement, negative numbers represent vertical upward movement
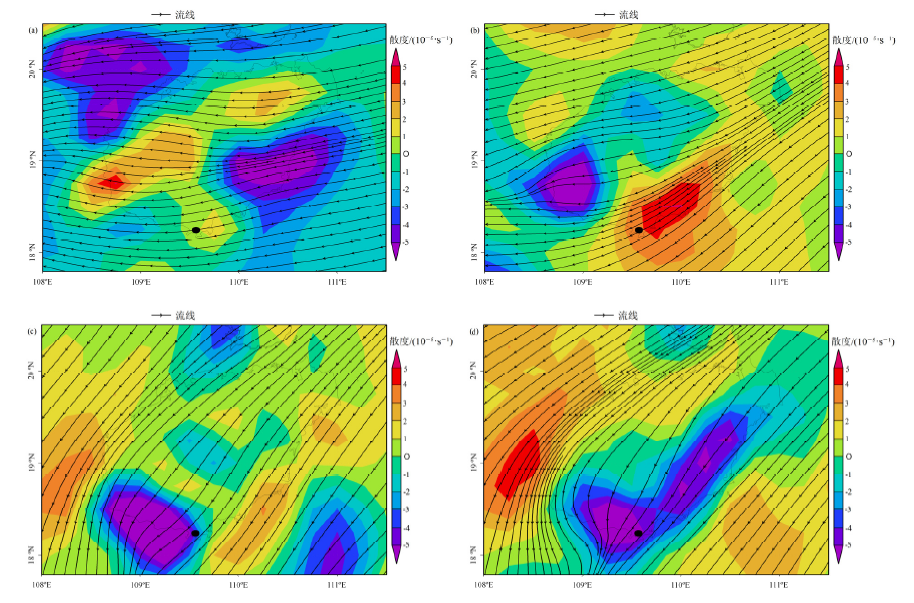
图7 2019年11月初950 hPa散度和流场分布 (a)11月1日14:00、(b)11月2日14:00、(c)11月4日14:00、(d)11月5日14:00散度和流线。正数代表水平辐散,负数代表水平辐合
Figure 7 Distribution of 950 hPa divergence and flow fields in early November 2019 (a) Nov., 1 at 14:00, (b) Nov., 2 at 14:00, (c) Nov., 4 at 14:00, (d) Nov., 5 at 14:00 of divergence and streamline. Positive numbers represent horizontal divergence, negative numbers represent horizontal convergence
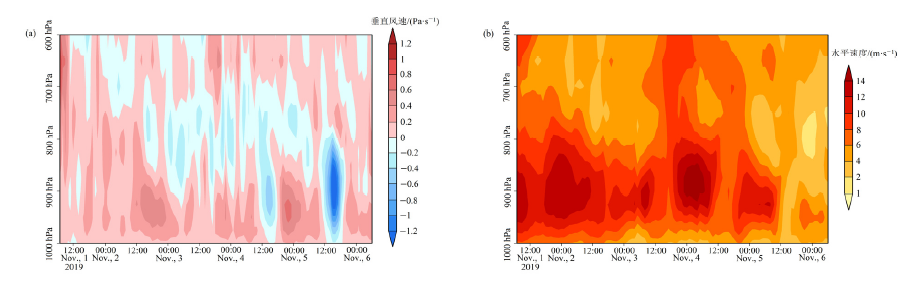
图8 2019年11月初三亚市不同层次垂直风和水平速度分布 垂直风正数代表垂直向下运动,负数代表垂直向上运动
Figure 8 Distribution of vertical wind and horizontal velocity at different levels in Sanya in early November 2019 Positive numbers of vertical wind represent vertical downward movement, and negative numbers represent vertical upward movement
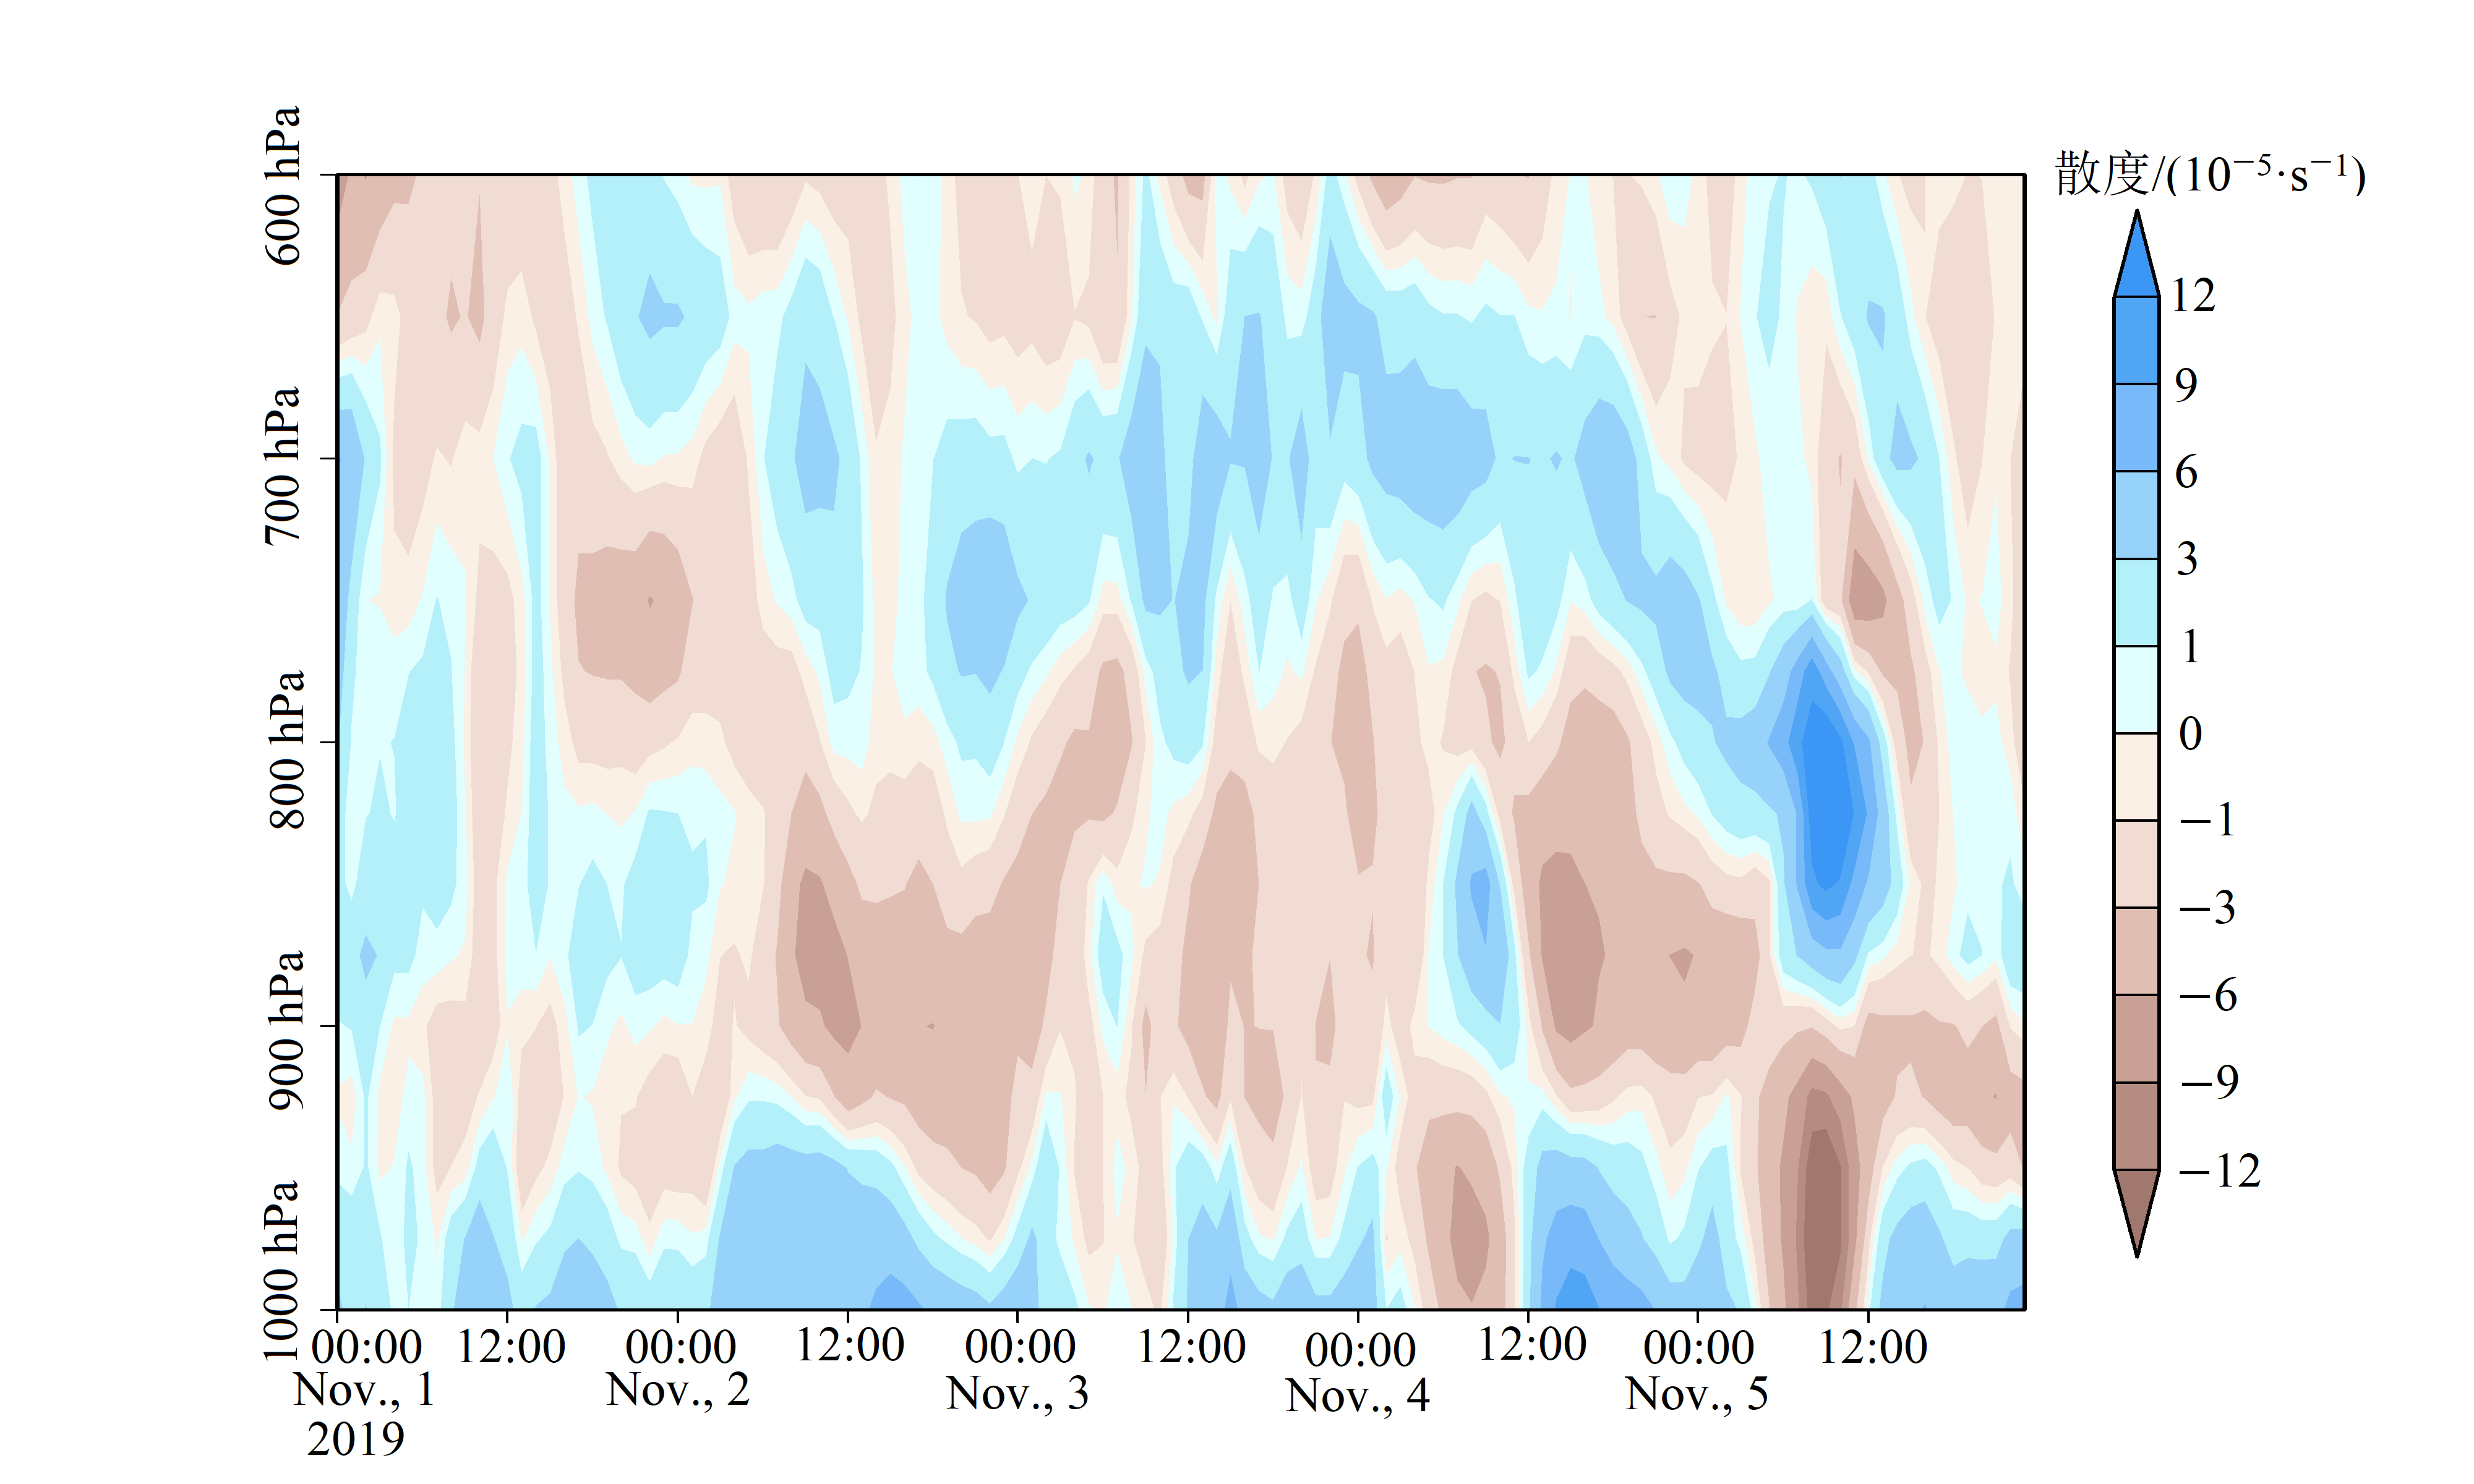
图9 三亚市2019年11月初不同层次散度场分布
Figure 9 Distribution of different levels of Divergence in Sanya City in early November 2019
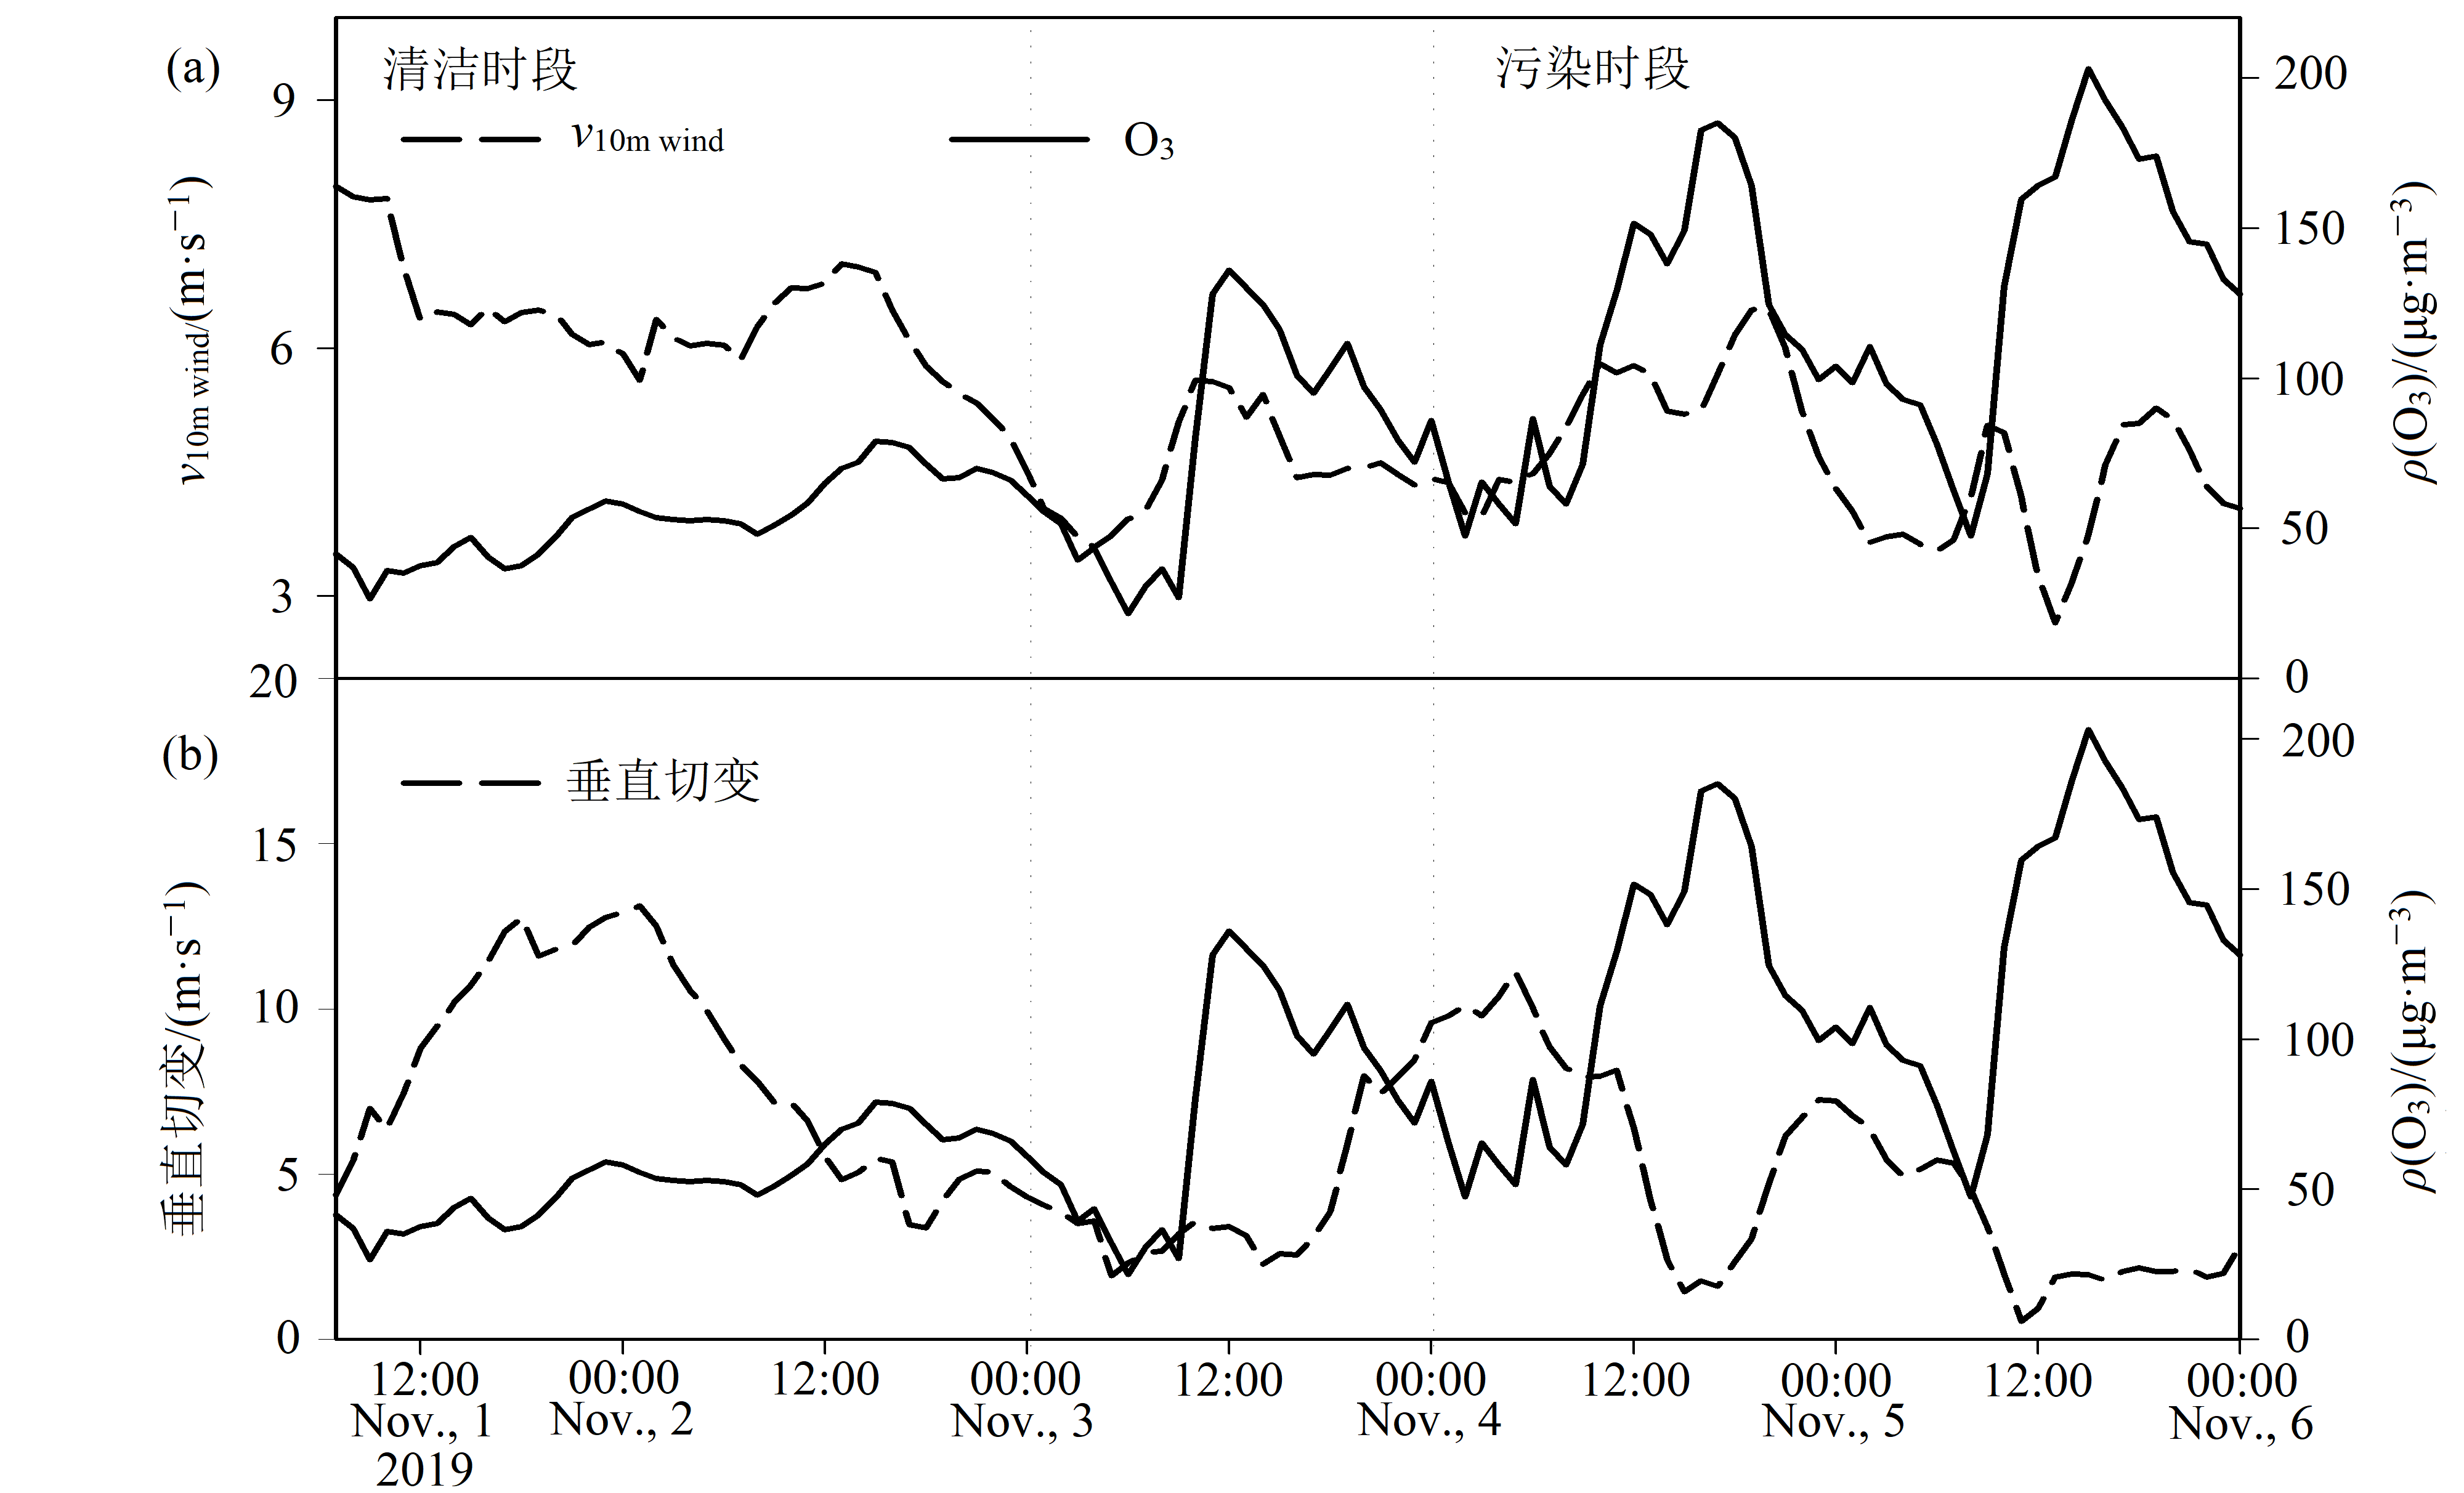
图10 2019年11月初三亚市10 m风速和500 hPa与850 hPa水平风垂直切变逐时变化 (a)风速、(b)水平风垂直切变
Figure 10 Hourly change of 10m wind speed and 500hPa and 850hPa horizontal wind vertical shear at different levels in Sanya in early November 2019 (a) wind speed, (b) horizontal wind vertical shear
| [1] |
ANENERG S C, HOROWITZ L W, TONG D Q, et al., 2010. An estimate of the global burden of anthropogenic ozone and fine particulate matter on premature human mortality using atmospheric modeling[J]. Environmental Health Perspectives, 118(9): 1189-1195.
DOI URL |
| [2] | CROZE M, ZIMMER L, LEE H, 2018. Ozone atmospheric pollution and alzheimer’s disease: from epidemiological facts to molecular mechanisms[J]. Journal of Alzheimer’s Disease, 62(2): 503-522. |
| [3] |
FU Y, LIAO H, YANG Y, et al., 2019. Interannual and decadal changes in tropospheric ozone in China and the associated chemistry–climate interactions: A review[J]. Advances in Atmospheric Sciences, 36(9): 975-993.
DOI URL |
| [4] |
FUHRER J, 2009. Ozone Risk for Crops and Pastures in Present and Future Climates[J]. Die Naturwissenschaften, 96(2): 173-94.
DOI URL |
| [5] | LI M, ZHANG Q, ZHENG B, et al., 2019. Persistent growth of anthropogenic non-Methane volatile organic compound (NMVOC) emissions in China during 1990-2017: Drivers, speciation and ozone formation potential[J]. Atmospheric Chemistry and Physics, 19(13): 8897-8913. |
| [6] |
LIU H, LIU S, XUE B R, et al., 2018. Ground-level ozone pollution and its health impacts in China[J]. Atmospheric Environment, 173: 223-230.
DOI URL |
| [7] | 程麟钧, 王帅, 宫正宇, 等, 2017. 中国臭氧浓度的时空变化特征及分区[J]. 中国环境科学, 37(11): 4003-4012. |
| CHENG L J, WANG S, GONG Z Y, et al., 2017. Spatial and seasonal variation and regionalization of ozone concentrations in China[J]. China Environmental Science, 37(11): 4003-4012. | |
| [8] | 程麟钧, 2018. 我国臭氧污染特征及分区管理方法研究[D]. 北京: 中国地质大学. |
| CHENG L J., 2018. A study on the evolution of ozone pollution in China and regional management methods[D]. Beijing: China University of Geosciences. | |
| [9] | 冯兆忠, 李品, 袁相洋, 等, 2018. 我国地表臭氧生态环境效应研究进展[J]. 生态学报, 38(5): 1530-1541. |
| FENG Z Z, LI P, YUAN X Y, et al., 2018. Progress in ecological and environmental effects of ground-level O3 in China[J]. Acta Ecologica Sinica, 38(5): 1530-1541. | |
| [10] | 符传博, 唐家翔, 丹利, 等, 2016. 2014年海口市大气污染物演变特征及典型污染个例分析[J]. 环境科学学报, 36(6): 2160-2169. |
| FU C B, TANG J X, DAN L, et al., 2016. Evolution of ambient air quality and case study of an air pollution event in 2014 over Haikou, China[J]. Acta Scientiae Circumstantiae, 36(6): 2160-2169. | |
| [11] | 符传博, 丹利, 徐文帅, 等, 2020a. 2014-2019年三亚市臭氧浓度变化特征[J]. 生态环境学报, 29(10): 2028-2033. |
| FU C B, DAN L, XU W S, et al., 2020a. Variation of O3 concentration in Sanya city from 2014 to 2019 [J]. Ecology and Environmental Sciences, 29(10): 2028-2033. | |
| [12] | 符传博, 丹利, 徐文帅, 等, 2020b. 基于轨迹模式分析海口市大气污染的输送及潜在源区[J]. 环境科学学报, 40(1): 36-42. |
| FU C B, DAN L, XU W S, et al., 2020b. Analysis of air polluted transportation and potential source in Haikou City based on trajectory model[J]. Acta Scientiae Circumstantiae, 40(1): 36-42. | |
| [13] | 符传博, 周航, 2021. 中国城市臭氧的形成机理及污染影响因素研究进展[J]. 中国环境监测, 37(2): 33-43. |
| FU C B, ZHOU H, 2021. Research progress on the formation mechanism and impact factors of urban ozone pollution in China[J]. Environmental Monitoring in China, 37(2): 33-43. | |
| [14] | 耿春梅, 王宗爽, 任丽红, 等, 2014. 大气臭氧浓度升高对农作物产量的影响[J]. 环境科学研究, 27(3): 239-245. |
| GENG C M, WANG Z S, REN L H, et al., 2014. Study on the impact of elevated atmospheric ozone on crop yield[J]. Research of Environmental Sciences, 27(3): 239-245. | |
| [15] | 姜允迪, 祁斌, 2000. 兰州城区臭氧浓度时空变化特征及其与气象条件的关系[J]. 兰州大学学报 (自然科学版), 36(5):118-125. |
| JIANG Y D, QI B, 2000. Temporal and spatial variations of ozone concentration and its relations with meteorological factors in Lanzhou proper[J]. Journal of Lanzhou University (Natural Science), 36(5):118-125. | |
| [16] | 李莉莉, 王隆, 刘喜平, 等, 2020. 哈尔滨市臭氧时空分布特征及气象要素的关系[J]. 中国环境科学, 40(5): 1991-1999. |
| LI L L, WANG L, LIU X P, et al., 2020. Temporal and spatial distribution characteristics of ozone and its relationship with meteorological factors in Harbin[J]. China Environmental Science, 40(5): 1991-1999. | |
| [17] | 李全喜, 王金艳, 刘筱冉, 等, 2018. 兰州市区臭氧时空分布特征及气象和环境因子对臭氧的影响[J]. 环境保护科学, 44(2): 78-84. |
| LI Q X, WANG J Y, LIU X R, et al., 2018. Temporal and spatial distribution of ozone and effects of meteorological and environmental factors on ozone in the urban areas of Lanzhou City[J]. Environmental Protection Science, 44(2): 78-84. | |
| [18] | 李霄阳, 李思杰, 刘鹏飞, 等, 2018. 2016年中国城市臭氧浓度的时空变化规律[J]. 环境科学学报, 38(4): 1263-1274. |
| LI X Y, LI S J, LIU P F, et al., 2018. Spatial and temporal variations of ozone concentrations in China in 2016[J]. Acta Scientiae Circumstantiae, 38(4): 1263-1274. | |
| [19] | 李崇, 袁子鹏, 吴宇童, 等, 2017. 沈阳一次严重污染天气过程持续和增强气象条件分析[J]. 环境科学研究, 30(3): 349-358. |
| LI C, YUAN Z P, WU Y T, et al., 2017. Analysis of persistence and intensification mechanism of a heavy haze event in Shenyang[J]. Research of Environment Sciences, 30(3): 349-358. | |
| [20] | 梁从诫, 2006. 2005年: 中国的环境危局与突围[M]. 北京: 社会科学文献出版社: 1-20. |
| LIANG C J, 2006. Crisis and breakthrough of China’s environment (2005)[M]. Beijing: Social Sciences Literature Press: 1-20 | |
| [21] | 刘超, 张恒德, 张天航, 等, 2020. 青岛“上合峰会”期间夜间臭氧增长成因分析[J]. 中国环境科学, 40(8): 3332-3341. |
| LIU C, ZHANG H D, ZHANG T H, et al., 2020. The causes of ozone concentration growth in the night during the “Shanghai Coopetation Organization Summit” in Qingdao[J]. China Environmental Science, 40(8): 3332-3341. | |
| [22] | 陆倩, 王国辉, 冯一淳, 等, 2019. 气象条件对承德市臭氧重污染天气的影响[J]. 生态与农村环境学报, 35(8): 992-999. |
| LU Q, WANG G H, FENG Y C, et al., 2019. The influence of Meteorological conditions on a heavy ozone pollution process in Chengde City[J]. Journal of Ecology and Rural Environment, 35(8): 992-999. | |
| [23] | 孟宪贵, 郭俊建, 韩永清, 2018. ERA5再分析数据适用性初步评估[J]. 海洋气象学报, 38(1): 91-99. |
| MENG X G, GUO J J, HAN Y Q, 2018. Preliminarily assessment of ERA5 reanalysis data[J]. Journal of Marine Meteorology, 38(1): 91-99. | |
| [24] | 沈劲, 何灵, 程鹏, 等, 2019. 珠三角北部背景站臭氧浓度变化特征[J]. 生态环境学报, 28(10): 2006-2011. |
| SHEN J, HE L, CHENG P, et al., 2019. Characteristics of ozone concentration variation in the northern background site of the Pearl River Delta[J]. Ecology and Environmental Sciences, 28(10): 2006-2011. | |
| [25] | 生态环境部, 2018. 环境空气质量标准: GB 3095-2012[S]. 北京: 中国环境科学出版社. |
| MINISTRY OF ECOLOGY AND ENVIRONMENT, 2018. Ambient air quality standards: GB 3095-2012[S]. Beijing: China Environmental Science Press. | |
| [26] | 宋海清, 孙小龙, 李云鹏, 2020. 欧洲中期天气预报中心第五代全球再分析土壤湿度资料在内蒙古的适用性评估[J]. 科学技术与工程, 20(6): 2161-2168. |
| SONG H Q, SUN X L, LI Y P, 2020. Evaluation of ERA5 reanalysis soil moisture over inner Mongolia[J]. Science Technology and Engineering, 20(6): 2161-2168. | |
| [27] | 王玫, 郑有飞, 柳艳菊, 等, 2019. 京津冀臭氧变化特征及与气象要素的关系[J]. 中国环境科学, 39(7): 2689-2698. |
| WANG M, ZHENG Y F, LIU Y J, et al., 2019. Characteristics of ozone and its relationship with meteorological factors in Beijing-Tianjin- Hebei region[J]. China Environmental Science, 39(7): 2689-2698. | |
| [28] | 吴锴, 康平, 王占山, 等, 2017. 成都市臭氧污染特征及气象成因研究[J]. 环境科学学报, 37(11): 4241-4252. |
| WU K, KANG P, WANG Z S, et al., 2017. Ozone temporal variation and its meteorological factors over Chengdu City[J]. Environmental Protection Science, 37(11): 4241-4252. | |
| [29] | 肖建能, 杜国明, 施益强, 等, 2016. 厦门市环境空气污染时空特征及其与气象因素相关分析[J]. 环境科学学报, 36(9): 3363-3371. |
| XIAO J N, DU G M, SHI Y Q, et al., 2016. Spatiotemporal distribution pattern of ambient air pollution and its correlation with meteorological factors in Xiamen City[J]. Acta Scientiae Circumstantiae, 36(9): 3363-3371. | |
| [30] | 徐锟, 刘志红, 何沐全, 等, 2018. 成都市夏季近地面臭氧污染气象特征[J]. 中国环境监测, 34(5): 36-45. |
| XU K, LIU Z H, HE M Q, et al., 2018. Meteorological characteristics of O3 pollution near the ground in summer of Chengdu[J]. Environmental Monitoring in China, 34(5): 36-45. | |
| [31] | 徐祥德, 王寅钧, 赵天良, 等, 2015. 中国大地形东侧霾空间分布“避风港”效应及其“气候调节”影响下的年代际变异[J]. 科学通报, 60(12): 1132-1143. |
| XU X D, WANG Y J, ZHAO T L, et al., 2015. “Harbor” effect of large topography on haze distribution in eastern China and its climate modulation on decadal variations in haze China[J]. Chinese Science Bulletin, 60(12): 1132-1143. | |
| [32] | 颜敏, 黄晓波, 陈丹, 等, 2021. 深圳市臭氧污染特征及其与前体物关系分析[J]. 生态环境学报, 30(4): 763-770. |
| YAN M, HUANG X B, CHEN D, et al., 2021. Characteristics of ozone pollution and relationship between ozone and precursors in Shenzhen[J]. Ecology and Environmental Sciences, 30(4): 763-770. | |
| [33] | 张小曳, 孙俊英, 王亚强, 等, 2013. 我国雾-霾成因及其治理的思考[J]. 科学通报, 58(13): 1178-1187. |
| ZHANG X Y, SUN J Y, WANG Y Q, et al., 2013. Factors contributing to haze and fog in China[J]. Chinese Science Bulletin, 58(13): 1178-1187. | |
| [34] | 中华人民共和国生态环境部, 2021. 2020年中国生态环境状况公报[R]. 北京: 中国环境科学出版社. |
| Ministry of Ecology and Environment of the People's Republic of China, 2021. 2020 Bulletin on the State of China's Ecological Environment[R]. Beijing: China Environmental Science Press. | |
| [35] | 朱景, 袁慧珍, 2019. ERA再分析陆面温度资料在浙江省的适用性[J]. 气象科技, 47(2): 289-298. |
| ZHU J, YUAN H Z, 2019. Applicability of ERA reanalysis data of land surface temperature in Zhejiang Province[J]. Meteorological Science and Technology, 47(2): 289-298. |
| [1] | 闫学军, 郝赛梅, 张荣荣, 秦华, 高素莲, 王锋, 靳宪忠, 孙友敏, 张桂芹. 家居市场挥发性有机物排放成分谱及排放估算[J]. 生态环境学报, 2023, 32(6): 1070-1077. |
| [2] | 许肖云, 饶芝菡, 蒋红斌, 张巍, 陈超, 杨永安, 胡艳丽, 魏海川. 遂宁工业园区夏季VOCs污染特征及其对O3、SOA生成潜势研究[J]. 生态环境学报, 2023, 32(5): 956-968. |
| [3] | 温丽容, 江明, 黄渤, 袁鸾, 周炎, 陆炜梅, 张莹, 刘明, 张力昀. 珠三角典型区域臭氧成因分析与VOCs来源解析——以中山为例[J]. 生态环境学报, 2023, 32(3): 500-513. |
| [4] | 林昕, 段焜瑀, 郭弘, 蒋冬升, 纪晓婷, 王宏. 极端高温形势下福州市臭氧浓度异常升高及影响因素分析[J]. 生态环境学报, 2023, 32(2): 320-330. |
| [5] | 符传博, 丹利, 佟金鹤, 陈红. 海口市区臭氧污染变化特征及潜在源区分析[J]. 生态环境学报, 2023, 32(2): 331-340. |
| [6] | 李程程, 张子蕤, 宋晓萱, 孔娟娟, 韩阳, 阮亚男. 臭氧胁迫对大豆抗氧化代谢与生殖生长的影响[J]. 生态环境学报, 2022, 31(7): 1383-1392. |
| [7] | 陈雪泉, 孔彬, 兰青, 余志铨, 谢银斯, 黄俊毅. 胶黏剂生产行业VOCs组分特征及臭氧生成潜势分析[J]. 生态环境学报, 2022, 31(4): 750-758. |
| [8] | 李颖慧, 郭前进, 闫雨龙, 胡冬梅, 邓萌杰, 彭林. 晋城市环境空气中BTEX变化特征及来源[J]. 生态环境学报, 2022, 31(3): 504-511. |
| [9] | 陈瑶瑶, 廖彤, 汪宇, 沈劲, 翟宇虹, 叶斯琪, 陈多宏, 陈靖扬. 2016—2020年广东省臭氧污染特征[J]. 生态环境学报, 2022, 31(12): 2374-2381. |
| [10] | 廖彤, 熊鑫, 王在华, 杨夏捷, 黄映楠, 冯嘉颖. 世界三大湾区大气污染治理经验及对粤港澳大湾区的启示[J]. 生态环境学报, 2022, 31(11): 2242-2250. |
| [11] | 陈漾, 张金谱, 邱晓暖, 琚鸿, 黄俊. 2021年广州市臭氧污染特征及气象因子影响分析[J]. 生态环境学报, 2022, 31(10): 2028-2038. |
| [12] | 邓慧颖, 陈立新, 余永江, 王宏. 武夷山市臭氧分布特征及其与气象要素关系分析[J]. 生态环境学报, 2021, 30(7): 1428-1435. |
| [13] | 洪莹莹, 陈辰, 保鸿燕, 沈劲. 珠三角西南部春季臭氧来源与敏感性分析[J]. 生态环境学报, 2021, 30(5): 984-994. |
| [14] | 万五星, 张帅, 李洁, 孙旭, 管祖光, 于小红, 杨永宏, 王效科. 河北省城市空气臭氧污染及其对植物伤害的区域差异[J]. 生态环境学报, 2021, 30(11): 2185-2194. |
| [15] | 周映彤, 王岩, 孙铭禹, 伞昱, 姚星州, 赵天宏. 近地层臭氧浓度升高对亲子代大豆叶片抗氧化系统的影响[J]. 生态环境学报, 2021, 30(11): 2195-2203. |
| 阅读次数 | ||||||
|
全文 |
|
|||||
|
摘要 |
|
|||||