生态环境学报 ›› 2021, Vol. 30 ›› Issue (7): 1428-1435.DOI: 10.16258/j.cnki.1674-5906.2021.07.012
邓慧颖1,2,3( ), 陈立新2,4, 余永江1,5, 王宏1,2,5,*()
收稿日期:2021-03-12
出版日期:2021-07-18
发布日期:2021-10-09
通讯作者:
*王宏(1976年生),女,研究员,从事大气环境研究工作。E-mail: wh1575@163.com作者简介:邓慧颖(1993年生),女,助理工程师,硕士,从事大气环境研究与天气预报工作。E-mail: 407343543@qq.com
基金资助:
DENG Huiying1,2,3(), CHEN Lixin2,4, YU Yongjiang1,5, WANG Hong1,2,5,*()
Received:2021-03-12
Online:2021-07-18
Published:2021-10-09
摘要:
武夷山是著名的旅游胜地,同时地理环境复杂,气候资源丰富,也是东亚季风影响敏感区。为科学认识清洁区域的臭氧分布特征及污染的天气学成因,也为进一步开展臭氧污染预警预报和科学治理提供技术支撑,利用2015—2019年武夷山市逐小时污染物浓度监测数据和地面常规气象观测资料,采用统计分析和SPSS相关性分析等方法,对近年来武夷山市臭氧分布特征及其与气象要素的关系进行研究。结果表明,2015—2019年武夷山市臭氧的年评价值(MDA8-90)由110 μg∙m-3增长至133 μg∙m-3,ρ(O3-8 h)超过《环境空气质量标准》(GB 3095—2012)二级标准限值的天数从0 d上升到9 d,O3作为首要污染物占比从48.5%上升为85.1%;同时,首要污染物为PM2.5的天数呈逐年递减趋势,PM2.5的首要污染物天数从2015年的36 d下降到2019年的8 d。春末(4—5月)和初秋(9—10月)是臭氧污染最为严重的季节,80.0%的臭氧超标日集中在这4个月。武夷山市ρ(O3)小时均值分布均呈现单峰型分布,最高值出现在14:00,而后开始下降,最低值出现在07:00。ρ(O3-8 h)与日最高气温、平均风速、太阳日总辐射和日照时数呈显著正相关,相关系数分别为0.370**,0.402**,0.564**,0.565**;与相对湿度呈显著负相关(相关系数为-0.646**),并呈现先升后降的趋势。一些气象要素如高温度和低相对湿度等有助于该区域臭氧浓度的升高,当环境温度>25 ℃、相对湿度<70%时,都有利于对流层空气中臭氧的生成,更容易造成O3浓度超标。此外当风速≤2.0 m∙s-1时,随着风速的增加,ρ(O3-8 h)增大,而当风速>2.0 m∙s-1时,ρ(O3-8 h)随风速的增加呈显著下降趋势。
中图分类号:
邓慧颖, 陈立新, 余永江, 王宏. 武夷山市臭氧分布特征及其与气象要素关系分析[J]. 生态环境学报, 2021, 30(7): 1428-1435.
DENG Huiying, CHEN Lixin, YU Yongjiang, WANG Hong. Characteristics of Ozone Pollution Distribution and Its Correlation Analysis with Meteorological Factors in Wuyishan[J]. Ecology and Environment, 2021, 30(7): 1428-1435.
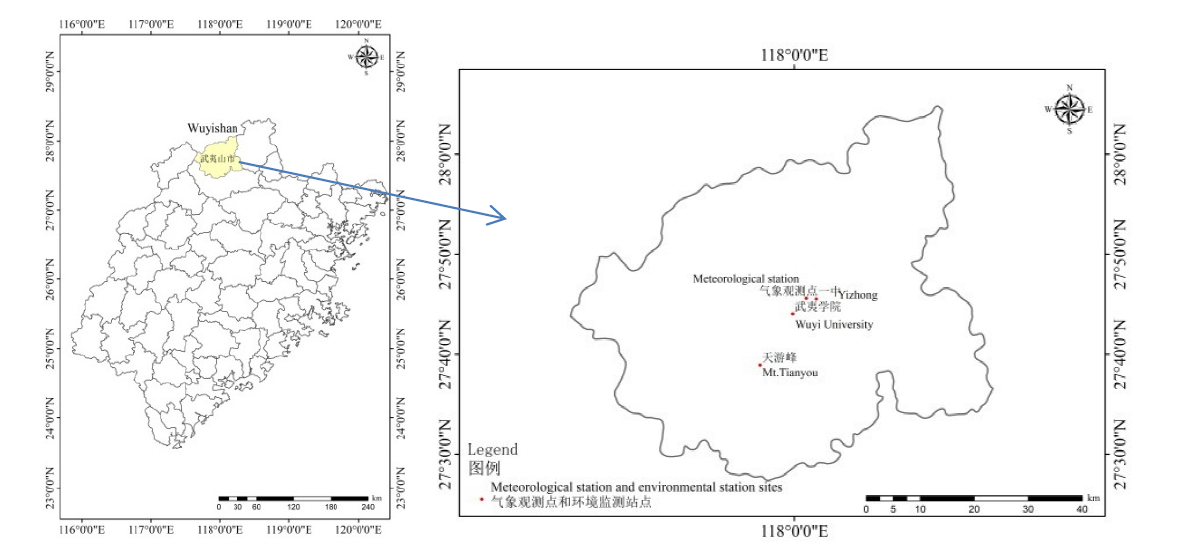
图1 武夷山市气象观测站与环境监测站分布图
Fig. 1 Distribution of meteorological station and environmental monitoring station in Wuyishan City
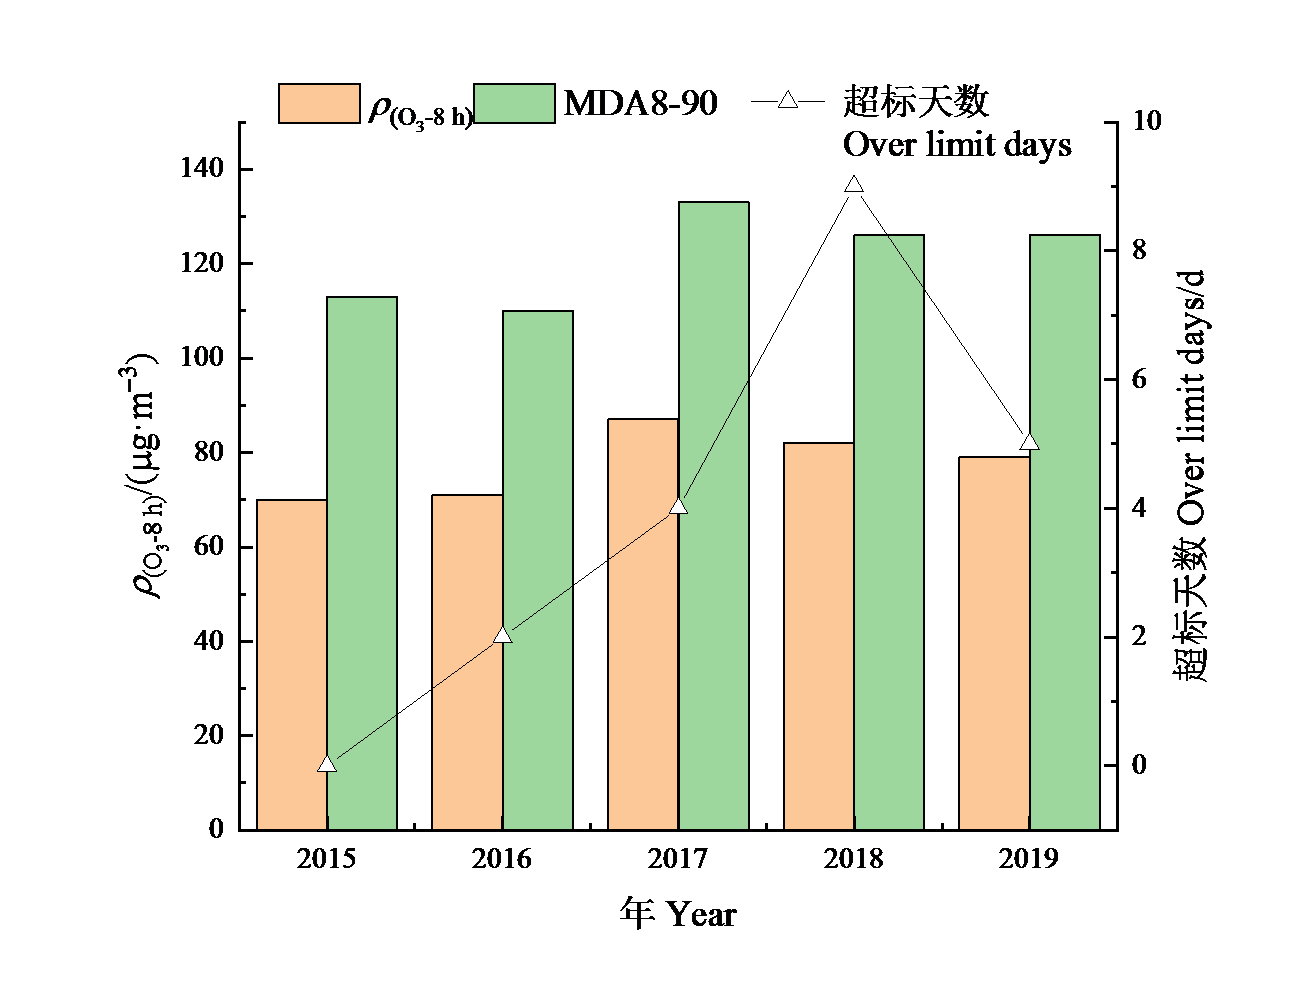
图2 2015—2019年武夷山市ρ(O3-8 h)年平均值、MDA8-90 对比图
Fig. 2 Annual mean of ρ(O3-8 h) and MDA8-90 in Wuyishan City from 2015 to 2019
| 年份 Year | 气溫 Temperature/ ℃ | 距平 Anomaly/ ℃ | 评价 Valuation | 降水 Precipitation/ mm | 距平百分率 Anomalous percentage/% | 评价 Valuation | 日照 Sunshine duration/ h | 距平 Anomaly/ h | 评价 Valuation |
|---|---|---|---|---|---|---|---|---|---|
| 2015 | 18.9 | 0.7 | 偏高 High | 2501.2 | 29.0 | 显著偏多 Significantly more | 1187.8 | -441.7 | 异常偏少 Abnormally less |
| 2016 | 19.2 | 0.9 | 显著偏高 Significantly high | 2430.9 | 26.0 | 显著偏多 Significantly more | 1518.9 | -110.6 | 正常 Normal |
| 2017 | 19.3 | 1.0 | 显著偏高 Significantly high | 1853.9 | -4.0 | 正常 Normal | 1758.0 | 128.5 | 正常 Normal |
| 2018 | 19.3 | 1.0 | 显著偏高 Significantly high | 1601.5 | -17.0 | 偏少 Less | 1745.0 | 115.5 | 正常 Normal |
| 2019 | 19.4 | 1.1 | 异常偏高 Abnormally high | 2281.1 | 18.0 | 偏多 More | 1578.7 | -50.8 | 正常 Normal |
表1 2015—2019年武夷山市气候评价表
Table 1 Climate assessment in Wuyishan City from 2015 to 2019
| 年份 Year | 气溫 Temperature/ ℃ | 距平 Anomaly/ ℃ | 评价 Valuation | 降水 Precipitation/ mm | 距平百分率 Anomalous percentage/% | 评价 Valuation | 日照 Sunshine duration/ h | 距平 Anomaly/ h | 评价 Valuation |
|---|---|---|---|---|---|---|---|---|---|
| 2015 | 18.9 | 0.7 | 偏高 High | 2501.2 | 29.0 | 显著偏多 Significantly more | 1187.8 | -441.7 | 异常偏少 Abnormally less |
| 2016 | 19.2 | 0.9 | 显著偏高 Significantly high | 2430.9 | 26.0 | 显著偏多 Significantly more | 1518.9 | -110.6 | 正常 Normal |
| 2017 | 19.3 | 1.0 | 显著偏高 Significantly high | 1853.9 | -4.0 | 正常 Normal | 1758.0 | 128.5 | 正常 Normal |
| 2018 | 19.3 | 1.0 | 显著偏高 Significantly high | 1601.5 | -17.0 | 偏少 Less | 1745.0 | 115.5 | 正常 Normal |
| 2019 | 19.4 | 1.1 | 异常偏高 Abnormally high | 2281.1 | 18.0 | 偏多 More | 1578.7 | -50.8 | 正常 Normal |
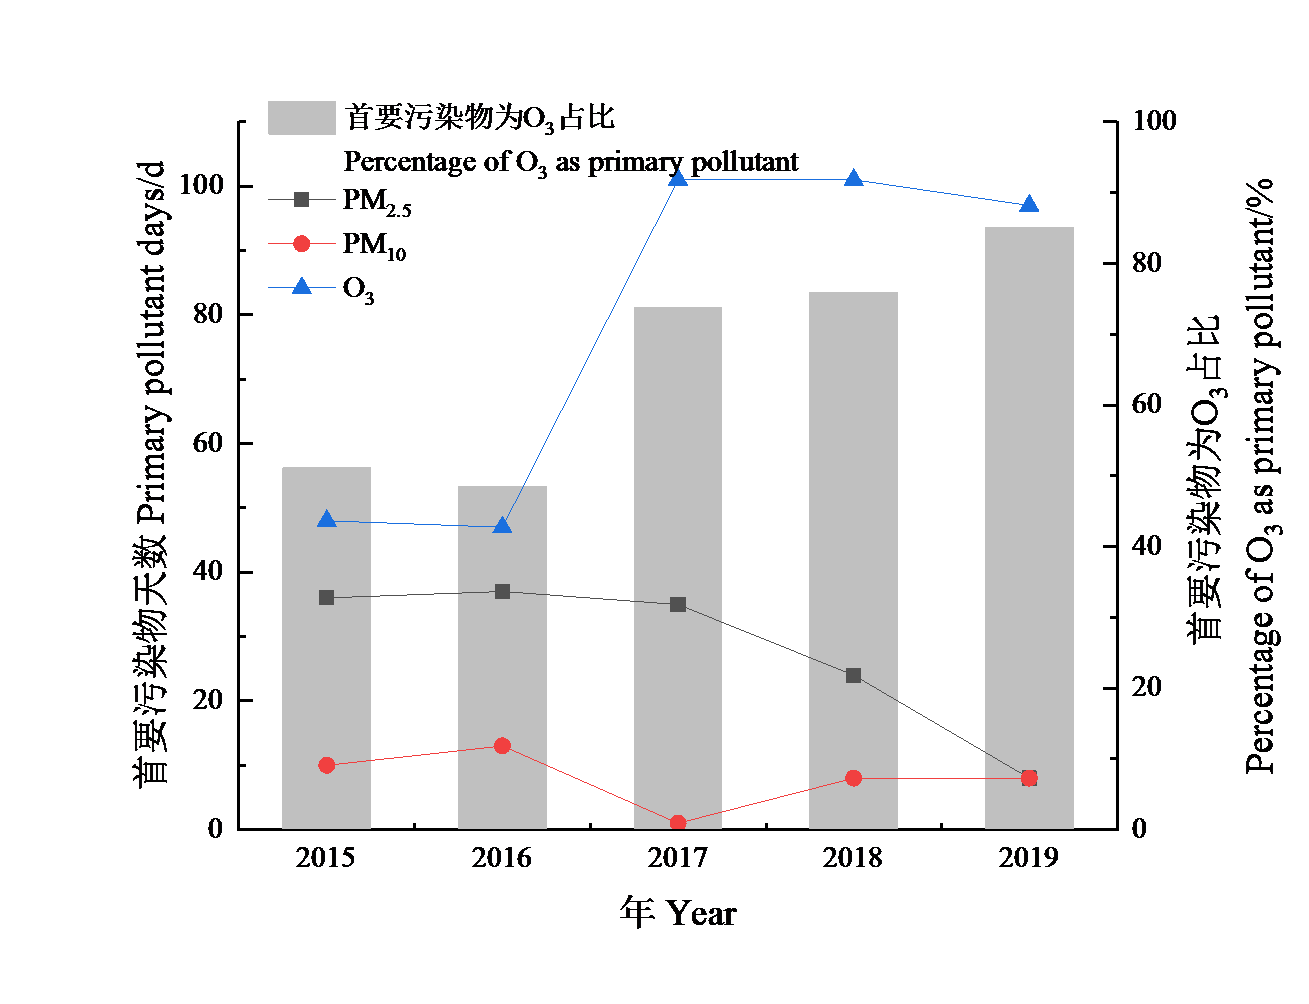
图3 2015—2019年武夷山市不同首要污染物出现天数及首要污染物为O3占比
Fig. 3 Number of days of different primary pollutants appeared and primary pollutants proportion of O3 in Wuyishan City from 2015 to 2019
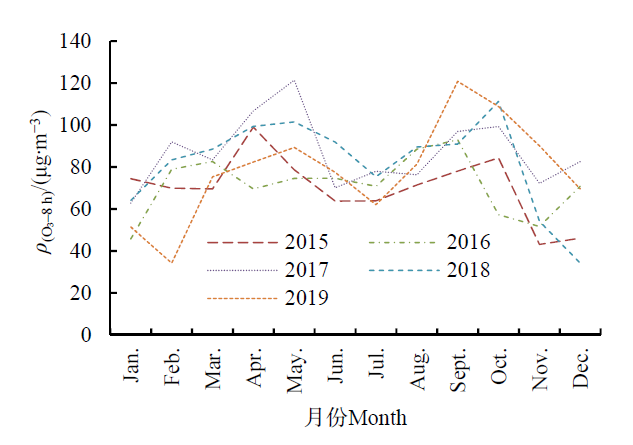
图4 2015—2019年武夷山市ρ(O3-8 h)月均变化
Fig. 4 Monthly variation of ρ(O3-8 h) in Wuyishan City from 2015 to 2019
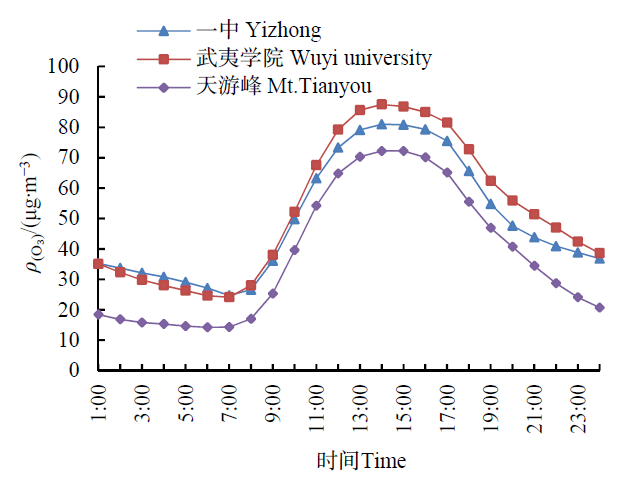
图5 武夷山市ρ(O3)日变化图
Fig. 5 Daily variation of ρ(O3) in Wuyishan City
| 气象要素 Meteorological factors | 日平均气压 Daily mean air pressure/ hPa | 日平均气温 Daily mean temperature/ ℃ | 日最高气温 Daily maximum temperature/ ℃ | 日平均相对湿度 Daily mean relative humidity/ % | 日平均风速 Daily mean wind speed/ (m∙s-1) | 日降水量 Daily precipitation/ mm | 太阳日总辐射 Daily solar radiation/ (MJ∙m-2) | 日照时数 Sunshine duration/ h |
|---|---|---|---|---|---|---|---|---|
| ρ(O3-8h) | 0.032 | 0.194** | 0.370** | -0.646** | 0.402** | -0.229** | 0.564** | 0.565** |
表2 气象因素与ρ(O3-8 h)相关性
Table 2 Correlation coefficient between meteorological factors and ρ(O3-8 h)
| 气象要素 Meteorological factors | 日平均气压 Daily mean air pressure/ hPa | 日平均气温 Daily mean temperature/ ℃ | 日最高气温 Daily maximum temperature/ ℃ | 日平均相对湿度 Daily mean relative humidity/ % | 日平均风速 Daily mean wind speed/ (m∙s-1) | 日降水量 Daily precipitation/ mm | 太阳日总辐射 Daily solar radiation/ (MJ∙m-2) | 日照时数 Sunshine duration/ h |
|---|---|---|---|---|---|---|---|---|
| ρ(O3-8h) | 0.032 | 0.194** | 0.370** | -0.646** | 0.402** | -0.229** | 0.564** | 0.565** |
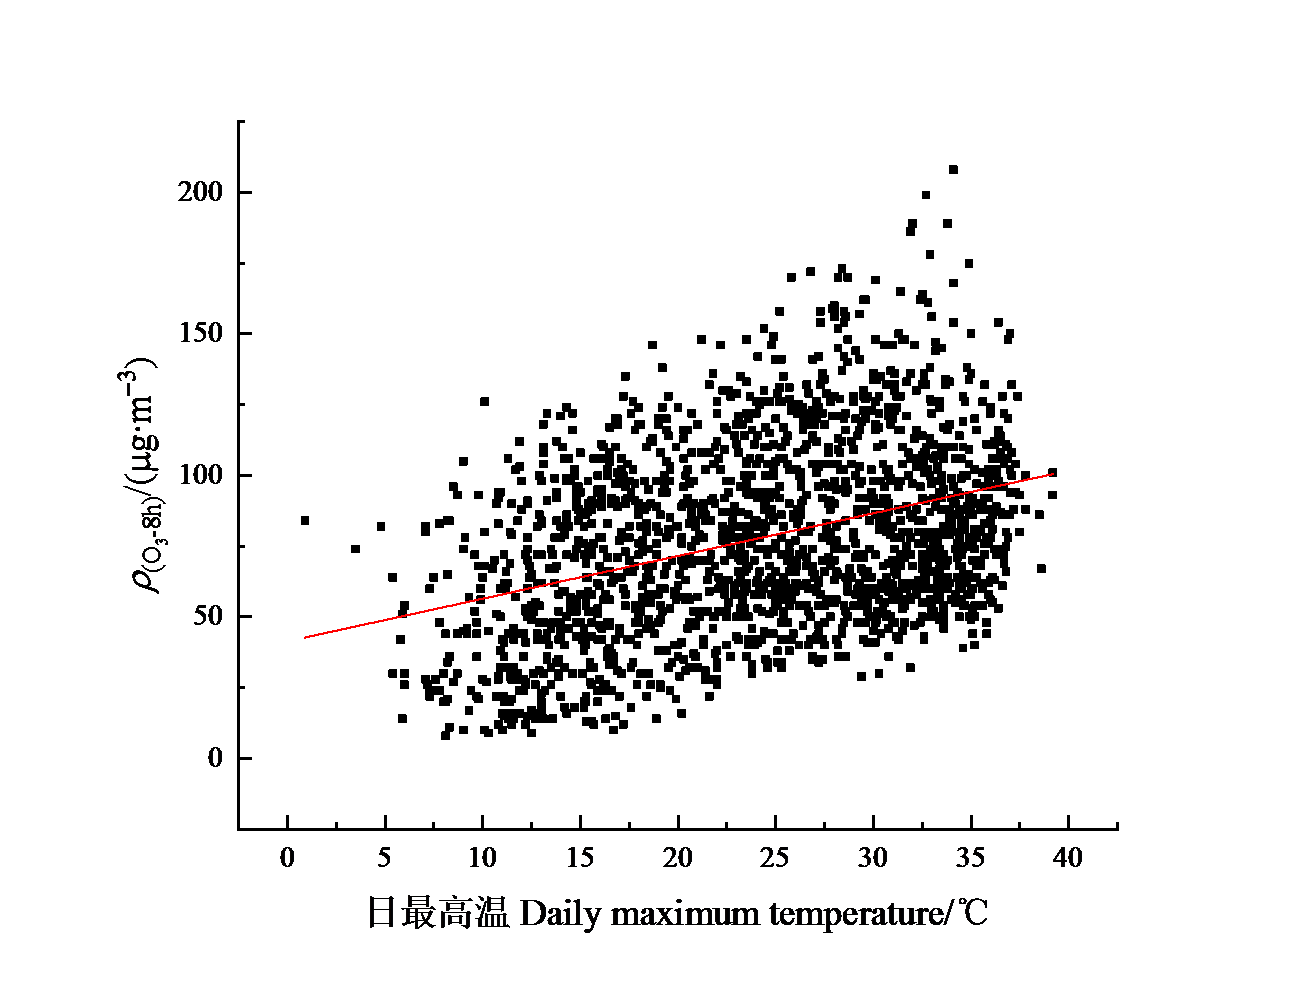
图6 日最高气温与ρ(O3-8 h)拟合关系散点图
Fig. 6 Scatter diagram of fitting relationships between daily maximum temperature and ρ(O3-8 h)
| 日最高气温 Daily maximum temperature/℃ | ρ(O3-8 h)/ (μg∙m-3) | ρ(O3-8 h)超标率 Over limit rate of ρ(O3-8 h)/% | 日平均相对湿度 Daily mean relative humidity/% | ρ(O3-8 h)/ (μg∙m-3) | ρ(O3-8 h)超标率 Over limit rate of ρ(O3-8 h)/% | 日平均风速 Daily mean wind speed/(m∙s-1) | ρ(O3-8 h)/ (μg∙m-3) | ρ(O3-8 h)超标率 Over limit rate of ρ(O3-8 h)/% |
|---|---|---|---|---|---|---|---|---|
| <10 | 47.8 | 0.0 | <45 | 116.8 | 0.0 | <0.5 | 0.0 | 0.0 |
| 10‒15 | 56.0 | 0.0 | 45‒50 | 119.3 | 14.4 | 0.5‒1.0 | 48.1 | 0.0 |
| 15‒20 | 69.3 | 0.0 | 50‒55 | 118.1 | 33.3 | 1.0‒1.5 | 81.0 | 33.0 |
| 20‒25 | 79.0 | 0.0 | 55‒60 | 121.4 | 33.3 | 1.5‒2.0 | 90.5 | 62.0 |
| 25‒30 | 87.9 | 38.1 | 60‒65 | 108.3 | 9.5 | 2.0‒2.5 | 88.9 | 5.0 |
| 30‒35 | 88.2 | 61.9 | 65‒70 | 97.7 | 9.5 | 2.5‒3.0 | 88.8 | 0.0 |
| >35 | 87.3 | 0.0 | >70 | 55.8 | 0.0 | >3.0 | 95.3 | 0.0 |
表3 2015—2019年武夷山市不同日最高温、日平均相对湿度及日平均风速下ρ(O3-8 h)超标率和浓度均值
Table 3 Over-limit ratio of ρ(O3-8 h) and ρ(O3-8 h) in different daily maximum temperature, relative humidity, average wind speed in Wuyishan City from 2015 to 2019
| 日最高气温 Daily maximum temperature/℃ | ρ(O3-8 h)/ (μg∙m-3) | ρ(O3-8 h)超标率 Over limit rate of ρ(O3-8 h)/% | 日平均相对湿度 Daily mean relative humidity/% | ρ(O3-8 h)/ (μg∙m-3) | ρ(O3-8 h)超标率 Over limit rate of ρ(O3-8 h)/% | 日平均风速 Daily mean wind speed/(m∙s-1) | ρ(O3-8 h)/ (μg∙m-3) | ρ(O3-8 h)超标率 Over limit rate of ρ(O3-8 h)/% |
|---|---|---|---|---|---|---|---|---|
| <10 | 47.8 | 0.0 | <45 | 116.8 | 0.0 | <0.5 | 0.0 | 0.0 |
| 10‒15 | 56.0 | 0.0 | 45‒50 | 119.3 | 14.4 | 0.5‒1.0 | 48.1 | 0.0 |
| 15‒20 | 69.3 | 0.0 | 50‒55 | 118.1 | 33.3 | 1.0‒1.5 | 81.0 | 33.0 |
| 20‒25 | 79.0 | 0.0 | 55‒60 | 121.4 | 33.3 | 1.5‒2.0 | 90.5 | 62.0 |
| 25‒30 | 87.9 | 38.1 | 60‒65 | 108.3 | 9.5 | 2.0‒2.5 | 88.9 | 5.0 |
| 30‒35 | 88.2 | 61.9 | 65‒70 | 97.7 | 9.5 | 2.5‒3.0 | 88.8 | 0.0 |
| >35 | 87.3 | 0.0 | >70 | 55.8 | 0.0 | >3.0 | 95.3 | 0.0 |
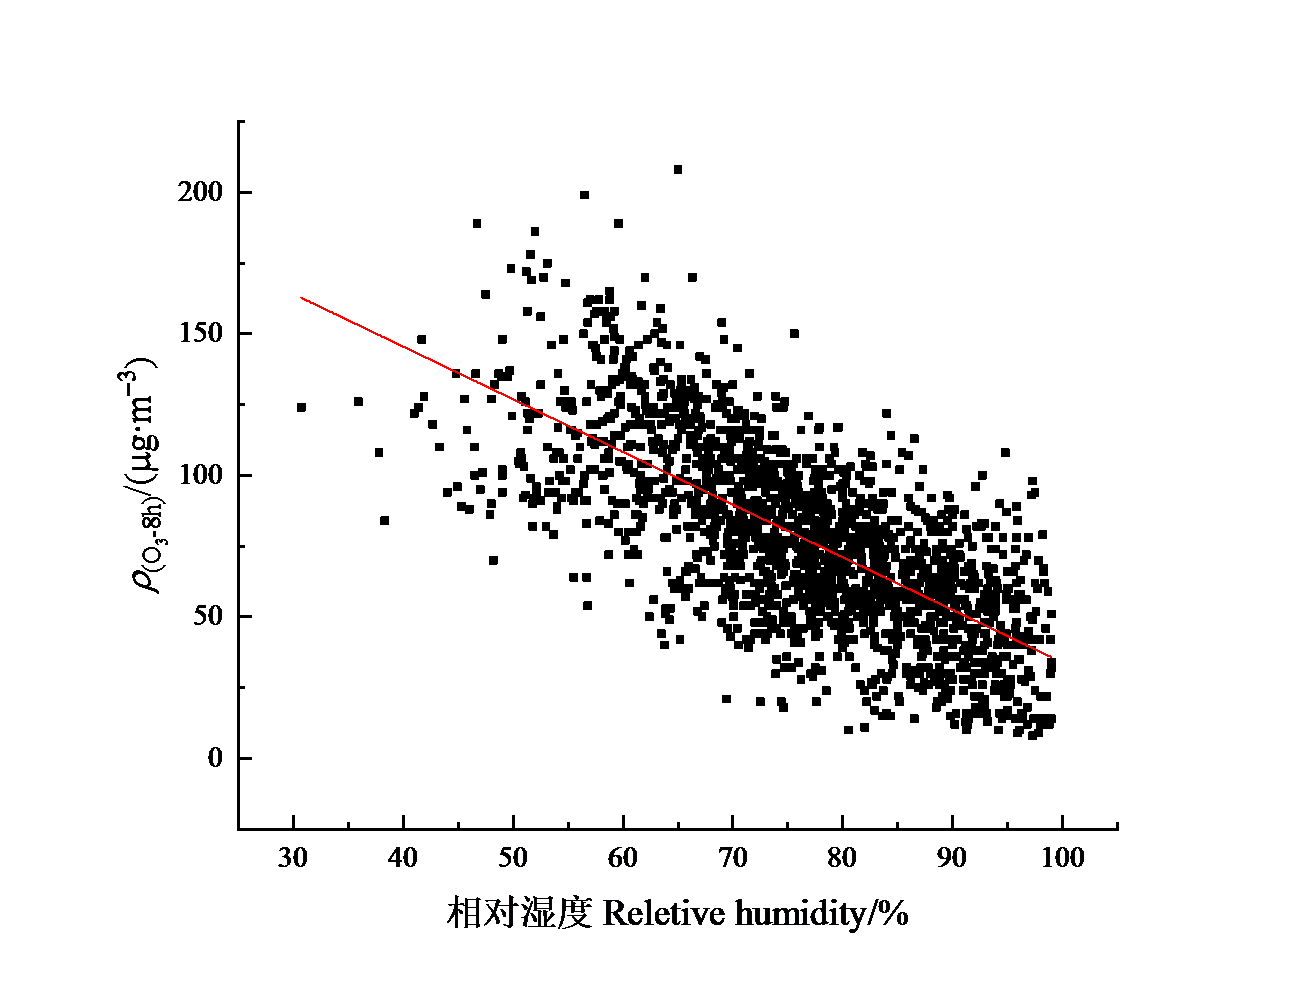
图7 相对湿度与ρ(O3-8 h)拟合关系散点图
Fig. 7 Scatter diagram of fitting relationships between relative humidity and ρ(O3-8 h)
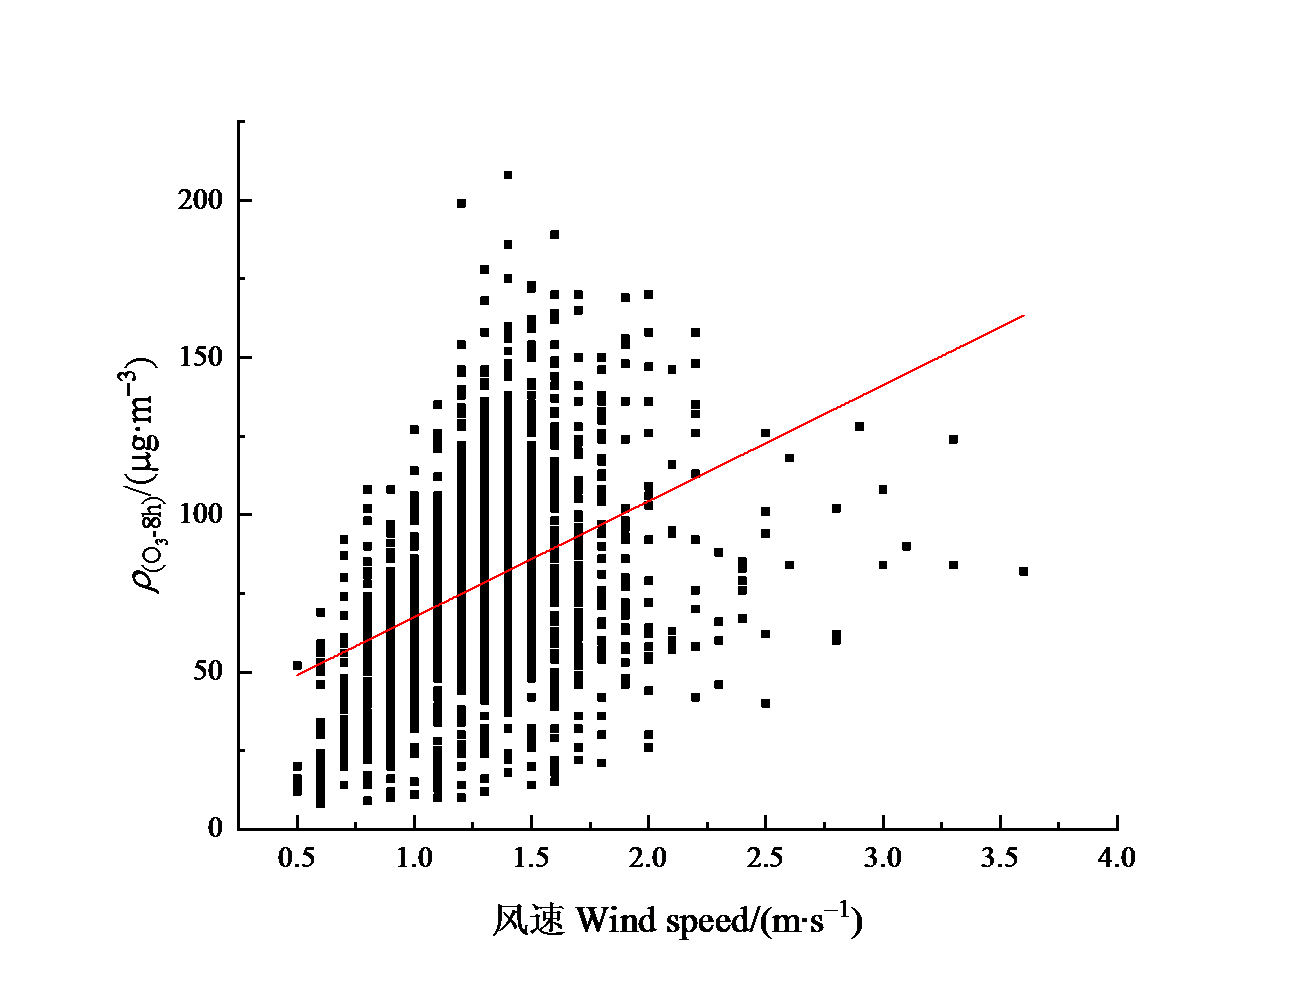
图8 平均风速与ρ(O3-8 h)拟合关系散点图
Fig. 8 Scatter diagram of fitting relationships between average wind velocity and ρ(O3-8 h)
| [1] | DRAXLER, ROLAND R, 2000. Meteorological factors of ozone predictability at Houston, Texas[J]. Journal of the Air & Waste Management Association, 50(2): 259-271. |
| [2] | GVOZDIC V, KOVAC-ANDRIC E, BRANA J, 2011. Influence of meteorological factors NO2, SO2, CO and PM10 on the concentration of O3 in the urban atmosphere of Eastern Croatia[J]. Environmental Modeling & Assessment, 16(5): 491-501. |
| [3] |
NEUMAN J A, GAO R S, FAHEY D W, et al., 2001. In situ measurements of HNO3, NOy, NO, and O3 in the lower stratosphere and upper troposphere[J]. Atmospheric Environment, 35(33): 5789-5797.
DOI URL |
| [4] |
WILLIAM T B, ALSING J, MORTLOCK D J, et al., 2018. Evidence for a continuous decline in lower stratospheric ozone offsetting ozone layer recovery[J]. Atmospheric Chemistry and Physics, 18(2): 1-36.
DOI URL |
| [5] | 安俊琳, 王跃思, 孙扬, 2009. 气象因素对北京臭氧的影响[J]. 生态环境学报, 18(3): 944-951. |
| AN J L, WANG S Y, SUN Y, 2009. Assessment of ozone variations and meteorological effects in Beijing[J]. Ecology and Environmental Sciences, 18(3): 944-951. | |
| [6] | 杜鹏瑞, 杜睿, 任伟珊, 2016. 城市大气颗粒物毒性效应及机制的研究进展[J]. 中国环境科学, 36(9): 2815-2827. |
| DU P R, DU R, REN W S, 2016. Research progress on toxicological characteristics and mechanisms of urban atmospheric particulate matters[J]. China Environmental Science, 36(9): 2815-2827. | |
| [7] | 符传博, 丹利, 徐文帅, 等, 2020. 2014—2019年三亚市臭氧浓度变化特征[J]. 生态环境学报, 29(10): 106-111. |
| FU C B, DAN L, XU W S, et al., 2020. Variation of O3 concentration in Sanya city from 2014 to 2019 [J]. Ecology and Environmental Sciences, 29(10): 106-111. | |
| [8] | 韩梦鑫, 帕丽达·牙合甫, 王镜然, 2018. 乌鲁木齐市近地面O3与前体物及颗粒物相关性分析[J]. 环境保护科学, 44(4): 21-26. |
| HAN M X, PALIDA Y, WANG J R, 2018. Correlation analysis of surface ozone with precursors and particles in Urumqi[J]. Environmental Protection Science, 44(4): 21-26. | |
| [9] | 韩余, 周国兵, 陈道劲, 等, 2020. 重庆市臭氧污染及其气象因子预报方法对比研究[J]. 气象与环境学报, 36(4): 59-66. |
| HAN Y, ZHOU G B, CHEN J D, et al., 2020. Characteristics of ozone pollution and forcasting technique based on meteorological factors in Chongqing[J]. Journal of Meteorology and Environment, 36(4): 59-66. | |
| [10] | 侯雪伟, 朱彬, 王东东, 2012. 东亚季风转换对西北太平洋近地面O3春季高值的影响[J]. 气候与环境研究, 17(3): 303-314. |
| HOU X W, ZHU B, WANG D D, 2012. The impacts of East Asia monsoon’s conversion on the surface ozone spring maximum in the Northwestern Pacific Region[J]. Climatic and Environmental Research, 17(3): 303-314. | |
| [11] | 李春玉, 陈素文, 葛鹏, 等, 2020. 常州市大气PM2.5和臭氧复合污染特征及来源分析研究[J]. 环境科学与管理, 45(4): 138-143. |
| LI C Y, CHEN S W, GE P, et al., 2020. Complex Pollution Characteristics and Source Analysis of Atmospheric PM2.5and Ozone in Changzhou[J]. Environmental Science and Management, 45(4): 138-143. | |
| [12] | 李顺姬, 李红, 陈妙, 等, 2018. 气象因素对西安市西南城区大气中臭氧及其前体物的影响[J]. 气象与环境学报, 34(4): 59-67. |
| LI S J, LI H, CHEN M, et al., 2018. Effect of meteorological parameters on ozone and its precursors in the southwest urban area of Xi′an[J]. Journal of Meteorology and Environment, 34(4): 59-67. | |
| [13] | 林丽钦, 陈婧瑜, 吴明言, 等, 2020. 2017—2018年闽近地面臭氧污染对人群健康的影响[J]. 福建医药杂志, 42(1): 141-145. |
| LIN L Q, CHEN J Y, WU M Y, et al., 2020. Human health impact of exposure to surface ozone pollution in Fujian Province during 2017-2018 [J]. Fujian Medical Journal, 42(1): 141-145. | |
| [14] | 刘超, 徐冉, 张天航, 等, 2020. 青岛“上合峰会”保障期间臭氧污染特征及其来源贡献分析[J]. 气象与环境科学, 43(3): 51-58. |
| LIU C, XU R, ZHANG T H, et al., 2020. Analysis of ozone pollution characteristics and its sources during the Shanghai cooperation organization summit in Qingdao[J]. Meteorological and Environmental Sciences, 43(3): 51-58. | |
| [15] | 刘晶淼, 丁裕国, 黄永德, 等, 2003. 太阳紫外辐射强度与气象要素的相关分析[J]. 高原气象, 22(1): 45-50. |
| LIU J M, DING Y G, HUANG Y D, et al., 2003. Correlation analyses between intensity of solar ultraviolet radiation and meteological elements[J]. Plateau Meteorology, 22(1): 45-50. | |
| [16] | 漏嗣佳, 朱彬, 廖宏, 2010. 中国地区臭氧前体物对地面臭氧的影响[J]. 大气科学学报, 33(4): 451-459. |
| LOU S J, ZHU B, LIAO H, 2010. Impacts of O3 precursor on surface O3 concentration over China[J]. Transactions Atmospheric Sciences, 33(4): 451-459. | |
| [17] | 潘本锋, 程麟钧, 王建国, 等, 2016. 京津冀地区臭氧污染特征与来源分析[J]. 中国环境监测, 32(5): 17-23. |
| PAN B F, CHENG L J, WANG J G, et al., 2016. Characteristics and source attribution of ozone pollution in Beijing-Tianjin-Hebei Region[J]. Environmental Monitoring in China, 32(5): 17-23. | |
| [18] | 齐艳杰, 于世杰, 杨健, 等, 2020. 河南省臭氧污染特征与气象因子影响分析[J]. 环境科学, 41(2): 587-599. |
| QI Y J, YU S J, YANG J, et al., 2020. Analysis of characteristics and meteorological influence factors of ozone pollution in Henan Province[J]. Environmental Science, 41(2): 587-599. | |
| [19] | 沈劲, 何灵, 程鹏, 等, 2019. 珠三角北部背景站臭氧浓度变化特征[J]. 生态环境学报, 28(10): 2006-2011. |
| SHEN J, HE L, CHENG P, et al., 2019. Characteristics of ozone concentration variation in the northern background site of the Pearl River Delta[J]. Ecology and Environmental Sciences, 28(10): 2006-2011. | |
| [20] | 苏彬彬, 2013. 华东森林及高山背景区域臭氧变化特征及影响因素[J]. 环境科学, 34(7): 2519-2525. |
| SU B B, 2013. Characteristics and impact factors of O3 concentrations in mountain background rigion of East China[J]. Environmental Sciences, 34(7): 2519-2525. | |
| [21] | 苏彬彬, 许椐洋, 张若宇, 等, 2014. 区域传输对华东森林及高山背景点位大气污染物浓度的影响[J]. 环境科学, 35(8): 2871-2877. |
| SU B B, XU J Y, ZHANG R Y, et al., 2014. Influence of atm ospheric transport on air pollutant levels at a mountain background site of East China[J]. Environmental Sciences, 35(8): 2871-2877. | |
| [22] | 王宏, 蒋东升, 谢祖欣, 等, 2018. 福建省近地层臭氧时空分布与超标天气成因[J]. 中低纬山地气象, 42(1): 1-6. |
| WANG H, JIANG D S, XIE Z X, et al., 2018. The spatical and temporal distribution and synoptic causes of surface layer ozone in Fujian Province[J]. Mid-low Latitude Mountain Meteorology, 42(1): 1-6. | |
| [23] | 谢祖欣, 冯宏芳, 林文, 等, 2020. 气象条件对福州市夏季臭氧(O3)浓度的影响研究[J]. 生态环境学报, 29(11): 2251-2261. |
| XIE Z X, FENG H F, LIN W, et al., 2020. Meteorological factors impact on summertime ozone (O3) concentration in Fuzhou[J]. Ecology and Environmental Sciences, 29(11): 2251-2261. | |
| [24] | 严茹莎, 陈敏东, 高庆先, 等, 2013. 北京夏季典型臭氧污染分布特征及影响因子[J]. 环境科学研究, 26(1): 43-49. |
| YAN R S, CHEN M D, GAO Q X, et al., 2013. Characteristics of typical ozone pollution distribution and impact factors in Beijing in summer[J]. Research of Environmental, 26(1): 43-49. | |
| [25] | 叶听听, 江飞, 易福金, 等, 2017. 长三角地区春季臭氧污染特征及其对冬小麦产量的影响[J]. 环境科学研究, 30(7): 991-1000. |
| YE T T, JIANG F, YI F J, et al., 2017. Characteristics of ozone Pollution and its impact on winter wheat yield in the Yangtze River Delta in spring[J]. Research of Environmental Sciences, 30(7): 991-1000. | |
| [26] | 赵伟, 高博, 刘明, 等, 2019. 气象因素对香港地区臭氧污染的影响[J]. 环境科学, 40(1): 57-68. |
| ZHAO W, GAO B, LIU M, et al., 2019. Impact of meteorological factors on the ozone pollution in Hongkong[J]. Environmental Science, 40(1): 57-68. | |
| [27] | 中华人民共和国环境保护部, 2012. 环境空气质量标准: GB 3095—2012 [S]. 北京: 中国环境科学出版社. |
| Ministry of Environmental Protection of the People's Republic of China, 2012. Ambient air quality standards: GB 3095—2012 [S]. Beijing: China Environmental Science Press. | |
| [28] | 中华人民共和国环境保护部, 2012. 环境空气质量指数(AQI)技术规定(试行): HJ 633— 2012 [S]. 北京: 中国环境科学出版社. |
| Ministry of Environmental Protection of the People's Republic of China, 2012. Technical Regulation on Ambient Air Quality Index (on trial): HJ 633—2012 [S]. Beijing: China Environmental Science Press. | |
| [29] | 中华人民共和国环境保护部, 2013. 环境空质量评价技术规范(试行): HJ 663— 2013 [S]. 北京: 中国环境科学出版社. |
| Ministry of Environmental Protection of the People's Republic of China, 2013. Technical Specifications for Environmental Air Quality Assessment (on trial): HJ 663—2013 [S]. Beijing: China Environmental Science Press. | |
| [30] | 邹旭东, 蔡福, 王笑影, 等, 2020. 辽宁省臭氧质量浓度变化研究[J]. 生态环境学报, 29(9): 1830-1838. |
| ZOU X D, CAI F, WANG X Y, et al., 2020. Study on the change of ozone concentration in Liaoning province[J]. Ecology and Environmental Sciences, 29(9): 1830-1838. | |
| [31] | 朱毓秀, 徐家骝, 1994. 近地面臭氧污染过程和相关气象因子的分析[J]. 环境科学研究, 7(6): 13-18. |
| ZHU Y X, XU J L, 1994. Ozone pollution process in the Lower atmosphere and the meteorological factors concerned[J]. Research of Environmental Sciences, 7(6): 13-18. |
| [1] | 董智今, 张呈春, 展秀丽, 张维福. 宁夏河东沙地生物土壤结皮及其下伏土壤养分的空间分布特征[J]. 生态环境学报, 2023, 32(5): 910-919. |
| [2] | 刘紫薇, 葛继稳, 王月环, 杨诗雨, 姚东, 谢金林. 大九湖泥炭湿地甲烷通量变异特征及影响因素[J]. 生态环境学报, 2023, 32(4): 706-714. |
| [3] | 符传博, 丹利, 佟金鹤, 陈红. 海口市区臭氧污染变化特征及潜在源区分析[J]. 生态环境学报, 2023, 32(2): 331-340. |
| [4] | 孙建波, 畅文军, 李文彬, 张世清, 李春强, 彭明. 香蕉不同生育期根际微生物生物量及土壤酶活的变化研究[J]. 生态环境学报, 2022, 31(6): 1169-1174. |
| [5] | 谢晨敏, 隆楚月, 黎大宁, 朱春友, 彭先芝, 孙毓鑫, 罗孝俊, 张黎, 麦碧娴. 南海永兴岛和东岛土壤中微塑料和卤代阻燃剂的分布特征[J]. 生态环境学报, 2022, 31(5): 1008-1014. |
| [6] | 陈漾, 张金谱, 邱晓暖, 琚鸿, 黄俊. 2021年广州市臭氧污染特征及气象因子影响分析[J]. 生态环境学报, 2022, 31(10): 2028-2038. |
| [7] | 邓玉娇, 王捷纯, 徐杰, 吴永琪, 陈靖扬. 广东省植被固碳量时空变化及气象贡献率研究[J]. 生态环境学报, 2022, 31(1): 1-8. |
| [8] | 何瑞, 蒋然, 杨芳, 张心凤, 林键銮, 朱小平, 彭松耀. 茂名近岸海域中、小型浮游动物群落特征及其与环境因子的关系[J]. 生态环境学报, 2022, 31(1): 142-150. |
| [9] | 许冬雪, 李兴, 王勇, 勾芒芒. 冰封期乌梁素海不同形态氮、磷和叶绿素a的空间分布特征及其响应关系[J]. 生态环境学报, 2021, 30(9): 1855-1864. |
| [10] | 袁伟皓, 王华, 夏玉宝, 曾一川, 邓燕青, 李媛媛, 张心悦. 基于GAM模型的鄱阳湖叶绿素a与水质因子相关性分析[J]. 生态环境学报, 2021, 30(8): 1716-1723. |
| [11] | 李海萍, 李光一, 万华伟, 李利平. 基于矩阵分析法的鸟类与哺乳动物物种丰富度空间差异研究——以新疆为例[J]. 生态环境学报, 2021, 30(7): 1333-1341. |
| [12] | 侯素霞, 张鉴达, 李静. 上海市大气污染物时空分布及其相关性因子分析[J]. 生态环境学报, 2021, 30(6): 1220-1228. |
| [13] | 蔡杨, 李伟, 左雪燕, 崔丽娟, 雷茵茹, 赵欣胜, 翟夏杰, 李晶, 潘旭. 盐城滨海湿地土壤多环芳烃分布特征及影响因素[J]. 生态环境学报, 2021, 30(6): 1249-1259. |
| [14] | 马炳鑫, 靖娟利, 徐勇, 何宏昌, 刘兵. 2000—2019年滇黔桂岩溶区植被NPP时空变化及与气候变化的关系研究[J]. 生态环境学报, 2021, 30(12): 2285-2293. |
| [15] | 郝丽虹, 刘桂青, 张世晨, 苗宇萍. 城市加油站场地典型有机污染物空间分布特征[J]. 生态环境学报, 2021, 30(11): 2175-2184. |
| 阅读次数 | ||||||||||||||||||||||||||||||||||||||||||||||||||
|
全文 520
|
|
|||||||||||||||||||||||||||||||||||||||||||||||||
|
摘要 250
|
|
|||||||||||||||||||||||||||||||||||||||||||||||||