生态环境学报 ›› 2022, Vol. 31 ›› Issue (10): 2028-2038.DOI: 10.16258/j.cnki.1674-5906.2022.10.011
陈漾1( ), 张金谱1, 邱晓暖1, 琚鸿1, 黄俊2
收稿日期:2022-06-08
出版日期:2022-10-18
发布日期:2022-12-09
作者简介:陈漾(1990年生),女,工程师,硕士,主要环境空气质量综合分析。E-mail: belindaychen@163.com
基金资助:
CHEN Yang1(), ZHANG Jinpu1, QIU Xiaonuan1, JU Hong1, HUANG Jun2
Received:2022-06-08
Online:2022-10-18
Published:2022-12-09
摘要:
为深入认识臭氧(O3)污染特征及气象学成因,也为O3污染预警预报和防控治理提供技术支撑,利用2021年广州市环境空气质量自动监测数据和气象观测资料,综合探讨了广州市O3污染特征及气象因子和地面天气形势的影响,并对1次O3持续中度污染过程进行分析。结果表明,O3为2021年广州市最主要的大气污染物,O3污染时间提前。O3日最大8 h滑动平均值(O3-8 h)与日照时数和气温均呈显著正相关,相关系数分别为0.643**和0.332**,与风速、降水量、气压和相对湿度均表现为显著负相关,相关系数分别为-0.355**、-0.239**、-0.208**和-0.139**。O3-8 h与日照时数/风速比值的相关系数为0.745**,高于O3-8 h与任一单项气象因子的相关系数,其线性拟合方程(O3-8 h为因变量,日照时数/风速比值为自变量)的斜率随着上午07:00 NO2浓度区间的升高呈现先增后减的变化。O3-8 h与风速在干、湿季的相关系数分别为-0.514**和-0.172*,与相对湿度在干、湿季的相关系数分别为0.041和-0.469**,季节差异较大。O3-8 h随相对湿度的增大呈先升后降的变化,当相对湿度大于80%,O3-8 h明显下降。造成2021年O3污染主要有均压场、弱低压槽和弱高压脊这3种地面天气形势,其中受均压场控制时O3超标天数最多且O3-8 h最高。广州市O3污染具有持续性和区域性特征。4月30日—5月1日广州市出现的连续两天O3中度污染为地面低风速、日照时间长、风场持续转变等因素造成O3聚集,再加上夜间逆温造成前体物累积与白天辐射增强加速O3生成综合作用的结果。
中图分类号:
陈漾, 张金谱, 邱晓暖, 琚鸿, 黄俊. 2021年广州市臭氧污染特征及气象因子影响分析[J]. 生态环境学报, 2022, 31(10): 2028-2038.
CHEN Yang, ZHANG Jinpu, QIU Xiaonuan, JU Hong, HUANG Jun. Characteristic of Ozone Pollution and Meteorological Factors Analysis in Guangzhou in 2021[J]. Ecology and Environment, 2022, 31(10): 2028-2038.
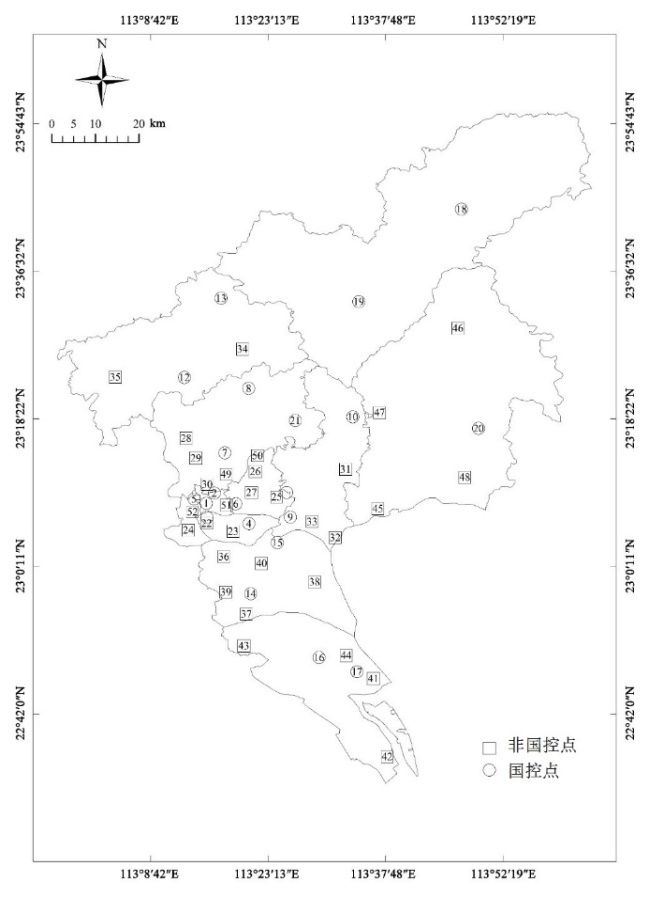
图1 广州市环境空气质量自动监测站分布 1. 公园前;2. 越秀麓湖;3. 海珠宝岗;4. 海珠赤沙;5. 荔湾西村;6. 天河体育西;7. 白云嘉禾;8. 白云竹料;9. 黄埔大沙地;10. 黄埔镇龙;11. 黄埔科学城;12. 花都新华;13. 花都梯面;14. 番禺市桥;15. 番禺大学城;16. 南沙黄阁;17. 南沙街;18. 从化良口;19. 从化街口;20. 增城荔城;21. 帽峰山;22. 海珠沙园;23. 海珠湖;24. 荔湾芳村;25. 天河奥体;26. 天河龙洞;27. 天河五山;28. 白云江高;29. 白云石井;30. 白云新市;31. 黄埔永和;32. 黄埔西区;33. 黄埔文冲;34. 花都花东;35. 花都赤坭;36. 番禺大石;37. 番禺沙湾;38. 番禺亚运城;39. 番禺大夫山;40. 番禺南村;41. 南沙蒲州;42. 南沙新垦;43. 南沙榄核;44. 南沙沙螺湾;45. 增城新塘;46. 增城派潭;47. 增城中新;48. 增城石滩;49. 白云山;50. 凤凰山;51. 杨箕路边站;52. 黄沙路边站
Figure 1 Location of air automatic monitoring sites in Guangzhou 1. GYQ; 2. YXLH; 3. HZBG; 4. HZCS; 5. LWXC; 6. THTYX; 7. BYJH; 8. BYZL; 9. HPDSD; 10. HPZL; 11. HPKXC; 12. HDXH; 13. HDTM; 14. PYSQ; 15. PYDXC; 16. NSHG; 17. NSJ; 18. CHLK; 19. CHJK; 20. ZCLC; 21. MFS; 22. HZSY; 23. HZH; 24. LWFC; 25. THAT; 26. THLD; 27. THWS; 28. BYJG; 29. BYSJ; 30. BYXS; 31. HPYH; 32. HPXQ; 33. HPWC; 34. HDHD; 35. HDCN; 36. PYDS; 37. PYSW; 38. PYYYC; 39. PYDFS; 40. PYNC; 41. NSPZ; 42. NSXK; 43. NSLH; 44. NSSLW; 45. ZCXT; 46. ZCPT; 47. ZCZX; 48. ZCST; 49. BYS; 50. FHS; 51. YJLBZ; 52. HSLBZ
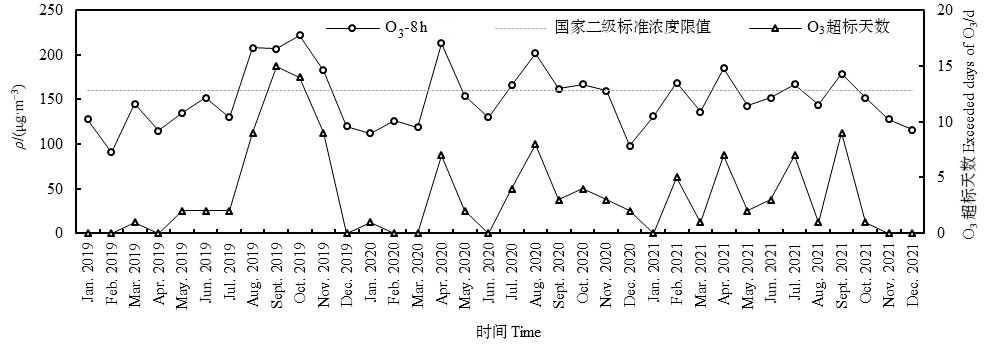
图2 2019—2021年广州市O3-8 h-90%浓度和O3超标天数月度变化
Figure 2 Monthly variation of the concentrations of O3-8 h-90% and exceeded days of O3 in Guangzhou from 2019 to 2021
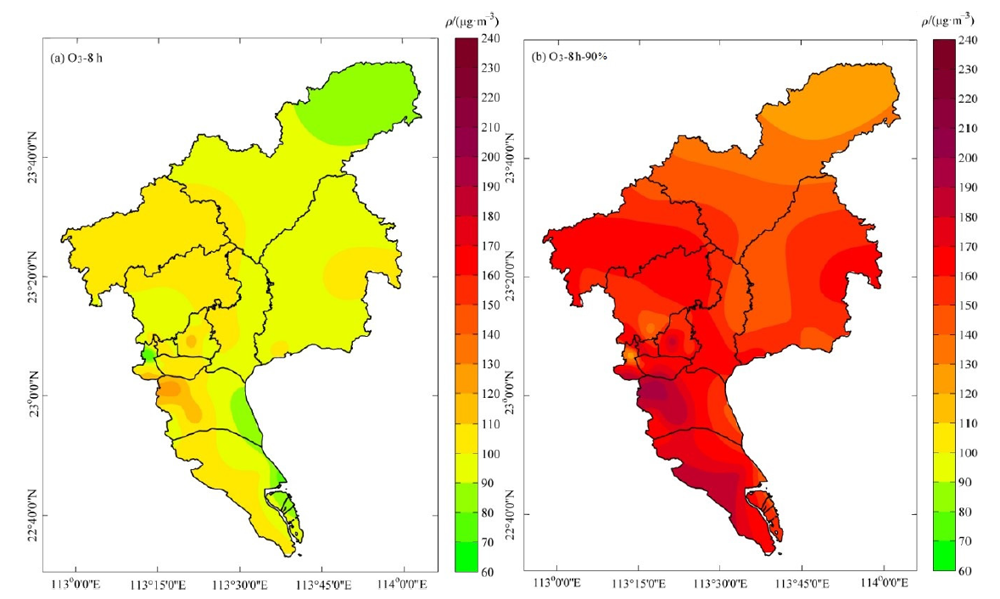
图3 2021年广州市全年O3-8 h均值及O3-8 h-90%浓度分布图
Figure 3 Distribution of the mean concentration of O3-8 h and the concentration of O3-8 h-90% in Guangzhou in 2021
| 气象因子 Meteorological factors | 全年 The whole year | 湿季 Wet season | 干季 Dry season | ||||||||||||||||||||
|---|---|---|---|---|---|---|---|---|---|---|---|---|---|---|---|---|---|---|---|---|---|---|---|
| 相关系数 Correlation coefficient (r) | 显著性水平 Significance level (P) | 样本量 Sample volume (n) | 相关系数 Correlation coefficient (r) | 显著性水平 Significance level (P) | 样本量 Sample volume (n) | 相关系数Correlation coefficient (r) | 显著性水平 Significance level (P) | 样本量 Sample volume (n) | |||||||||||||||
| 日照时数 Sunshine duration | 0.643** | 0.000 | 362 | 0.682** | 0.000 | 183 | 0.640** | 0.000 | 179 | ||||||||||||||
| 风速 Wind speed | -0.355** | 0.000 | 365 | -0.172* | 0.019 | 184 | -0.514** | 0.000 | 181 | ||||||||||||||
| 气温 Temperature | 0.332** | 0.000 | 365 | 0.310** | 0.000 | 184 | 0.458** | 0.000 | 181 | ||||||||||||||
| 降水量 Precipitation | -0.239** | 0.000 | 365 | -0.265** | 0.000 | 184 | -0.253** | 0.001 | 181 | ||||||||||||||
| 气压 Air pressure | -0.208** | 0.000 | 365 | -0.192** | 0.009 | 184 | -0.287** | 0.000 | 181 | ||||||||||||||
| 相对湿度Relative humidity | -0.139** | 0.008 | 365 | -0.469** | 0.000 | 184 | 0.041 | 0.584 | 181 | ||||||||||||||
| 日照时数/风速 Sunshine duration/ Wind speed | 0.745** | 0.000 | 362 | 0.752** | 0.000 | 183 | 0.782** | 0.000 | 179 | ||||||||||||||
表1 2021年广州市O3-8 h与气象因子的相关性
Table 1 The correlations between the concentration of O3-8 h and meteorological factors in Guangzhou in 2021
| 气象因子 Meteorological factors | 全年 The whole year | 湿季 Wet season | 干季 Dry season | ||||||||||||||||||||
|---|---|---|---|---|---|---|---|---|---|---|---|---|---|---|---|---|---|---|---|---|---|---|---|
| 相关系数 Correlation coefficient (r) | 显著性水平 Significance level (P) | 样本量 Sample volume (n) | 相关系数 Correlation coefficient (r) | 显著性水平 Significance level (P) | 样本量 Sample volume (n) | 相关系数Correlation coefficient (r) | 显著性水平 Significance level (P) | 样本量 Sample volume (n) | |||||||||||||||
| 日照时数 Sunshine duration | 0.643** | 0.000 | 362 | 0.682** | 0.000 | 183 | 0.640** | 0.000 | 179 | ||||||||||||||
| 风速 Wind speed | -0.355** | 0.000 | 365 | -0.172* | 0.019 | 184 | -0.514** | 0.000 | 181 | ||||||||||||||
| 气温 Temperature | 0.332** | 0.000 | 365 | 0.310** | 0.000 | 184 | 0.458** | 0.000 | 181 | ||||||||||||||
| 降水量 Precipitation | -0.239** | 0.000 | 365 | -0.265** | 0.000 | 184 | -0.253** | 0.001 | 181 | ||||||||||||||
| 气压 Air pressure | -0.208** | 0.000 | 365 | -0.192** | 0.009 | 184 | -0.287** | 0.000 | 181 | ||||||||||||||
| 相对湿度Relative humidity | -0.139** | 0.008 | 365 | -0.469** | 0.000 | 184 | 0.041 | 0.584 | 181 | ||||||||||||||
| 日照时数/风速 Sunshine duration/ Wind speed | 0.745** | 0.000 | 362 | 0.752** | 0.000 | 183 | 0.782** | 0.000 | 179 | ||||||||||||||
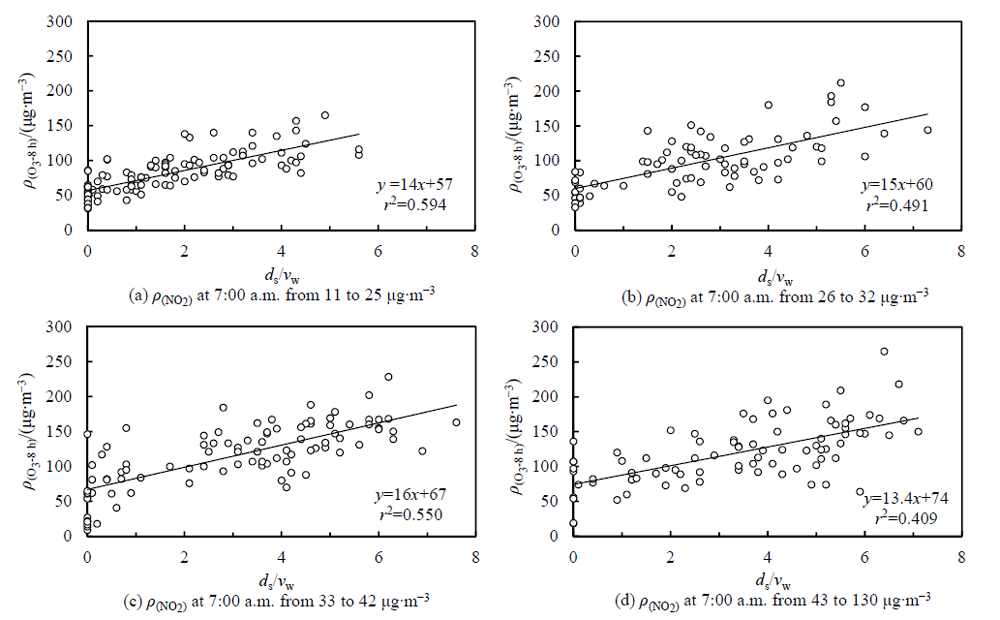
图4 O3-8 h浓度与日照时数(ds)/风速(vw)比值在上午7时NO2的不同浓度区间的线性拟合图
Figure 4 Linear fitting diagrams of the concentrations of O3-8 h and the ratio of sunshine duration/wind speed at different range of the concentrations of NO2 at 7:00 a.m.
| 气象因子 Meteorological factors | 范围 Range | ρ(O3-8 h)/ (μg·m-3) | O3-8 h超标率 Over-limit ratio of O3-8 h/% | 气象因子 Meteorological factors | 范围 Range | ρ(O3-8 h)/ (μg·m-3) | O3-8 h超标率 Over-limit ratio of O3-8 h/% |
|---|---|---|---|---|---|---|---|
| 日照时数 Sunshine duration/(h·d-1) | 0-2.9 | 65 | 0.0 | 相对湿度 Relative humidity/% | ≤60 | 86 | 0.0 |
| 3.0-5.9 | 102 | 2.4 | 61-70 | 114 | 9.8 | ||
| 6.0-8.9 | 127 | 22.4 | 71-80 | 115 | 15.6 | ||
| 9.0-11.9 | 127 | 16.9 | ≥81 | 83 | 4.5 | ||
| 气温 Temperature/℃ | ≤10.0 | 60 | 0.0 | 降水量Precipitation/mm | 0.0 | 114 | 13.2 |
| 10.1-15.0 | 84 | 0.0 | 0.1-9.9 | 88 | 6.2 | ||
| 15.1-20.0 | 94 | 4.7 | 10.0-24.9 | 71 | 0.0 | ||
| 20.1-25.0 | 101 | 10.4 | 25.0-49.9 | 84 | 0.0 | ||
| ≥25.1 | 113 | 32.9 | 50.0-99.9 | 70 | 0.0 | ||
| 气压 Air pressure/hPa | ≤990.0 | 120 | 28.6 | 风速 Wind speed/(m·s-1) | ≤2.0 | 116 | 17.2 |
| 990.1-1000.0 | 106 | 14.0 | 2.1-4.0 | 89 | 1.4 | ||
| 1000.1-1010.0 | 106 | 10.8 | ≥4.1 | 74 | 0.0 | ||
| ≥1010.1 | 91 | 3.1 |
表2 不同气象因子范围与O3-8 h均值和O3-8 h超标率的关系
Table 2 The relationship between different meteorological factor ranges and the mean concentration of O3-8 h and over-limit ratio of the concentration of O3-8 h
| 气象因子 Meteorological factors | 范围 Range | ρ(O3-8 h)/ (μg·m-3) | O3-8 h超标率 Over-limit ratio of O3-8 h/% | 气象因子 Meteorological factors | 范围 Range | ρ(O3-8 h)/ (μg·m-3) | O3-8 h超标率 Over-limit ratio of O3-8 h/% |
|---|---|---|---|---|---|---|---|
| 日照时数 Sunshine duration/(h·d-1) | 0-2.9 | 65 | 0.0 | 相对湿度 Relative humidity/% | ≤60 | 86 | 0.0 |
| 3.0-5.9 | 102 | 2.4 | 61-70 | 114 | 9.8 | ||
| 6.0-8.9 | 127 | 22.4 | 71-80 | 115 | 15.6 | ||
| 9.0-11.9 | 127 | 16.9 | ≥81 | 83 | 4.5 | ||
| 气温 Temperature/℃ | ≤10.0 | 60 | 0.0 | 降水量Precipitation/mm | 0.0 | 114 | 13.2 |
| 10.1-15.0 | 84 | 0.0 | 0.1-9.9 | 88 | 6.2 | ||
| 15.1-20.0 | 94 | 4.7 | 10.0-24.9 | 71 | 0.0 | ||
| 20.1-25.0 | 101 | 10.4 | 25.0-49.9 | 84 | 0.0 | ||
| ≥25.1 | 113 | 32.9 | 50.0-99.9 | 70 | 0.0 | ||
| 气压 Air pressure/hPa | ≤990.0 | 120 | 28.6 | 风速 Wind speed/(m·s-1) | ≤2.0 | 116 | 17.2 |
| 990.1-1000.0 | 106 | 14.0 | 2.1-4.0 | 89 | 1.4 | ||
| 1000.1-1010.0 | 106 | 10.8 | ≥4.1 | 74 | 0.0 | ||
| ≥1010.1 | 91 | 3.1 |
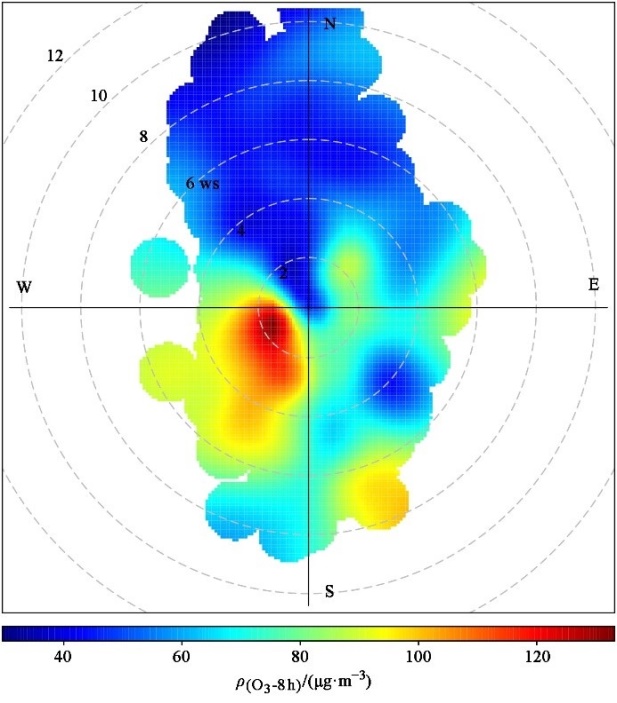
图5 不同风向、风速下的O3-8 h均值
Figure 5 The mean concentrations of O3-8 h at different wind directions and wind speeds
| 超标日 Exceeded date | ρ(O3-8 h)/ (μg·m-3) | 地面天气形势 Ground weather situation | 500 hPa天气形势 500 hPa weather situation | 超标日 Exceeded day | ρ(O3-8 h)/ (μg·m-3) | 地面天气形势 Ground weather situation | 500 hPa天气形势 500 hPa weather situation |
|---|---|---|---|---|---|---|---|
| Feb.4 | 113 | 弱高压脊 | 西风气流 | 7.9 | 105 | 弱高压脊 | 副高 |
| Feb.6 | 106 | 均压场 | 西风气流 | 7.17 | 101 | 弱低压槽 | 副高 |
| Feb.7 | 109 | 均压场 | 弱脊 | 7.23 | 108 | 弱低压槽 | 台风外围 |
| Feb.22 | 109 | 均压场 | 西风槽 | 7.26 | 119 | 弱低压槽 | 台风外围 |
| Feb.23 | 127 | 均压场 | 西风槽 | 7.27 | 107 | 弱低压槽 | 西北气流 |
| Mar.25 | 120 | 弱高压脊 | 西风槽 | 7.28 | 126 | 弱低压槽 | 西北气流 |
| Apr.6 | 122 | 弱高压脊 | 副高 | 7.29 | 107 | 弱低压槽 | 西风槽 |
| Apr.11 | 109 | 弱高压脊 | 偏西气流 | 8.2 | 139 | 弱低压槽 | 辐合带环流 |
| Apr.13 | 102 | 均压场 | 偏西气流 | 9.6 | 105 | 弱低压槽 | 副高 |
| Apr.21 | 132 | 均压场 | 弱脊 | 9.12 | 101 | 弱低压槽 | 副高+台风外围 |
| Apr.22 | 115 | 均压场 | 西北气流 | 9.13 | 102 | 弱低压槽 | 副高 |
| Apr.23 | 145 | 均压场 | 西北气流 | 9.18 | 115 | 弱高压脊 | 副高 |
| Apr.30 | 200 | 均压场 | 偏西气流 | 9.26 | 116 | 均压场 | 副高 |
| May.1 | 153 | 均压场 | 偏西气流 | 9.27 | 163 | 均压场 | 副高 |
| May.7 | 108 | 均压场 | 西南气流 | 9.28 | 148 | 均压场 | 反气旋环流 |
| Jun.6 | 106 | 弱低压槽 | 西北气流 | 9.29 | 130 | 均压场 | 西风槽 |
| Jun.7 | 122 | 弱低压槽 | 弱脊 | 9.30 | 107 | 均压场 | 偏西气流 |
| Jun.8 | 117 | 弱低压槽 | 副高 | 10.19 | 103 | 弱高压脊 | 偏西气流 |
表3 2021年广州市O3超标日天气形势及O3-8 h均值
Table 3 Weather situations and the mean concentrations of O3-8 h on the exceeded days of O3-8 h in Guangzhou in 2021
| 超标日 Exceeded date | ρ(O3-8 h)/ (μg·m-3) | 地面天气形势 Ground weather situation | 500 hPa天气形势 500 hPa weather situation | 超标日 Exceeded day | ρ(O3-8 h)/ (μg·m-3) | 地面天气形势 Ground weather situation | 500 hPa天气形势 500 hPa weather situation |
|---|---|---|---|---|---|---|---|
| Feb.4 | 113 | 弱高压脊 | 西风气流 | 7.9 | 105 | 弱高压脊 | 副高 |
| Feb.6 | 106 | 均压场 | 西风气流 | 7.17 | 101 | 弱低压槽 | 副高 |
| Feb.7 | 109 | 均压场 | 弱脊 | 7.23 | 108 | 弱低压槽 | 台风外围 |
| Feb.22 | 109 | 均压场 | 西风槽 | 7.26 | 119 | 弱低压槽 | 台风外围 |
| Feb.23 | 127 | 均压场 | 西风槽 | 7.27 | 107 | 弱低压槽 | 西北气流 |
| Mar.25 | 120 | 弱高压脊 | 西风槽 | 7.28 | 126 | 弱低压槽 | 西北气流 |
| Apr.6 | 122 | 弱高压脊 | 副高 | 7.29 | 107 | 弱低压槽 | 西风槽 |
| Apr.11 | 109 | 弱高压脊 | 偏西气流 | 8.2 | 139 | 弱低压槽 | 辐合带环流 |
| Apr.13 | 102 | 均压场 | 偏西气流 | 9.6 | 105 | 弱低压槽 | 副高 |
| Apr.21 | 132 | 均压场 | 弱脊 | 9.12 | 101 | 弱低压槽 | 副高+台风外围 |
| Apr.22 | 115 | 均压场 | 西北气流 | 9.13 | 102 | 弱低压槽 | 副高 |
| Apr.23 | 145 | 均压场 | 西北气流 | 9.18 | 115 | 弱高压脊 | 副高 |
| Apr.30 | 200 | 均压场 | 偏西气流 | 9.26 | 116 | 均压场 | 副高 |
| May.1 | 153 | 均压场 | 偏西气流 | 9.27 | 163 | 均压场 | 副高 |
| May.7 | 108 | 均压场 | 西南气流 | 9.28 | 148 | 均压场 | 反气旋环流 |
| Jun.6 | 106 | 弱低压槽 | 西北气流 | 9.29 | 130 | 均压场 | 西风槽 |
| Jun.7 | 122 | 弱低压槽 | 弱脊 | 9.30 | 107 | 均压场 | 偏西气流 |
| Jun.8 | 117 | 弱低压槽 | 副高 | 10.19 | 103 | 弱高压脊 | 偏西气流 |
| 气象因子及O3质量浓度 Meteorological factors and concentrations of O3 | 均压场 Equalizing field | 弱高压脊 Weak high pressure ridge | 弱低压槽 Weak low pressure trough | 超标日 Exceeded days | 全年 The whole year |
|---|---|---|---|---|---|
| 平均气温 Mean temperature/℃ | 25.2 | 23.9 | 29.5 | 26.5 | 23.1 |
| 平均日照时数 Mean sunshine duration/(h·d-1) | 8.6 | 8.1 | 8.6 | 8.5 | 5.2 |
| 平均气压 Mean air pressure/hPa | 1004.0 | 1007.9 | 994.4 | 1001.3 | 1004.8 |
| 平均日降水量 Mean precipitation/mm | 0 | 0 | 0.8 | 0.3 | 4.2 |
| 平均相对湿度 Mean relative humidity/% | 74.2 | 72.3 | 76.3 | 74.6 | 75 |
| 平均风速 Mean wind speed/(m·s-1) | 1.6 | 1.7 | 1.7 | 1.7 | 2.2 |
| O3-8 h均值 Mean concentration of O3-8 h/(μg·m-3) | 191 | 173 | 173 | 181 | 103 |
| O3-8 h-90%质量浓度 Mass concentration of O3-8 h-90%/(μg·m-3) | 223 | 182 | 187 | 210 | 160 |
表4 2021年广州市O3-8 h超标日在不同地面天气形势的气象因子和O3质量浓度
Table 4 Meteorological factors and the concentrations of O3 in different ground weather conditions on exceeded days of O3-8 h in Guangzhou in 2021
| 气象因子及O3质量浓度 Meteorological factors and concentrations of O3 | 均压场 Equalizing field | 弱高压脊 Weak high pressure ridge | 弱低压槽 Weak low pressure trough | 超标日 Exceeded days | 全年 The whole year |
|---|---|---|---|---|---|
| 平均气温 Mean temperature/℃ | 25.2 | 23.9 | 29.5 | 26.5 | 23.1 |
| 平均日照时数 Mean sunshine duration/(h·d-1) | 8.6 | 8.1 | 8.6 | 8.5 | 5.2 |
| 平均气压 Mean air pressure/hPa | 1004.0 | 1007.9 | 994.4 | 1001.3 | 1004.8 |
| 平均日降水量 Mean precipitation/mm | 0 | 0 | 0.8 | 0.3 | 4.2 |
| 平均相对湿度 Mean relative humidity/% | 74.2 | 72.3 | 76.3 | 74.6 | 75 |
| 平均风速 Mean wind speed/(m·s-1) | 1.6 | 1.7 | 1.7 | 1.7 | 2.2 |
| O3-8 h均值 Mean concentration of O3-8 h/(μg·m-3) | 191 | 173 | 173 | 181 | 103 |
| O3-8 h-90%质量浓度 Mass concentration of O3-8 h-90%/(μg·m-3) | 223 | 182 | 187 | 210 | 160 |
| 时间 Time | 持续天数Duration days/d | 广东省O3超标城市占比(含广州) Proportion of cities with the over-standard of O3 in Guangdong Province (including Guangzhou)/% | O3污染级别 Pollution level of O3 |
|---|---|---|---|
| Feb.6-Feb.7 | 2 | 23.8 | 轻度污染 |
| Feb.22- Feb.23 | 2 | 38.1 | 轻度污染 |
| Apr.21- Apr.23 | 3 | 38.1 | 轻度污染 |
| Apr.30-May.1 | 2 | 81.0 | 中度污染 |
| Jun.6-Jun.8 | 3 | 52.4 | 轻度污染 |
| Jul.26-Jul.29 | 4 | 42.9 | 轻度污染 |
| Sep.12-Sep.13 | 2 | 33.3 | 轻度污染 |
| Sep.26-Sep.30 | 5 | 76.2 | 轻-中度污染 |
表5 2021年广州市O3连续污染过程情况
Table 5 Continuous O3 pollution processes in Guangzhou in 2021
| 时间 Time | 持续天数Duration days/d | 广东省O3超标城市占比(含广州) Proportion of cities with the over-standard of O3 in Guangdong Province (including Guangzhou)/% | O3污染级别 Pollution level of O3 |
|---|---|---|---|
| Feb.6-Feb.7 | 2 | 23.8 | 轻度污染 |
| Feb.22- Feb.23 | 2 | 38.1 | 轻度污染 |
| Apr.21- Apr.23 | 3 | 38.1 | 轻度污染 |
| Apr.30-May.1 | 2 | 81.0 | 中度污染 |
| Jun.6-Jun.8 | 3 | 52.4 | 轻度污染 |
| Jul.26-Jul.29 | 4 | 42.9 | 轻度污染 |
| Sep.12-Sep.13 | 2 | 33.3 | 轻度污染 |
| Sep.26-Sep.30 | 5 | 76.2 | 轻-中度污染 |
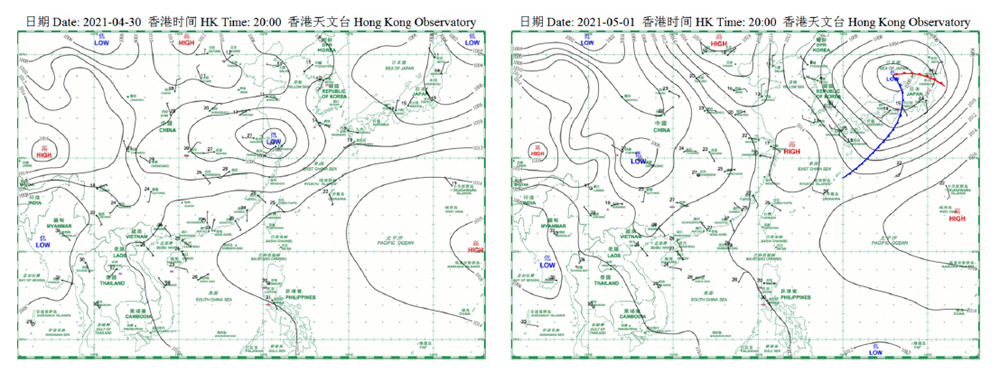
图6 4月30日—5月1日O3污染过程地面天气形势
Figure 6 Ground weather situations during O3 pollution from April 30 to May 1

图7 4月29日16:00—5月1日15时广州塔地面、118 m气温及温差时序图 “地面-118 m”为广州塔地面与广州塔118 m的温差,负值代表逆温
Figure 7 The sequence diagram of the temperature at ground and 118 m of Guangzhou Tower and their temperature differences from 16:00 on April 29 to 15:00 on May 1 “Ground-118 m” is the temperature difference between the temperature at ground and 118 m of Guangzhou Tower, and negative value represents inversion
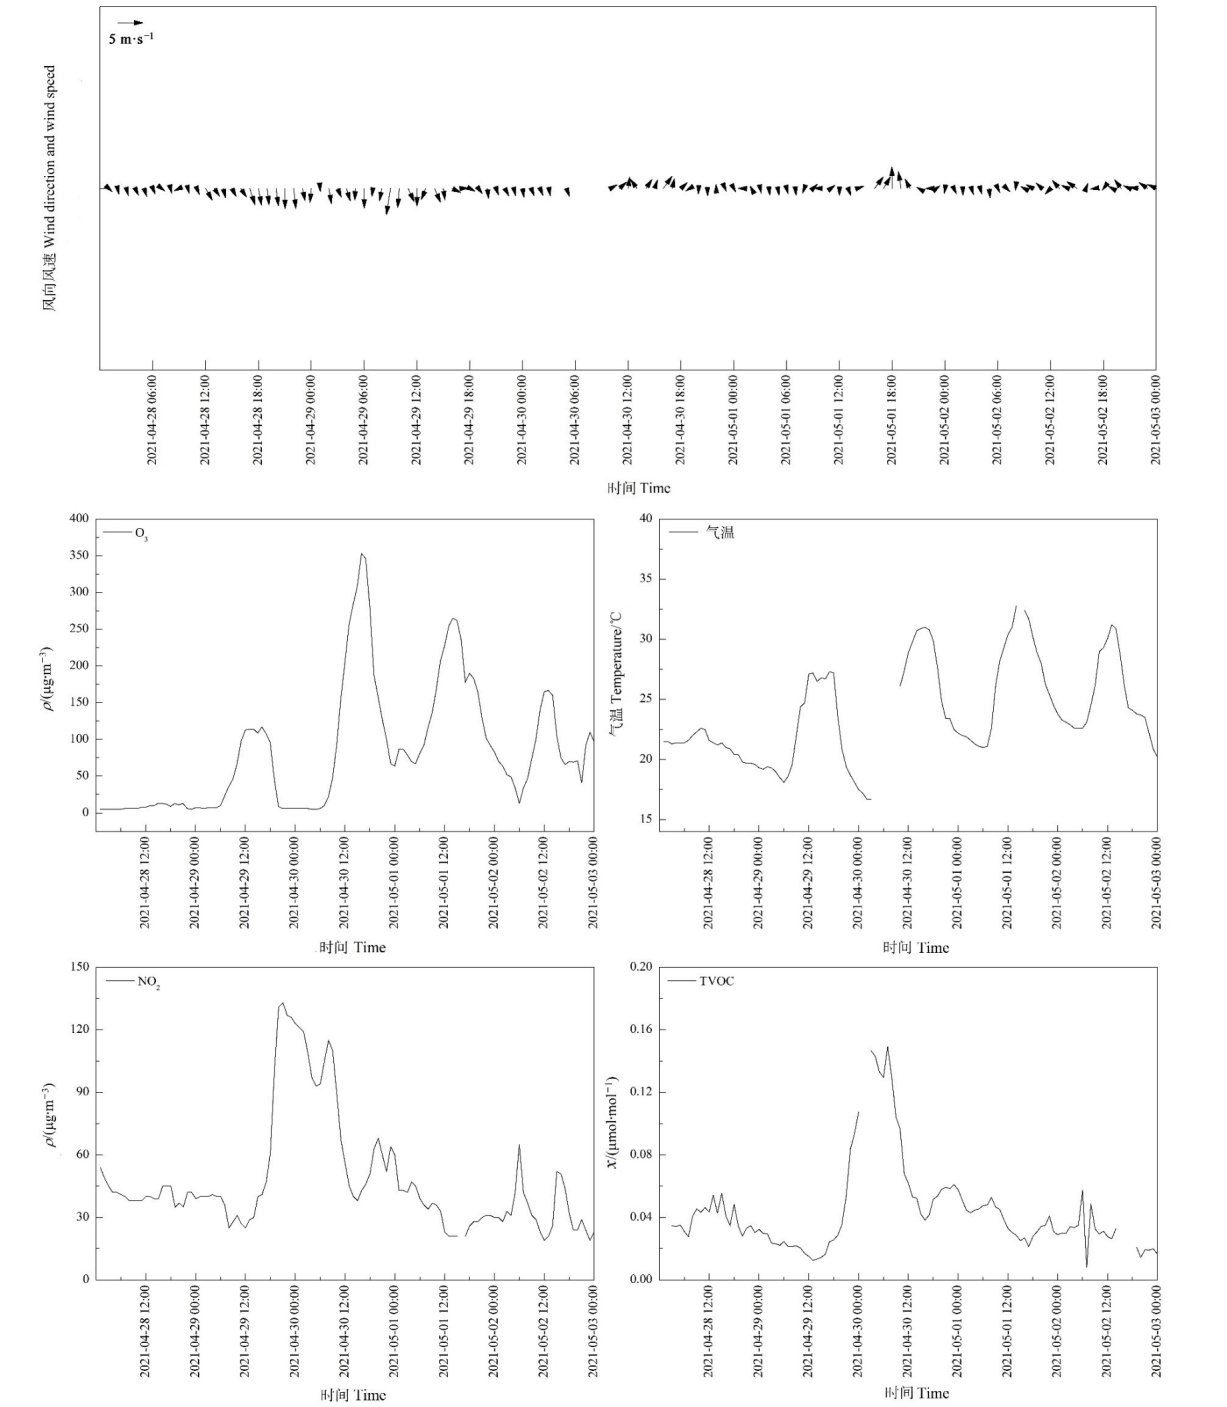
图8 4月28日—5月2日广州市O3、NO2、TVOC、气温和风向风速时序图
Figure 8 Time sequence diagram of O3, NO2, TVOC, temperature, wind direction and speed from April 28 to May 2 in Guangzhou
| [1] |
ANENBERG S C, HOROWITZ L W, TONG D Q, et al., 2010. An estimate of the global burden of anthropogenic ozone and fine particulate matter on premature human mortality using atmospheric modeling[J]. Environmental Health Perspectives, 118(9): 1189-1195.
DOI PMID |
| [2] | CHEN X, ZHANG L W, HUANG J J, et al., 2016. Long-term exposure to urban air pollution and lung cancer mortality: A 12-year cohort study in Northern China[J]. Science of the Total Environment, 571: 885-861. |
| [3] |
FENG Z Z, HU E Z, Wang X K, et al., 2015. Ground-level O3 pollution and its impacts on food crops in China: A review[J]. Environmental Pollution, 199: 42-48.
DOI URL |
| [4] |
FU T M, ZHENG Y, PAULOT F, et al., 2015. Positive but variable sensitivity of August surface ozone to large-scale warming in the southeast United States[J]. Nature Climate Change, 5(5): 454-458.
DOI URL |
| [5] |
GHUDE S D, JENA C, CHATE D M, et al., 2014. Reductions in India's crop yield due to ozone[J]. Geophysical Research Letters, 41(15): 5685-5691.
DOI URL |
| [6] |
KAVASSALIS S C, MURPHY J G, 2017. Understanding ozone-meteorology correlations: A role for dry deposition[J]. Geophysical Research Letters, 44(6): 2922-2931.
DOI URL |
| [7] | LEE Y C, SHINDELL D T, FALUVEGI G, et al., 2014. Increase of ozone concentrations, its temperature sensitivity and the precursor factor in South China[J]. Tellus B, 66(1): 1-16. |
| [8] |
LELIEVELD J, EVANS J S, FNAIS M, et al., 2015. The Contribution of Outdoor Air Pollution Sources to Premature Mortality on a Global Scale[J]. Nature, 525(7569): 367-371.
DOI URL |
| [9] | POLLACK I B, RYERSON T B, TRAINER M, et al., 2015. Airborne and ground-based observations of a weekend effect in ozone, precursors, and oxidation products in the California South Coast Air Basin[J]. Journal of Geophysical Research Atmospheres, 117(D21): 405-425. |
| [10] |
SHAO M, ZHANG Y H, ZENG L M, et al., 2009. Ground-level ozone in the Pearl River Delta and the roles of VOC and NOx in its production[J]. Journal of Environmental Management, 90(1): 512-518.
DOI URL |
| [11] |
YANG C X, YANG H B, GUO S, et al., 2012. Alternative ozone metrics and daily mortality in Suzhou: The China air pollution and health effects study (CAPES)[J]. Science of the Total Environment, 426: 83-89.
DOI URL |
| [12] | 陈婉莹, 陈懿昂, 褚旸晰, 等, 2022. 珠三角地区臭氧来源特征的数值模拟研究[J]. 环境科学学报, 42(3): 293-308. |
| CHEN W Y, CHEN Y A, CHU Y X, et al., 2022. Numerical simulation of ozone source characteristics in the Pearl River Delta region[J]. Acta Scientiae Circumstantiae, 42(3): 293-308. | |
| [13] | 陈漾, 张金谱, 黄祖照, 2017. 广州市近地面臭氧时空变化及其与气象因子的关系[J]. 中国环境监测, 33(4): 99-109. |
| CHEN Y, ZHANG J P, HUANG Z Z, 2017. Spatial-temporal variation of surface ozone in Guangzhou and its relations with meteorological factors[J]. Environmental Monitoring in China, 33(4): 99-109. | |
| [14] | 程念亮, 李云婷, 张大伟, 等, 2016. 2014年北京市城区臭氧超标日浓度特征及与气象条件的关系[J]. 环境科学, 37(6): 2041-2051. |
| CHENG N L, LI Y T, ZHANG D W, et al., 2016. Characteristics of ozone over standard and its relationships with meteorological conditions in Beijing City in 2014[J]. Environmental Science, 37(6): 2041-2051. | |
| [15] | 崔坤, 赵慧, 刘鹏, 等, 2021. 2019年许昌市臭氧污染情况及其与气象条件的关系[J]. 气象与环境学, 44(1): 89-95. |
| CUI K, ZHAO H, LIU P, et al., 2021. Analysis of the 2019 ozone pollution and meteorological conditions in Xuchang of Henan Province[J]. Meteorological and Environmental Sciences, 44(1): 89-95. | |
| [16] | 邓爱萍, 陆维青, 杨雪, 2017. 2013—2017年江苏省环境空气中首要污染物变化分析研究[J]. 环境科学与管理, 42(12): 19-22. |
| DENG A P, LU W Q, YANG X, 2017. Analysis on Change of Primary Pollutant in Ambient Air of Jiangsu Province during 2013 and 2017[J]. Environmental Science and Management, 42(12): 19-22. | |
| [17] | 邓慧颖, 陈立新, 余永江, 等, 2021. 武夷山市臭氧分布特征及其与气象要素关系分析[J]. 生态环境学报, 30(7): 1428-1435. |
| DENG H Y, CHEN L X, YU Y J, et al., 2021. Characteristics of ozone pollution distribution and its correlation analysis with meteorological factors in Wuyishan[J]. Ecology and Environmental Sciences, 30(7): 1428-1435. | |
| [18] | 董昊, 程龙, 王含月, 等, 2021. 安徽省臭氧污染特征及气象影响因素分析[J]. 中国环境监测, 37(1): 58-68. |
| DONG H, CHENG L, WANG H Y, et al., 2021. Analysis of ozone pollution characteristics and meteorological factors in Anhui province[J]. Environmental Monitoring in China, 37(1): 58-68. | |
| [19] | 符传博, 丹利, 刘丽君, 等, 2022b. 2019年秋季三亚市一次典型臭氧污染个例气象成因解析[J]. 生态环境学报, 31(1): 89-99. |
| FU C B, DAN L, LIU L J, et al., 2022b. Characteristics of a typical ozone pollution event and its meteorological reason in Sanya city in autumn 2019[J]. Ecology and Environmental Sciences, 31(1): 89-99. | |
| [20] | 符传博, 徐文帅, 丹利, 等, 2022a. 2015—2020年年海南省臭氧时空变化及其成因分析[J]. 环境科学, 43(2): 675-685. |
| FU C B, XU W S, DAN L, et al., 2022a. Temporal and spatial variations in ozone and its causes over Hainan Province from 2015 to 2020[J]. Environmental Science, 43(2): 675-685. | |
| [21] | 高素莲, 闫学军, 刘光辉, 等, 2020. 济南市夏季臭氧重污染时段VOCs污染特征及来源解析[J]. 生态环境学报, 29(9): 1839-1846. |
| GAO S L, YAN X J, LIU G H, et al., 2020. Characteristics and source apportionment of ambient VOCs in serious ozone pollution period of summer in Ji’nan[J]. Ecology and Environmental Sciences, 29(9): 1839-1846. | |
| [22] | 国家环境保护总局, 2005. 环境空气质量自动监测技术规范: HJ/T193—2005 [S]. 北京: 中国环境科学出版社. |
| State Environmental Protection Administration of the People’ s Republic of China, 2005. Technical specification for automatic monitoring of ambient air quality: HJ/T193—2005 [S]. Beijing: China Environmental Science Press. | |
| [23] | 洪莹莹, 陈辰, 保鸿燕, 等, 2021. 珠三角西南部春季臭氧来源与敏感性分析[J]. 生态环境学报, 30(5): 984-994. |
| HONG Y Y, CHEN C, BAO H Y, et al., 2021. Sources and sensitivity analysis of ozone in spring over the southwestern part of Pearl River Delta region[J]. Ecology and Environmental Sciences, 30(5): 984-994. | |
| [24] | 侯素霞, 张鉴达, 李静, 2021. 上海市大气污染物时空分布及其相关性因子分析[J]. 生态环境学报, 30(6): 1220-1228. |
| HOU S X, ZHANG J D, LI J, 2021. Analysis of spatiotemporal distribution and correlation factors of atmospheric pollutants in Shanghai city[J]. Ecology and Environmental Sciences, 30(6): 1220-1228. | |
| [25] | 黄俊, 廖碧婷, 吴兑, 等, 2018. 广州近地面臭氧浓度特征及气象影响分析[J]. 环境科学学报, 38(1): 23-31. |
| HUANG J, LIAO B T, WU D, et al., 2018. Guangzhou ground level ozone concentration characteristics and associated meteorological factors[J]. Aeta Scientiae Circumstantiae, 38(1): 23-31. | |
| [26] | 李莉, 杨闻达, 吕升, 等, 2022. 嘉兴市臭氧污染特征及其与气象条件的关系[J]. 中山大学学报 (自然科学版), 61(2): 147-153. |
| LI L, YANG W D, LÜ L, et al., 2022. Characteristics of ozone pollution and its relationship with meteorological factors in Jiaxing city[J]. Acta Scientiarum Naturalium Universitatis Sunyatseni, 61(2): 147-153. | |
| [27] | 李婷苑, 陈靖扬, 翁佳烽, 等, 2022. 2015—2020年广东省臭氧污染天气型及其变化特征[J]. 中国环境科学, 42(5): 2015-2024. |
| LI T Y, CHEN J Y, WENG J F, et al., 2022. Ozone pollution synoptic patterns and their variation characteristics in Guangdong Province during 2015-2020[J]. China Environmental Science, 42(5): 2015-2024. | |
| [28] | 吕瑞鹤, 张进生, 薛艳龙, 等., 2020. 承德市臭氧污染特征及其与气象因子的相关性研究[J]. 南开大学学报 (自然科学版), 53(6): 85-91. |
| LÜ R H, ZHANG J S, XUE Y L, et al., The relevance between the pollution characteristics of O3 and meteorological factors in chengde[J]. Acta Scientiarum Naturalium Universitatis Nankaiensis, 53(6): 85-91. | |
| [29] | 齐国伟, 邹爱华, 邓雪峰, 等, 2022. 乐山市臭氧生成与前体物之间的关系及其敏感性和控制分析[J]. 四川环境, 41(1): 47-57. |
| QI G W, ZOU A H, DENG X F, et al., 2022. The relationship between ozone generation and precursors, and their sensitivity and control analysis in Leshan city[J]. Sichuan Environment, 41(1): 47-57. | |
| [30] | 齐艳杰, 于世杰, 杨健, 等, 2020. 河南省臭氧污染特征与气象因子影响分析[J]. 环境科学, 41(2): 587-599. |
| QI Y J, YU S J, YANG J, et al., 2020. Analysis of Characteristic and Meteorological Influence Factors of Ozone Pollution in Henan Province[J]. Environmental Science, 41(2): 587-599. | |
| [31] | 奇奕轩, 胡君, 张鹤丰, 等, 2017. 北京市郊区夏季臭氧重污染特征及生成效率[J]. 环境科学研究, 30(5): 663-671. |
| QI Y X, HU J, ZHANG H F, et al., 2017. Pollution Characteristics and Production Efficiency of Ozone in Summertime at Rural Site in Beijing[J]. Research of Enviromental Sciences, 30(5): 663-671. | |
| [32] | 钱悦, 许彬, 夏玲君, 等, 2021. 2016—2019年江西省臭氧污染特征与气象因子影响分析[J]. 环境科学, 42(5): 2190-2201. |
| QIAN Y, XU B, XIA L J, et al., 2021. Characteristics of ozone pollution and relationships with meteorological factors in Jiangxi province[J]. Environmental Science, 42(5): 2190-2201. | |
| [33] | 沈劲, 陈多宏, 汪宇, 等, 2018. 基于情景分析的珠三角臭氧与前体物排放关系研究[J]. 生态环境学报, 27(10): 1925-1932. |
| SHEN J, CHEN D H, WANG Y, et al., 2018. Study on the relationship between ozone and precursors emission in the Pearl River Delta based on scenario analysis[J]. Ecology and Environmental Sciences, 27(10): 1925-1932. | |
| [34] | 沈劲, 黄晓波, 汪宇, 等, 2017. 广东省臭氧污染特征及其来源解析研究[J]. 环境科学学报, 37(2): 4449-4457. |
| SHEN J, HUANG X B, WANG Y, et al., 2017. Study on ozone pollution characteristics and source apportionment in Guangdong Province[J]. Acta Scientiae Circumstantiae, 37(12): 4449-4457. | |
| [35] | 苏筱倩, 安俊琳, 张玉欣, 等, 2019. 支持向量机回归在臭氧预报中的应用[J]. 环境科学, 40(4): 1697-1704. |
| SU X Q, AN J L, ZHANG Y X, et al., 2019. Application of support vector machine regression in ozone forecasting[J]. Environmental Science, 40(4): 1697-1704. | |
| [36] | 唐孝炎, 张远航, 邵敏, 2006. 大气环境化学[M]. 第2版. 北京: 高等教育出版社: 106-107. |
| TANG X Y, ZHANG Y H, SHAO M, 2006. Atmospheric environmental chemistry[M]. The second edition. Beijing: Higher Education Press: 106-107. | |
| [37] | 万五星, 张帅, 李洁, 等, 2021. 河北省城市空气臭氧污染及其对植物伤害的区域差异[J]. 生态环境学报, 30(11): 2185-2194. |
| WAN W X, ZHANG S, LI J, et al., 2021. Regional differences of urban ozone pollution and its damage to plants in Hebei Province[J]. Ecology and Environmental Sciences, 30(11): 2185-2194. | |
| [38] | 王开燕, 邓雪娇, 张剑, 等, 2015. 广州南沙区O3浓度变化及其与气象因子的关系[J]. 环境污染与防治, 34(6): 23-26. |
| WANG K Y, DENG X J, ZHANG J, et al., 2015. Analysis on the change of ozone concentration in Nansha district of Guangzhou and its relationship with meteorological factors[J]. Environmental Pollution and Control, 34(6): 23-26. | |
| [39] | 吴瑞霞, 浦一芬, 张美根, 等, 2005. 北京市夏季臭氧变化特征的观测研究[J]. 南京气象学院学报, 28(5): 690-694. |
| WU R X, PU Y F, ZHANG M G, et al., 2005. Analysis of O3 vertical variation in summer in Beijing area[J]. Journal of Nanjing Institute of Meteorology, 28(5): 690-694. | |
| [40] | 谢祖欣, 冯宏芳, 林文, 等, 2020. 气象条件对福州市夏季臭氧 (O3)浓度的影响研究[J]. 生态环境学报, 29(11): 2251-2261. |
| XIE Z X, FENG H F, LIN W, et al., 2020. Meteorological factors impact on summertime ozone (O3) concentration in Fuzhou[J]. Ecology and Environmental Sciences, 29(11): 2251-2261. | |
| [41] | 颜敏, 黄晓波, 陈丹, 等, 2021. 深圳市臭氧污染特征及其与前体物关系分析[J]. 生态环境学报, 30(4): 763-770. |
| YAN M, HUANG X B, CHEN D, et al., 2021. Characteristics of ozone pollution and relationship between ozone and precursors in Shenzhen[J]. Ecology and Environmental Sciences, 30(4): 763-770. | |
| [42] | 易睿, 王亚林, 张殷俊, 等, 2015. 长江三角洲地区城市臭氧污染特征与影响因素分析[J]. 环境科学学报, 35(8): 2371-2377. |
| YI R, WANG Y L, ZHANG Y J, et al., 2015. Pollution characteristics and influence factors of ozone in Yangtze River Delta[J]. Acta Scientiae Circumstantiae, 35(8): 2370-2377. | |
| [43] | 周映彤, 王岩, 孙铭禹, 等, 2021. 近地层臭氧浓度升高对亲子代大豆叶片抗氧化系统的影响[J]. 生态环境学报, 30(11): 2195-2203. |
| ZHOU Y T, WANG Y, SUN M Y, et al., 2021. Effect of ozone concentration increasing near the ground on antioxidant system of parent and offspring soybean leaves[J]. Ecology and Environmental Sciences, 30(11): 2195-2203. | |
| [44] | 邹旭东, 蔡福, 王笑影, 等, 2020. 辽宁省臭氧质量浓度变化研究[J]. 生态环境学报, 29(9): 1830-1838. |
| ZOU X D, CAI F, WANG X Y, et al., 2020. Study on the change of ozone concentration in Liaoning province[J]. Ecology and Environmental Sciences, 29(9): 1830-1838. | |
| [45] | 中华人民共和国环境保护部, 国家质量监督检验检疫总局, 2012. 环境空气质量标准: GB 3095—2012[S]. 北京: 中国环境科学出版社. |
| Ministry of Ecology and Environment of the People’ s Republic of China, General Administration of Quality Supervision, Inspection and Quarantine of the People’ s Republic of China, 2012. Ambient ait quality standards: GB 3095—2012[S]. Beijing: China Environmental Science Press. | |
| [46] | 中华人民共和国环境保护部, 2012. 环境空气质量指数 (AQI) 技术规定 (试行): HJ 633—2012[S]. 北京: 中国环境科学出版社. |
| Ministry of Ecology and Environment of the People’ s Republic of China, 2012. Technical regulation on ambient air quality index (on trial): HJ 633—2012[S]. Beijing: China Environmental Science Press. | |
| [47] | 中华人民共和国环境保护部, 2013. 环境空气质量评价技术规范 (试行): HJ 663—2013 [S]. 北京: 中国环境科学出版社. |
| Ministry of Ecology and Environment of the People’ s Republic of China, 2012. Technical regulation for ambient air quality assessment (on trial): HJ 663—2012 [S]. Beijing: China Environmental Science Press. |
| [1] | 杜彩艳, 杨鹏, 蜂述先, 毛妍婷, 陶琼, 此主拉姆, 彭慧娉, 和建美, 李卫林. 不同生态区维西糯山药品质与生态因子相关性研究[J]. 生态环境学报, 2023, 32(6): 1053-1061. |
| [2] | 朱永乐, 汤家喜, 谭婷, 李玉, 向彪. 氟化工园区周边玉米中全氟/多氟化合物的污染特征[J]. 生态环境学报, 2023, 32(5): 1001-1006. |
| [3] | 王云, 郑西来, 曹敏, 李磊, 宋晓冉, 林晓宇, 郭凯. 滨海含水层咸-淡水过渡带反硝化性能与控制因素研究[J]. 生态环境学报, 2023, 32(5): 980-988. |
| [4] | 刘紫薇, 葛继稳, 王月环, 杨诗雨, 姚东, 谢金林. 大九湖泥炭湿地甲烷通量变异特征及影响因素[J]. 生态环境学报, 2023, 32(4): 706-714. |
| [5] | 王铁铮, 瞿心悦, 刘春香, 李有志. 东江湖水质时空变化规律及其与流域土地利用的关系[J]. 生态环境学报, 2023, 32(4): 722-732. |
| [6] | 冯树娜, 吕家珑, 何海龙. KI淋洗对黄绵土汞污染的去除效果及土壤理化性状的影响[J]. 生态环境学报, 2023, 32(4): 776-783. |
| [7] | 钱海铭, 张运林, 李娜, 王玮佳, 孙晓, 张毅博, 施坤, 冯胜, 高阳辉. 典型降雨过程中河流饮用水源地水质高频监测研究[J]. 生态环境学报, 2023, 32(3): 579-589. |
| [8] | 杨宇, 邓仁健, 隆佩, 黄中杰, 任伯帜, 王政华. 砷氧化菌Pseudomonas sp. AO-1的分离鉴定及其对As(Ⅲ)的氧化性能研究[J]. 生态环境学报, 2023, 32(3): 619-626. |
| [9] | 杨耀东, 陈玉梅, 涂鹏飞, 曾清如. 经济作物轮作模式下镉污染农田修复潜力[J]. 生态环境学报, 2023, 32(3): 627-634. |
| [10] | 刘抗旱, 郑刘根, 张理群, 丁丹, 单士锋. 复合型植物源活化剂强化蜈蚣草修复砷污染土壤的效应研究[J]. 生态环境学报, 2023, 32(3): 635-642. |
| [11] | 符传博, 丹利, 佟金鹤, 陈红. 海口市区臭氧污染变化特征及潜在源区分析[J]. 生态环境学报, 2023, 32(2): 331-340. |
| [12] | 韩翠, 康扬眉, 余海龙, 李冰, 黄菊莹. 荒漠草原凋落物分解过程中降水量对土壤酶活性的影响[J]. 生态环境学报, 2022, 31(9): 1802-1812. |
| [13] | 傅梦琪, 刘娟, 李进, 张凡, 李雪瑶, 杨正军, 李彭辉, 金陶胜. 不同油品对国Ⅳ、国Ⅴ柴油公交车的碳排放影响研究[J]. 生态环境学报, 2022, 31(9): 1849-1855. |
| [14] | 郝贝贝, 王楠, 吴昊平, 周智鑫, 张思毅, 贺斌. 生态沟渠对珠三角稻田径流污染的削减功能研究[J]. 生态环境学报, 2022, 31(9): 1856-1864. |
| [15] | 马闯, 王雨阳, 周通, 吴龙华. 污染土壤颗粒态有机质镉锌富集特征及其解吸行为研究[J]. 生态环境学报, 2022, 31(9): 1892-1900. |
| 阅读次数 | ||||||
|
全文 |
|
|||||
|
摘要 |
|
|||||