生态环境学报 ›› 2020, Vol. 29 ›› Issue (1): 23-34.DOI: 10.16258/j.cnki.1674-5906.2020.01.003
卢乔倩1( ), 江涛1,*(), 柳丹丽1, 刘智勇2
收稿日期:2019-10-12
出版日期:2020-01-18
发布日期:2020-03-09
通讯作者:
* 江涛(1965年生),女,副教授,主要研究方向为水资源与环境。E-mail: eesjt@mail.sysu.edu.cn作者简介:卢乔倩(1997年生),女,硕士研究生,主要研究方向为生态与环境水文学。E-mail: luqq5@mail2.sysu.edu.cn
基金资助:
LU Qiaoqian1(), JIANG Tao1,*(), LIU Danli1, LIU Zhiyong2
Received:2019-10-12
Online:2020-01-18
Published:2020-03-09
摘要:
基于1982—2012年植被生长季(4—10月)GIMMS NDVI 3g数据集、中国气象数据网同时期气温与降水月值0.5°×0.5°格点数据集(V 2.0)和MODIS土地覆盖产品,运用GIS和相关统计方法,对中国长时间较为稳定的8种典型植被覆盖类型(常绿阔叶林、落叶阔叶林、混交林、开放灌丛、多树的草原、草原、作物以及作物和自然植被的镶嵌体)NDVI与气温和降水的时空响应特征进行研究。结果表明,除西南部分地区和西北小部分裸地或低植被覆盖地区外,其他地区多年生长季平均NDVI与平均气温呈显著正相关;西藏南部和华南大部分地区植被NDVI与降水呈负相关,强降水会对植物生长产生一定阻碍作用,其他地区多年生长季平均NDVI与平均降水呈显著正相关;从植被覆盖类型上看,除常绿阔叶林和多树的草原外,其他植被覆盖类型与气温、降水均呈正相关关系,其中落叶阔叶林、开放灌丛和草原与气温和降水均呈较高的正相关,且对气温的响应比对降水强烈;NDVI对气温和降水的响应具有空间异质性,不同植被覆盖类型NDVI与气温和降水的相关性不同,相同植被覆盖类型NDVI在不同地区的相关性也不同,分布在西南地区的常绿阔叶林NDVI与气温呈正相关,而分布在华南、台湾地区的常绿阔叶林NDVI与气温呈负相关,暖湿西南季风可能是造成差异的原因;植被NDVI对气温、降水的响应存在时滞效应,对降水的时滞效应更为显著,不同植被覆盖类型NDVI对气温和降水的滞后期不同,在生长季末期,落叶阔叶林NDVI对气温的响应滞后期约为1个月,西南开放灌丛和华北草原带NDVI对降水的响应滞后期为1—2个月。研究结果可为中国陆地生态环境建设及保护提供理论依据。
中图分类号:
卢乔倩, 江涛, 柳丹丽, 刘智勇. 中国不同植被覆盖类型NDVI对气温和降水的响应特征[J]. 生态环境学报, 2020, 29(1): 23-34.
LU Qiaoqian, JIANG Tao, LIU Danli, LIU Zhiyong. The Response Characteristics of NDVI with Different Vegetation Cover Types to Temperature and Precipitation in China[J]. Ecology and Environment, 2020, 29(1): 23-34.
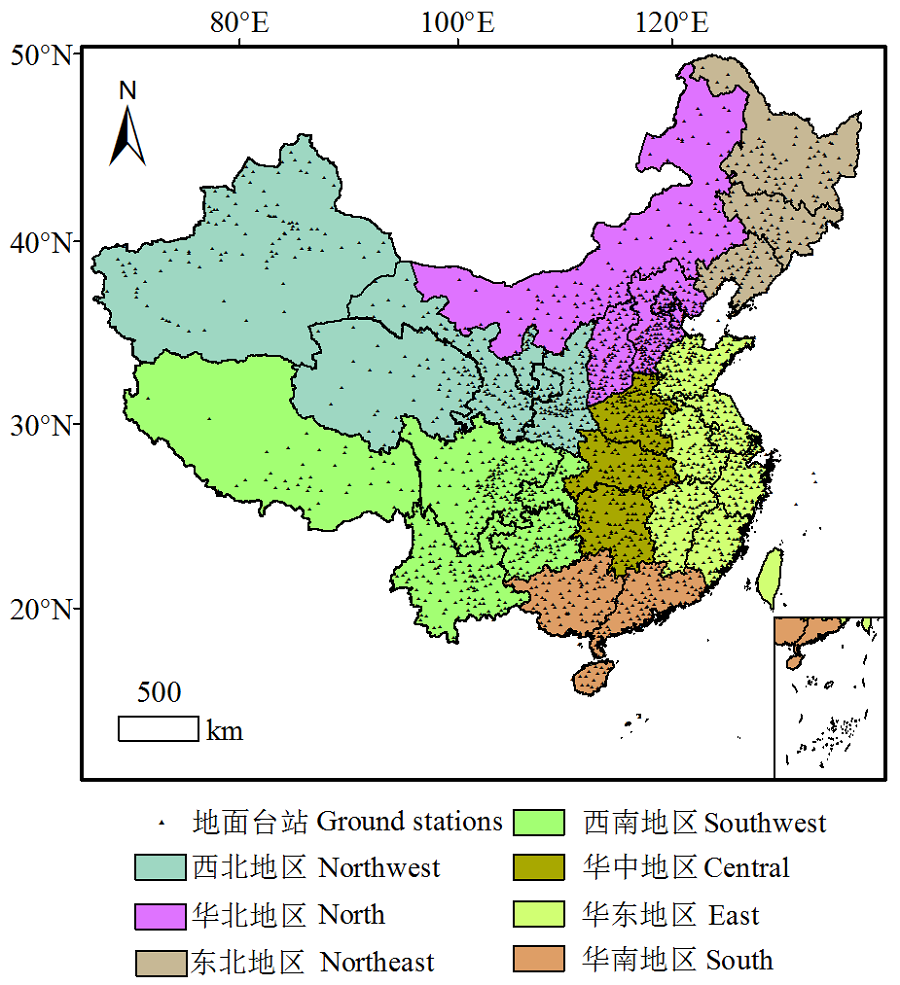
图1 中国七大区域分布图 中国版图矢量数据来自全国地理信息资源目录服务系统http://www.webmap.cn/main.do?method=index
Fig. 1 Distribution map of 7 regions of China
| 月份 Month | 月气温 Temperature/℃ | 月降水 Precipitation/mm |
|---|---|---|
| 4 | 8.6 | 43.2 |
| 5 | 14 | 64.9 |
| 6 | 17.6 | 101.2 |
| 7 | 19.8 | 132.8 |
| 8 | 18.7 | 94.8 |
| 9 | 13.8 | 70.7 |
| 10 | 6.9 | 28.7 |
表1 1982—2012年全国生长季月平均气温、降水值
Table 1 Monthly mean temperature and precipitation over China for the period 1982?2012
| 月份 Month | 月气温 Temperature/℃ | 月降水 Precipitation/mm |
|---|---|---|
| 4 | 8.6 | 43.2 |
| 5 | 14 | 64.9 |
| 6 | 17.6 | 101.2 |
| 7 | 19.8 | 132.8 |
| 8 | 18.7 | 94.8 |
| 9 | 13.8 | 70.7 |
| 10 | 6.9 | 28.7 |
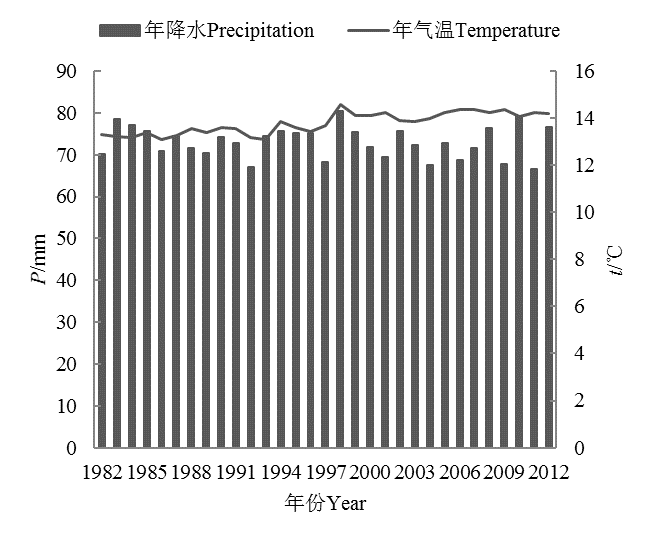
图2 1982—2012年生长季全国气温(t)、降水量(P)年际变化
Fig. 2 Annual variation of temperature and precipitation during the growing season in China in 1982?2012

图3 2001—2011年中国植被覆盖类型图
Fig. 3 Vegetation cover types across China over the period 2001?2011
| 植被覆盖类型 Vegetation types | 最小值 Minimum values | 最大值 Maximum values | 平均值 Mean values |
|---|---|---|---|
| 常绿阔叶林 Evergreen Broadleaf forest | 0.7102 | 0.7968 | 0.7494 |
| 落叶阔叶林 Deciduous Broadleaf forest | 0.6854 | 0.7832 | 0.7492 |
| 混交林 Mixed forest | 0.6954 | 0.7662 | 0.7298 |
| 多树的草原 Woody savannas | 0.6774 | 0.7568 | 0.7131 |
| 作物和自然植被的镶嵌体 Cropland/Natural vegetation mosaic | 0.6587 | 0.7074 | 0.6799 |
| 作物 Croplands | 0.5375 | 0.6014 | 0.5734 |
| 草原 Grasslands | 0.3465 | 0.3850 | 0.3666 |
| 开放灌丛 Open shrublands | 0.1119 | 0.1314 | 0.1211 |
表2 1982—2012年全国生长季不同植被覆盖类型NDVI最大值、最小值和平均值
Table 2 Maximum values, minimum values and mean values of NDVI for different vegetation cover types during the growing season in China in 1982?2012
| 植被覆盖类型 Vegetation types | 最小值 Minimum values | 最大值 Maximum values | 平均值 Mean values |
|---|---|---|---|
| 常绿阔叶林 Evergreen Broadleaf forest | 0.7102 | 0.7968 | 0.7494 |
| 落叶阔叶林 Deciduous Broadleaf forest | 0.6854 | 0.7832 | 0.7492 |
| 混交林 Mixed forest | 0.6954 | 0.7662 | 0.7298 |
| 多树的草原 Woody savannas | 0.6774 | 0.7568 | 0.7131 |
| 作物和自然植被的镶嵌体 Cropland/Natural vegetation mosaic | 0.6587 | 0.7074 | 0.6799 |
| 作物 Croplands | 0.5375 | 0.6014 | 0.5734 |
| 草原 Grasslands | 0.3465 | 0.3850 | 0.3666 |
| 开放灌丛 Open shrublands | 0.1119 | 0.1314 | 0.1211 |
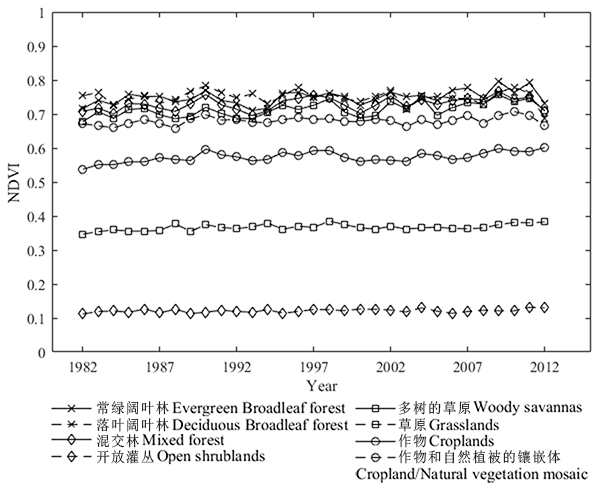
图4 1982—2012年全国生长季不同植被覆盖类型NDVI变化情况
Fig. 4 Changes of NDVI for different vegetation cover types during the growing season in China in 1982?2012
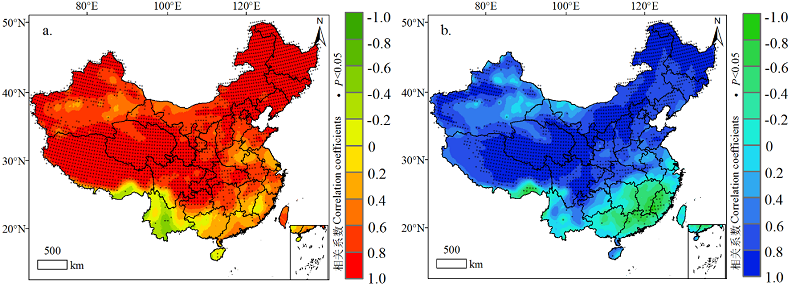
图5 1982—2012年生长季平均NDVI与气温、降水相关性空间分布
Fig. 5 Spatial distribution of correlation between average NDVI and temperature/precipitation during growing season in 1982?2012
| 植被覆盖类型 Vegetation cover types | 气温 Temperature | 降水 Precipitation |
|---|---|---|
| 常绿阔叶林 Evergreen Broadleaf forest | 0.0845 | -0.3104 |
| 落叶阔叶林 Deciduous Broadleaf forest | 0.9077** | 0.809* |
| 混交林 Mixed forest | 0.5614 | 0.3324 |
| 开放灌丛 Open shrublands | 0.8471* | 0.7232 |
| 多树的草原 Woody savannas | 0.292 | -0.078 |
| 草原 Grasslands | 0.8528* | 0.7989 |
| 作物 Croplands | 0.7033 | 0.5805 |
| 作物和自然植被的镶嵌体Cropland/Natural vegetation mosaic | 0.6249 | 0.4837 |
表3 1982—2012年生长季8种植被覆盖类型平均NDVI与气温、降水的相关系数
Table 3 Correlation coefficients between mean NDVI and temperature/precipitation for 8 vegetation cover types during the growing season in China in 1982?2012
| 植被覆盖类型 Vegetation cover types | 气温 Temperature | 降水 Precipitation |
|---|---|---|
| 常绿阔叶林 Evergreen Broadleaf forest | 0.0845 | -0.3104 |
| 落叶阔叶林 Deciduous Broadleaf forest | 0.9077** | 0.809* |
| 混交林 Mixed forest | 0.5614 | 0.3324 |
| 开放灌丛 Open shrublands | 0.8471* | 0.7232 |
| 多树的草原 Woody savannas | 0.292 | -0.078 |
| 草原 Grasslands | 0.8528* | 0.7989 |
| 作物 Croplands | 0.7033 | 0.5805 |
| 作物和自然植被的镶嵌体Cropland/Natural vegetation mosaic | 0.6249 | 0.4837 |
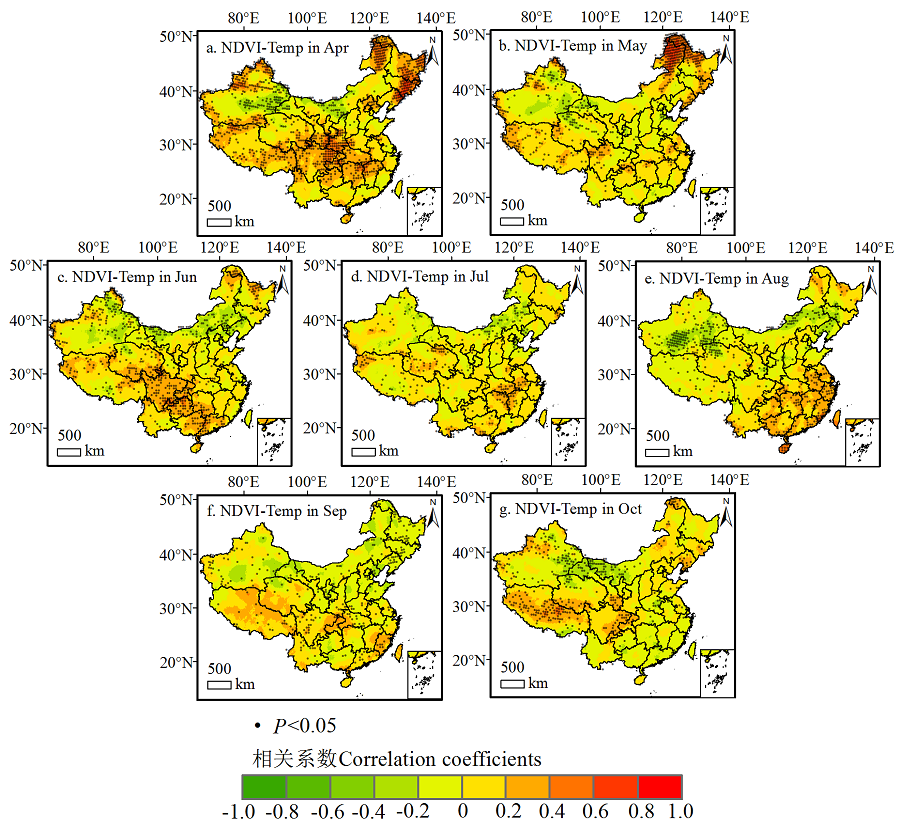
图6 NDVI与同月份气温相关性分布图
Fig. 6 Correlation distribution of NDVI and temperature for each month of the growing season
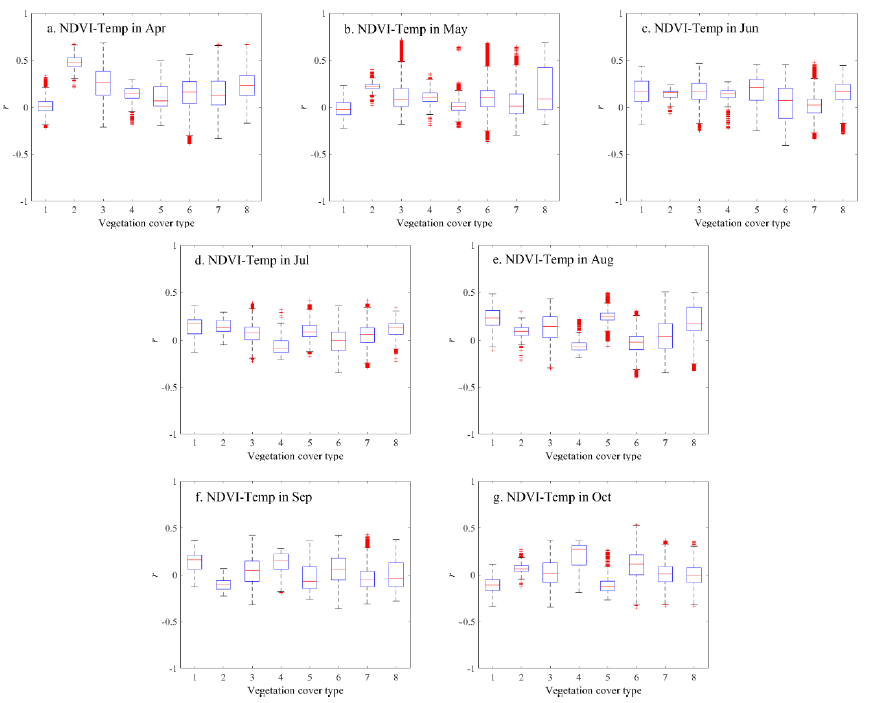
图7 NDVI与同月份气温相关性箱形图 横坐标植被覆盖类型对应关系为1-常绿阔叶林,2-落叶阔叶林,3-混交林,4-开放灌丛,5-多树的草原,6-草原,7-作物,8-作物和自然植被的镶嵌体。下同
Fig. 7 Boxplot of correlation between NDVI and temperature for each month of the growing season The corresponding relationship of vegetation cover types in abscissa is 1-Evergreen Broadleaf forest, 2-Deciduous Broadleaf forest, 3-Mixed forest, 4-Open shrublands, 5-Woody savannas, 6-Grasslands, 7-Croplands, 8-Cropland/Natural vegetation mosaic. The same below
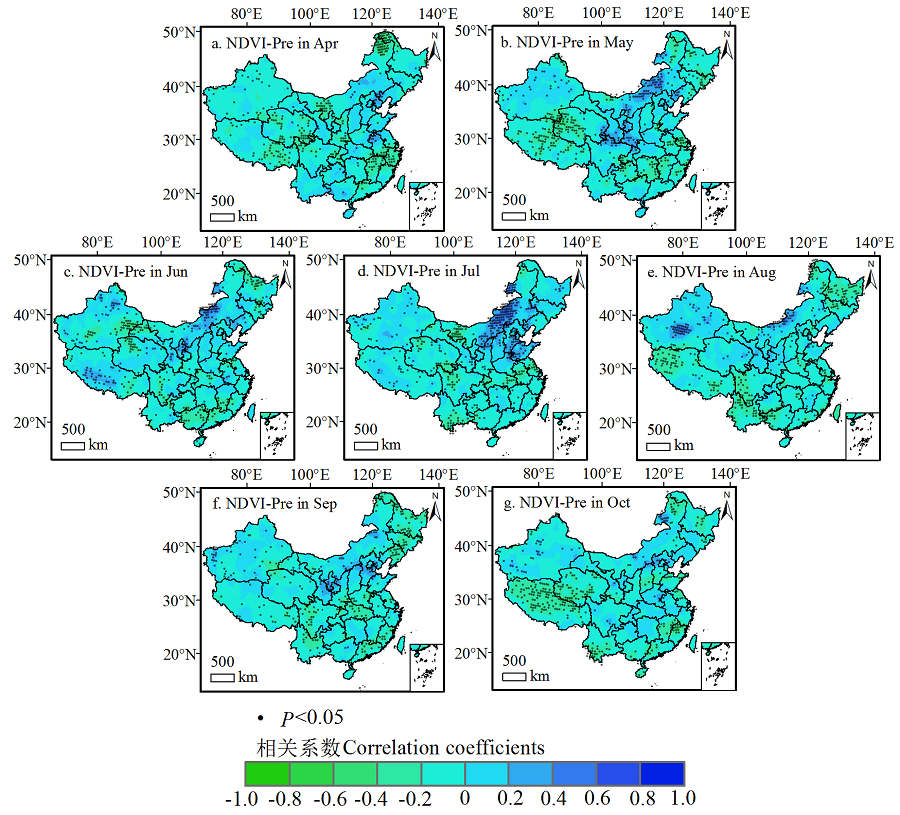
图8 NDVI与同月份降水相关性分布图
Fig. 8 Correlation distribution of NDVI and precipitation for each month of the growing season
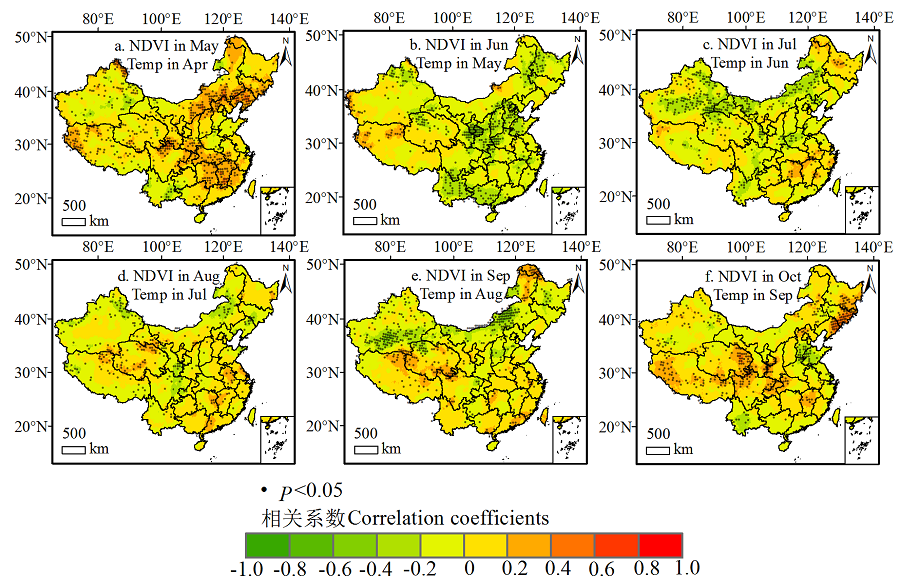
图9 滞后时间为1个月的NDVI与气温相关性分布图
Fig. 9 Correlation distribution of NDVI and temperature with 1 month lag
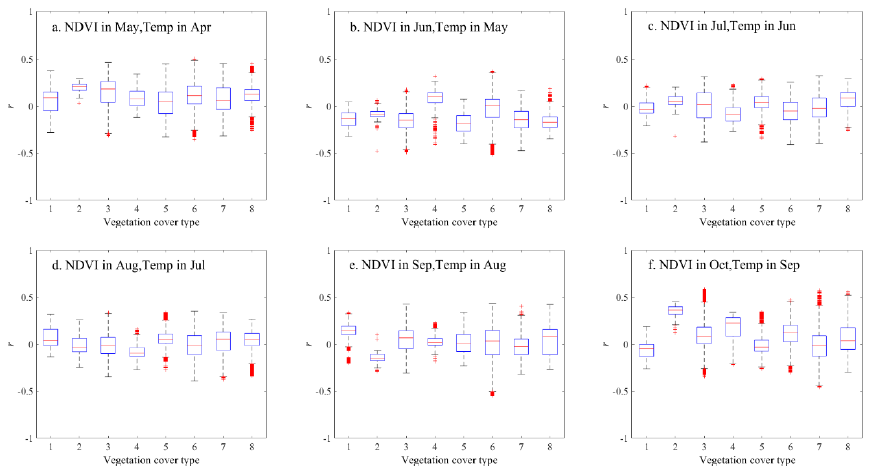
图10 滞后时间为1个月的NDVI与气温相关性箱形图
Fig. 10 Boxplot of correlation between NDVI and temperature with 1 month lag
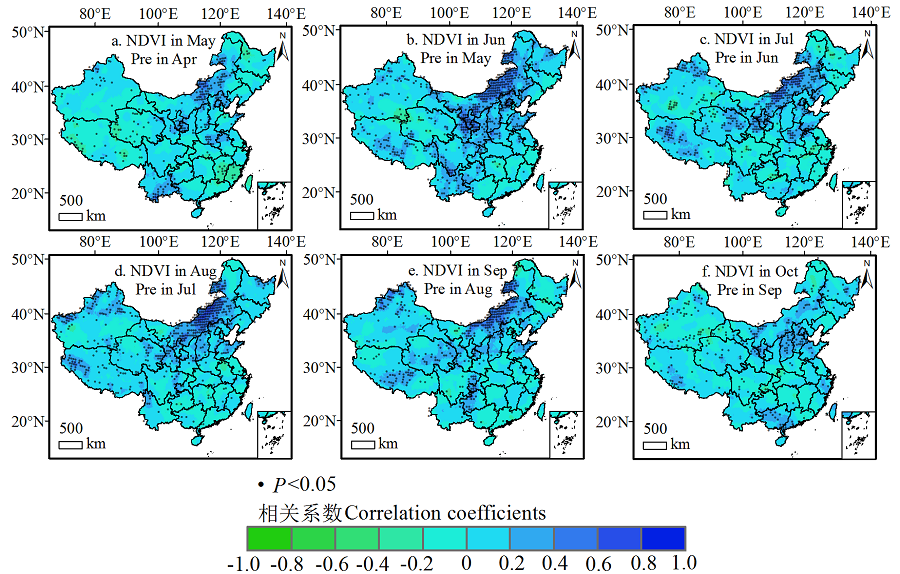
图11 滞后时间为1个月的NDVI与降水相关性分布图
Fig. 11 Correlation distribution of NDVI and precipitation with 1 month lag
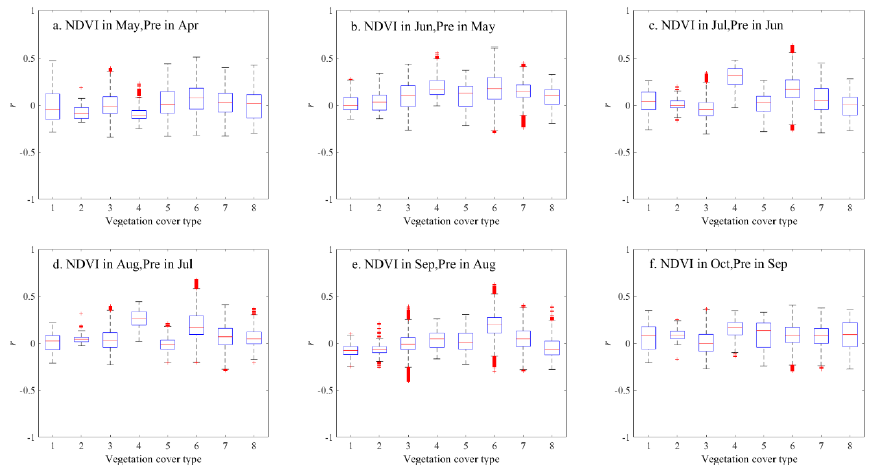
图12 滞后时间为1个月的NDVI与降水相关性箱形图
Fig. 12 Boxplot of correlation between NDVI and precipitation with 1 month lag
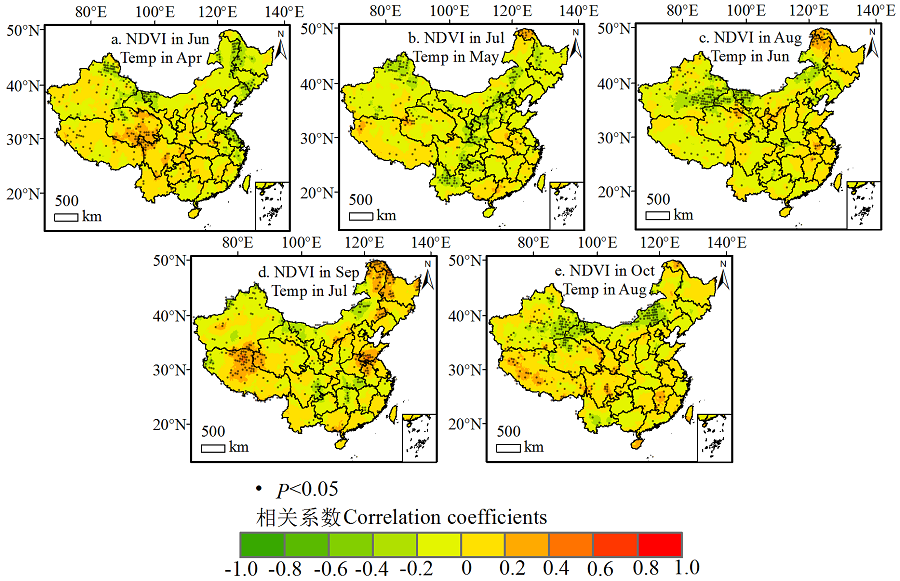
图13 滞后时间为2个月的NDVI与气温相关性分布图
Fig. 13 Correlation distribution of NDVI and temperature with 2 months lag
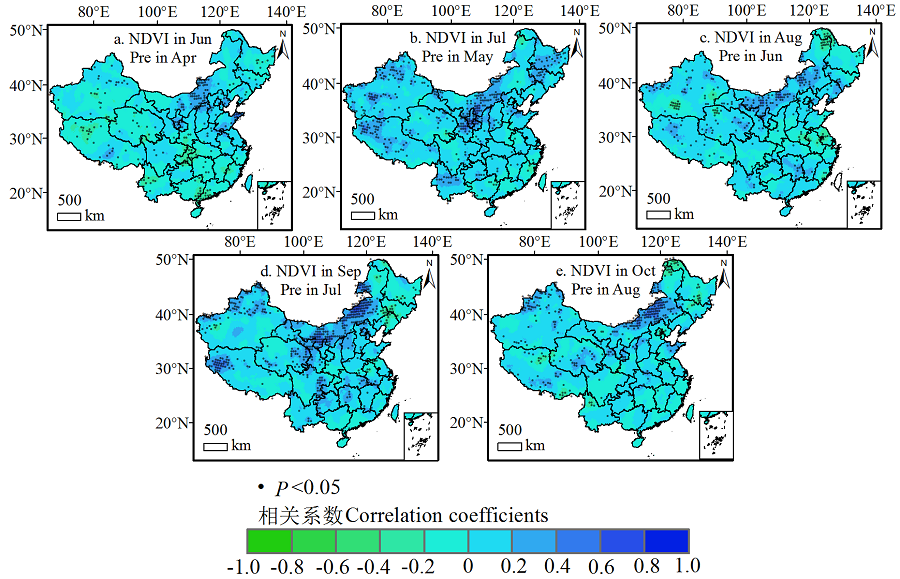
图14 滞后时间为2个月的NDVI与降水相关性分布图
Fig. 14 Correlation distribution of NDVI and precipitation with 2 months lag
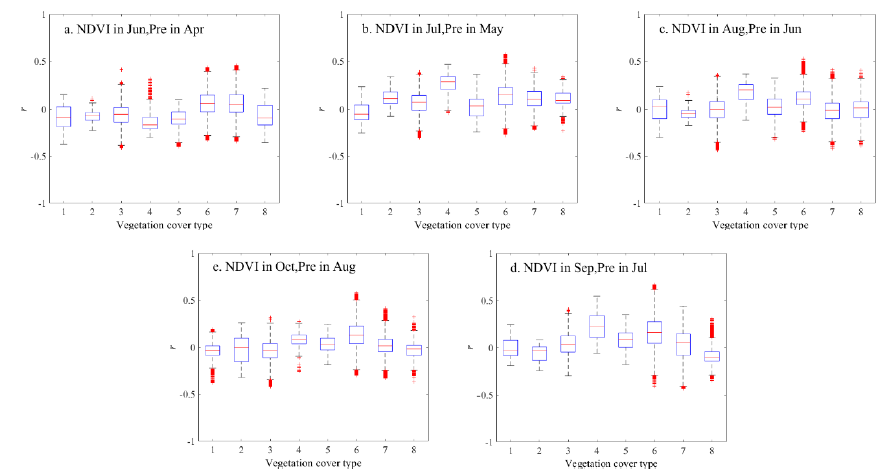
图15 滞后时间为2个月的NDVI与降水相关性箱形图
Fig. 15 Boxplot of correlation between NDVI and precipitation with 2 months lag
| [1] |
BAO Y J, SONG G B, LI Z H, et al., 2007. Study on the spatial differences and its time lag effect on climatic factors of the vegetation in the Longitudinal Range-Gorge Region[J]. Chinese Science Bulletin, 52(SuppⅡ): 42-49.
DOI URL |
| [2] |
FRIEDL M A, MCIVER D K, HODGES J C R, et al., 2002. Global land cover mapping from MODIS: algorithms and early results[J]. Remote sensing of Environment, 83(1-2): 287-302.
DOI URL |
| [3] |
JIANG L L, JIAPAER G, BAO A M, et al., 2017. Vegetation dynamics and responses to climate change and human activities in Central Asia[J]. Science of the Total Environment, 599-600: 967-980.
DOI URL |
| [4] |
LAMCHIN M, LEE W K, JEON S W, et al., 2018. Long-term trend and correlation between vegetation greenness and climate variables in Asia based on satellite data[J]. Science of the Total Environment, 618: 1089-1095.
DOI URL |
| [5] |
LIU Z Y, LI C, ZHOU P, et al., 2016. A probabilistic assessment of the likelihood of vegetation drought under varying climate conditions across China[J]. Scientific Reports, 6(35105): 1-10.
DOI URL |
| [6] |
NEMANI R R, KEELING C D, HASHIMOTO H, et al., 2003. Climate-driven increases in global terrestrial net primary production from 1982 to 1999 [J]. Science, 300(5625): 1560-1563.
DOI URL |
| [7] | WANG X, PIAO S L, CIAIS P, et al., 2011. Spring temperature change and its implication in the change of vegetation growth in North America from 1982 to 2006 [J]. Proceedings of the National Academy of Sciences of the United States of America, 108(4): 1240-1245. |
| [8] |
WEN Z F, WU S J, CHEN J L, et al., 2017. NDVI indicated long-term interannual changes in vegetation activities and their responses to climatic and anthropogenic factors in the Three Gorges Reservoir Region, China[J]. Science of the Total Environment, 574: 947-959.
DOI URL |
| [9] |
WU D H, ZHAO X, LIANG S L, et al., 2015. Time-lag effects of global vegetation responses to climate change[J]. Global Change biology, 21(9): 3520-3531.
DOI URL |
| [10] | 崔林丽, 史军, 2011. 中国华东及其周边地区NDVI对气温和降水的月际响应特征[J]. 自然资源学报, 26(12): 2121-2130. |
| CUI L L, SHI J, 2011. Inter-monthly Response Characteristics of NDVI to the Variation of Temperature and Precipitation in East China and Its Surrounding Areas[J]. Journal of Natural Resources, 26(12): 2121-2130. | |
| [11] | 高江波, 焦珂伟, 吴绍洪, 2019. 1982-2013年中国植被NDVI空间异质性的气候影响 (英文)[J]. Acta Geographica Sinica, 29(10): 1597-1609. |
| GAO J B, JIAO K W, WU S H, 2019. Revealing the climatic impacts on spatial heterogeneity of NDVI in China during 1982-2013 [J]. Acta Geographica Sinica, 29(10): 1597-1609. | |
| [12] | 郭志华, 刘祥梅, 肖文发, 等, 2007. 基于GIS的中国气候分区及综合评价[J]. 资源科学, 29(6): 2-9. |
| GUO Z H, LIU X M, XIAO W F, et al., 2007. Regionalization and Integrated Assessment of Climate Resource in China based on GIS[J]. Resources Science, 29(6): 2-9. | |
| [13] | 何全军, 2019. 基于MODIS数据的珠三角地区NDVI时空变化特征及对气象因素的响应[J]. 生态环境学报, 28(9): 1722-1730. |
| HE Q J, 2019. Spatio-temporal Variation of NDVI and Its Response to Meteorological Factors in Pearl River Delta Based on MODIS Data[J]. Ecology and Environment, 28(9): 1722-1730. | |
| [14] | 何月, 樊高峰, 张小伟, 等, 2012. 浙江省植被NDVI动态及其对气候的响应[J]. 生态学报, 32(14): 4352-4362. |
|
HE Y, FAN G F, ZHANG X W, et al., 2012. Variation of vegetation NDVI and its response to climate change in Zhejiang Province[J]. Acta Ecologica Sinica, 32(14): 4352-4362.
DOI URL |
|
| [15] | 何云玲, 李同艳, 熊巧利, 等, 2018. 2000-2016年云南地区植被覆盖时空变化及其对水热因子的响应[J]. 生态学报, 38(24): 8813-8821. |
| HE Y L, LI T Y, XIONG Q L, et al., 2018. Spatio-temporal patterns of vegetation coverage and response to hydrothermal factors in Yunnan province, China[J]. Acta Ecologica Sinica, 38(24): 8813-8821. | |
| [16] | 黄文琳, 张强, 孔冬冬, 等, 2019. 1982-2013年内蒙古地区植被物候对干旱变化的响应[J]. 生态学报, 39(13): 4953-4965. |
| HUANG W L, ZHANG Q, KONG D D, et al., 2019. Response of vegetation phenology to drought in Inner Mongolia from 1982 to 2013 [J]. Acta Ecologica Sinica, 39(13): 4953-4965. | |
| [17] | 李舒婷, 周艺, 王世新, 等, 2019. 2001-2015年内蒙古NDVI时空变化及其对降水和气温的响应[J]. 中国科学院大学学报, 36(1): 48-55. |
| LI S T, ZHOU Y, WANG S X, et al., 2019. Spatial-temporal variation of NDVI and its responses to precipitation and temperature in Inner Mongolia from 2001 to 2015 [J]. Journal of University of Chinese Academy of Sciences, 36(1): 48-55. | |
| [18] | 李晓兵, 史培军, 2000. 中国典型植被类型NDVI动态变化与气温、降水变化的敏感性分析[J]. 植物生态学报, 24(3): 379-382. |
| LI X B, SHI P J, 2000. Sensitivity analysis of variation in ndvi, temperature and precipitation in typical vegetation types across China[J]. Chinese Journal of Plant Ecology, 24(3): 379-382. | |
| [19] | 刘家福, 马帅, 李帅, 等, 2018. 1982-2016年东北黑土区植被NDVI动态及其对气候变化的响应[J]. 生态学报, 38(21): 7647-7657. |
| LIU J F, MA S, LI S, et al., 2018. Changes in vegetation NDVI from 1982 to 2016 and its responses to climate change in the black-soil area of Northeast China[J]. Acta Ecologica Sinica, 38(21): 7647-7657. | |
| [20] | 刘明光, 2000. 中国自然地理图集[M]. 第2版. 北京: 中国地图出版社. |
| LIU M G, 2000. Atlas of natural geography of China[M]. The second edition. Beijing: Sino Maps Press. | |
| [21] | 马士彬, 安裕伦, 杨广斌, 等, 2016. 喀斯特地区不同植被类型NDVI变化及驱动因素分析--以贵州为例[J]. 生态环境学报, 25(7): 1106-1114. |
| MA S B, AN Y L, YANG G B, et al., The analysis of the difference vegetation variation and driver factors on NDVI change in Karst Region: A case on Guizhou[J]. Ecology and Environment, 25(7): 1106-1114. | |
| [22] | 马守存, 保广裕, 郭广, 等, 2018. 1982-2013年黄河源区植被变化趋势及其对气候变化的响应[J]. 干旱气象, 36(2): 226-233. |
| MA S C, BAO G Y, GUO G, et al., 2018. Change Trend of Vegetation and Its Responses to Climate Change in the Source Region of the Yellow River[J]. Arid Meteorology, 36(2): 226-233. | |
| [23] | 史丹丹, 杨涛, 胡金明, 等, 2018. 基于NDVI的黄河源区生长季植被时空变化及其与气候因子的关系[J]. 山地学报, 36(2): 184-193. |
| SHI D D, YANG T, HU J M, et al., 2018. Spatio-temporal variation of NDVI-based wegetation during the growing-season and its relation with climatic factors in the Yellow River Source Region[J]. Mountain Research, 36(2): 184-193. | |
| [24] | 田义超, 梁铭忠, 2016. 北部湾沿海地区植被覆盖对气温和降水的旬响应特征[J]. 自然资源学报, 31(3): 488-502. |
| TIAN Y C, LIANG M Z, 2016. The NDVI Characteristics of Vegetation and Its Ten-day Response to Temperature and Precipitation in Beibu Gulf Coastal Region[J]. Journal of Natural Resources, 31(3): 488-502. | |
| [25] | 王茜, 陈莹, 阮玺睿, 等, 2017. 1982-2012年中国NDVI变化及其与气候因子的关系[J]. 草地学报, 25(4): 691-700. |
| WANG Q, CHEN Y, RUAN X R, et al., 2017. The Changes of NDVI in China from 1982 to 2012 and Its Relationship with Climatic Factors[J]. Acta Agrestia Sinica, 25(4): 691-700. | |
| [26] | 武正丽, 贾文雄, 赵珍, 等, 2015. 2000-2012年祁连山植被覆盖变化及其与气候因子的相关性[J]. 干旱区地理, 38(6): 241-1252. |
| WU Z L, JIA W X, ZHAO Z, et al., 2015. Spatial-temporal variations of vegetation and its correlation with climatic factors in Qilian Mountains from 2000 to 2012 [J]. Arid Land Geography, 38(6): 241-1252. | |
| [27] | 熊巧利, 何云玲, 李同艳, 等, 2019. 西南地区生长季植被覆盖时空变化特征及其对气候与地形因子的响应[J]. 水土保持研究, 26(6): 259-266. |
| XIONG Q L, HE Y L, LI T Y, et al., 2019. Spatiotemporal patterns of vegetation coverage and response to climatic and topographic factors in growth season in southwest China[J]. Research of Soil and Water Conservation, 26(6): 259-266. | |
| [28] | 许翔驰, 2019. 中国植被时空变化特征[J]. 哈尔滨师范大学自然科学学报, 35(2): 100-104. |
| XU X C, 2019. Spatial and Temporal Change Characteristics of Vegetation in China[J]. Natural Science Journal of Harbin Normal University, 35(2): 100-104. | |
| [29] | 张景华, 封志明, 姜鲁光, 等, 2015. 澜沧江流域植被NDVI于气候因子的相关性分析[J]. 自然资源学报, 30(9): 1425-1435. |
| ZHANG J H, FENG Z M, JIANG L G, et al., 2015. Analysis of the Correlation between NDVI and Climate Factors in the Lancang River Basin[J]. Journal of Natural Resources, 30(9): 1425-1435. | |
| [30] | 吴征镒, 1980. 中国植被[M]. 北京: 科学出版社. |
| WU Z Y, Chinese Vegetation[M]. Beijing: Science Press. | |
| [31] | 周金霖, 马明国, 肖青, 等, 2017. 西南地区植被覆盖动态及其与气候因子的关系[J]. 遥感技术与应用, 32(5): 66-972. |
| ZHOU J L, MA M G, XIAO Q, et al., 2017. Vegetation Dynamics and Its Relationship with Climatic Factors in Southwestern China[J]. Remote Sensing Technology and Application, 32(5): 66-972. |
| [1] | 巫晨煜, 许帆帆, 魏士博, 樊晶晶, 刘观鹏, 王坤. 渭河流域地表植被覆盖对气候变化的响应研究[J]. 生态环境学报, 2023, 32(5): 835-844. |
| [2] | 葛元凯, 赵龙龙, 陈劲松, 任彦霓, 李洪忠. 1983-2020年西南地区气象干旱时空演变趋势及干旱事件识别[J]. 生态环境学报, 2023, 32(5): 920-932. |
| [3] | 刘紫薇, 葛继稳, 王月环, 杨诗雨, 姚东, 谢金林. 大九湖泥炭湿地甲烷通量变异特征及影响因素[J]. 生态环境学报, 2023, 32(4): 706-714. |
| [4] | 李晖, 李必龙, 葛黎黎, 韩琛惠, 杨倩, 张岳军. 2000-2021年汾河流域植被时空演变特征及地形效应[J]. 生态环境学报, 2023, 32(3): 439-449. |
| [5] | 贾志峰, 刘鹏程, 刘宇, 吴博博, 陈丹姿, 张向飞. 气候变化和人类活动对松辽流域植被覆盖的影响[J]. 生态环境学报, 2023, 32(1): 1-10. |
| [6] | 李威闻, 黄金权, 齐瑜洁, 刘小岚, 刘纪根, 毛治超, 高绣纺. 土壤侵蚀条件下土壤微生物生物量碳含量变化及其影响因素的Meta分析[J]. 生态环境学报, 2023, 32(1): 47-55. |
| [7] | 韩翠, 康扬眉, 余海龙, 李冰, 黄菊莹. 荒漠草原凋落物分解过程中降水量对土壤酶活性的影响[J]. 生态环境学报, 2022, 31(9): 1802-1812. |
| [8] | 崔乔, 李宗省, 张百娟, 赵越, 南富森. 冻融作用对土壤可溶性碳氮和微生物量碳氮含量影响的荟萃分析[J]. 生态环境学报, 2022, 31(8): 1700-1712. |
| [9] | 陈文裕, 夏丽华, 徐国良, 余世钦, 陈行, 陈金凤. 2000—2020年珠江流域NDVI动态变化及影响因素研究[J]. 生态环境学报, 2022, 31(7): 1306-1316. |
| [10] | 孙梦鑫, 张岳, 辛宇, 钟鼎杰, 杨存建. 川西高原近20 a植被物候变化及其对气候变化的响应[J]. 生态环境学报, 2022, 31(7): 1326-1339. |
| [11] | 柯奇画, 张科利. 基于文献计量的中国水土流失尺度效应研究进展[J]. 生态环境学报, 2022, 31(7): 1489-1498. |
| [12] | 曹晓云, 祝存兄, 陈国茜, 孙树娇, 赵慧芳, 朱文彬, 周秉荣. 2000—2021年柴达木盆地地表绿度变化及地形分异研究[J]. 生态环境学报, 2022, 31(6): 1080-1090. |
| [13] | 孙建波, 畅文军, 李文彬, 张世清, 李春强, 彭明. 香蕉不同生育期根际微生物生物量及土壤酶活的变化研究[J]. 生态环境学报, 2022, 31(6): 1169-1174. |
| [14] | 李春环, 王攀, 余海龙, 李冰, 黄菊莹. 西北荒漠煤矿区降水降尘中盐基离子沉降特征及其效应研究[J]. 生态环境学报, 2022, 31(5): 969-978. |
| [15] | 易嘉慧, 何超, 杨璐, 叶志祥, 田雅, 柯碧钦, 慕航, 涂佩玥, 韩超然, 洪松. COVID-19疫情期间全球气温和主要大气污染物浓度变化的空间关联[J]. 生态环境学报, 2022, 31(4): 740-749. |
| 阅读次数 | ||||||
|
全文 |
|
|||||
|
摘要 |
|
|||||