生态环境学报 ›› 2023, Vol. 32 ›› Issue (4): 706-714.DOI: 10.16258/j.cnki.1674-5906.2023.04.008
刘紫薇1,2,3( ), 葛继稳1,2,3,*(), 王月环1,3, 杨诗雨1,2,3, 姚东1,3, 谢金林1,3
收稿日期:2022-11-03
出版日期:2023-04-18
发布日期:2023-07-12
通讯作者:
*葛继稳,E-mail: gejiwen@cug.edu.cn作者简介:刘紫薇(1996年生),女,博士研究生,研究方向为湿地生态学。E-mail: liuziwei@cug.edu.cn
基金资助:
LIU Ziwei1,2,3(), GE Jiwen1,2,3,*(), WANG Yuehuan1,3, YANG Shiyu1,2,3, YAO Dong1,3, XIE Jinlin1,3
Received:2022-11-03
Online:2023-04-18
Published:2023-07-12
摘要:
研究选取神农架大九湖泥炭湿地作为研究对象,基于2016-2019年涡度相关设备观测数据,分析大九湖泥炭湿地CH4通量变异特征及其影响因素。结果表明,大九湖泥炭湿地是“CH4源”,CH4年排放量呈逐年上升趋势。大九湖泥炭湿地CH4排放呈现以下规律:年尺度来看,CH4排放量呈先上升后下降的趋势,高排放量集中在夏季;日尺度来看,CH4高排放量集中在白天,CH4昼通量高于夜通量。2016-2019,年昼通量百分比分别达到57.76%、59.09%、61.34%、50.84%,为大九湖泥炭湿地CH4通量主要组成部分。昼通量占比最大值分别为74.59%、81.85%、67.22%及70.12%,主要发生在春季;夜通量占比最大值分别为48.82%、50.54%、44.59%及54.31%,主要出现在夏季,该现象可能与春季昼夜温差较大而夏季昼夜温差较小有关。CH4通量与气象因子相关性分析结果表明,整体上来看,大九湖泥炭湿地CH4通量与气温(ta)和土壤温度(ts)呈正相关(r=0.61,P=0.000;r=0.59,P=0.000),与表层土壤含水率(SWC)呈负相关性(r= ?0.24,P=0.000)。路径分析和多元线性回归分析结果表明,ts、ta和光合有效辐射(PAR)是影响昼通量的主要因子,其中ts的影响最重要(标准化系数=0.418,P=0.000);ts、ta和SWC对夜通量更具调节作用,其中ta的影响最显著(标准化系数=0.246,P=0.000)。2016-2019年,研究区内SWC年际变化范围分别为29.99%-81.70%、61.88%-80.76%、61.38%-81.35%、54.95%-80.17%,年均值为70.35%、78.23%、77.82%、68.10%,2016年和2019年波动频繁,幅度较大,2017年和2018年较为平稳。结合一元线性回归结果得出,SWC波动频繁时,ts对CH4通量呈现更强的指示作用,SWC相对稳定时,ta更具有指示意义。
中图分类号:
刘紫薇, 葛继稳, 王月环, 杨诗雨, 姚东, 谢金林. 大九湖泥炭湿地甲烷通量变异特征及影响因素[J]. 生态环境学报, 2023, 32(4): 706-714.
LIU Ziwei, GE Jiwen, WANG Yuehuan, YANG Shiyu, YAO Dong, XIE Jinlin. Variation Pattern and Influential Factors of Methane Flux in the Dajiuhu Peatland[J]. Ecology and Environment, 2023, 32(4): 706-714.
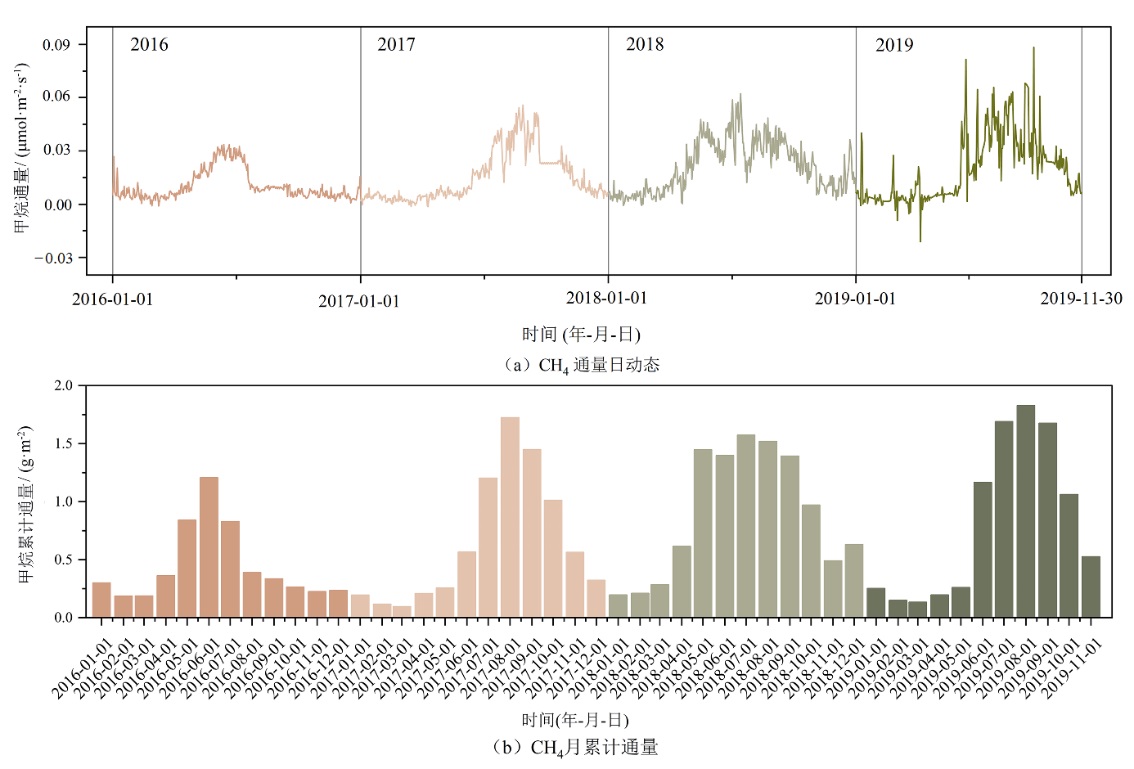
图1 2016-2019年大九湖泥炭湿地CH4通量日动态(a)和月累积特征(b)
Figure 1 Daily dynamics (a) and monthly cumulation (b) of methane emitted from the Dajiuhu peatland in 2016?2019
| 年份 | 日均通量/ (μmol∙m−2∙d−1) | 通量极大值/ (μmol∙m−2∙d−1) | 通量极小值/ (μmol∙m−2∙d−1) | 年排放量/ (g∙m−2∙a−1) | 年昼排放量/ (g∙m−2∙a−1) | 年夜排放量/ (g∙m−2∙a−1) | 昼 (夜) 通量占比极大 (小) 值/% | 夜 (昼) 通量占比极大 (小) 值/% | 昼通量占比/% | 夜通量占比/% |
|---|---|---|---|---|---|---|---|---|---|---|
| 2016 | 912.96 | 2916.72 | −70.08 | 5.35 | 3.09 | 2.26 | 74.59 | 48.82 | 57.76 | 42.24 |
| 2017 | 1318.08 | 4832.88 | −109.68 | 7.70 | 4.55 | 3.14 | 81.85 | 50.54 | 59.09 | 40.91 |
| 2018 | 1834.56 | 5387.28 | −49.20 | 10.71 | 6.57 | 4.14 | 67.22 | 44.59 | 61.34 | 39.66 |
| 2019 | 1670.88 | 7650.72 | −1796.16 | 8.93 | 4.54 | 4.39 | 70.12 | 54.31 | 50.84 | 49.16 |
表1 2016-2019年大九湖泥炭湿地甲烷通量
Table 1 The methane emissions of the Dajiuhu peatland from 2016 to 2019
| 年份 | 日均通量/ (μmol∙m−2∙d−1) | 通量极大值/ (μmol∙m−2∙d−1) | 通量极小值/ (μmol∙m−2∙d−1) | 年排放量/ (g∙m−2∙a−1) | 年昼排放量/ (g∙m−2∙a−1) | 年夜排放量/ (g∙m−2∙a−1) | 昼 (夜) 通量占比极大 (小) 值/% | 夜 (昼) 通量占比极大 (小) 值/% | 昼通量占比/% | 夜通量占比/% |
|---|---|---|---|---|---|---|---|---|---|---|
| 2016 | 912.96 | 2916.72 | −70.08 | 5.35 | 3.09 | 2.26 | 74.59 | 48.82 | 57.76 | 42.24 |
| 2017 | 1318.08 | 4832.88 | −109.68 | 7.70 | 4.55 | 3.14 | 81.85 | 50.54 | 59.09 | 40.91 |
| 2018 | 1834.56 | 5387.28 | −49.20 | 10.71 | 6.57 | 4.14 | 67.22 | 44.59 | 61.34 | 39.66 |
| 2019 | 1670.88 | 7650.72 | −1796.16 | 8.93 | 4.54 | 4.39 | 70.12 | 54.31 | 50.84 | 49.16 |
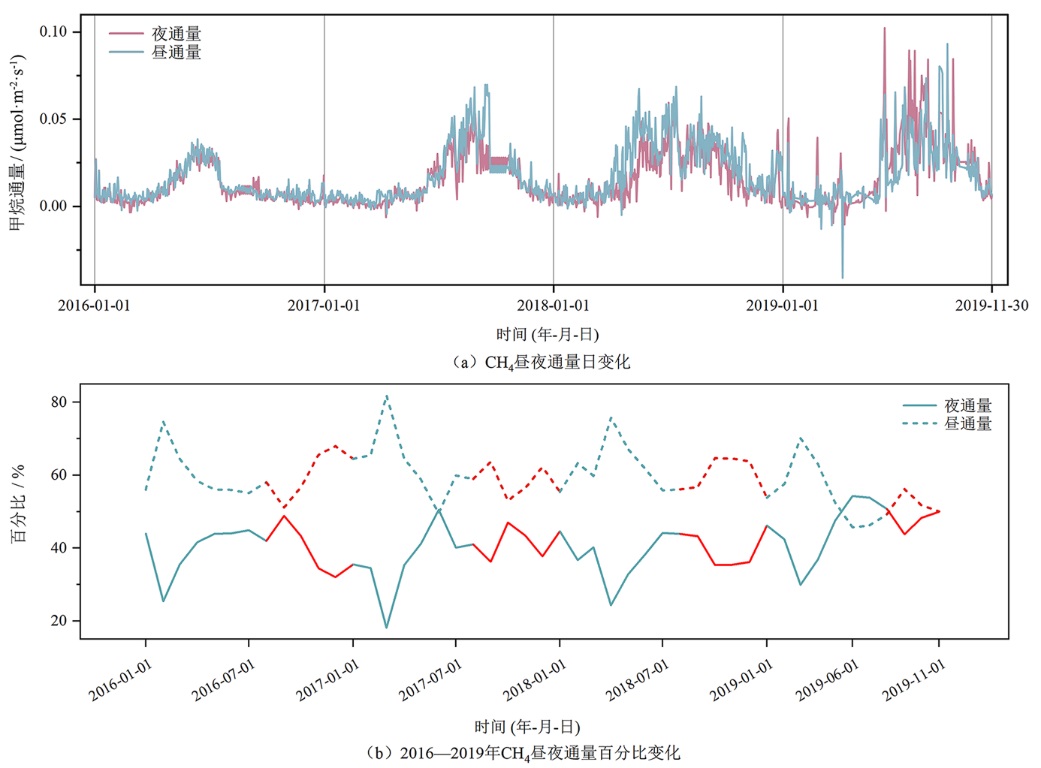
图2 2016-2019年大九湖CH4通量昼夜变化特征 百分比变化图中红色线段表示每年的1-7月,蓝色则表示每年的8-12月
Figure 2 Diurnal variation of methane emission of the Dajiuhu peatland during 2016?2019
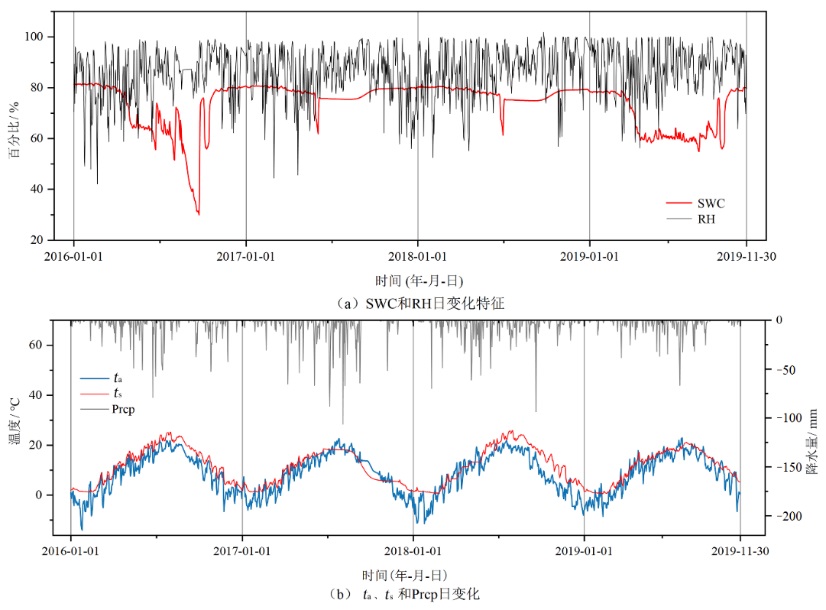
图3 监测期内大九湖泥炭湿地气象因子变化
Figure 3 Meteorological records in the Dajiuhu peatland during 2016?2019
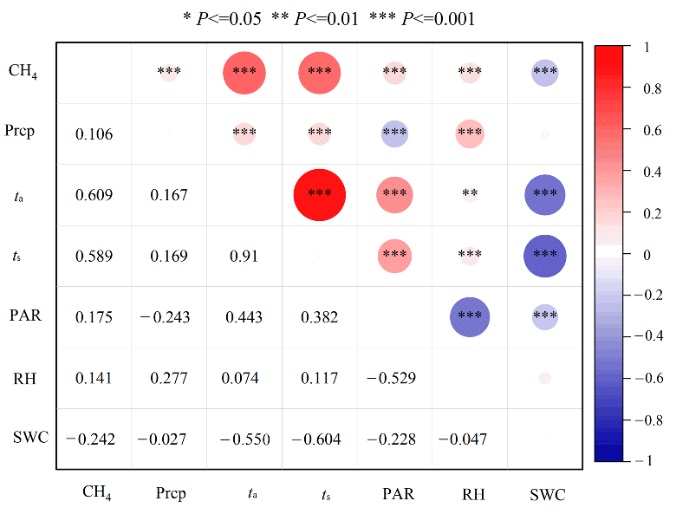
图4 气象因子间相关性热图 n=1431;圆形填充蓝色表示负相关性,红色表示正相关性,相关性指数显示在图中左下角
Figure 4 The heatmap of relationships between meteorological records
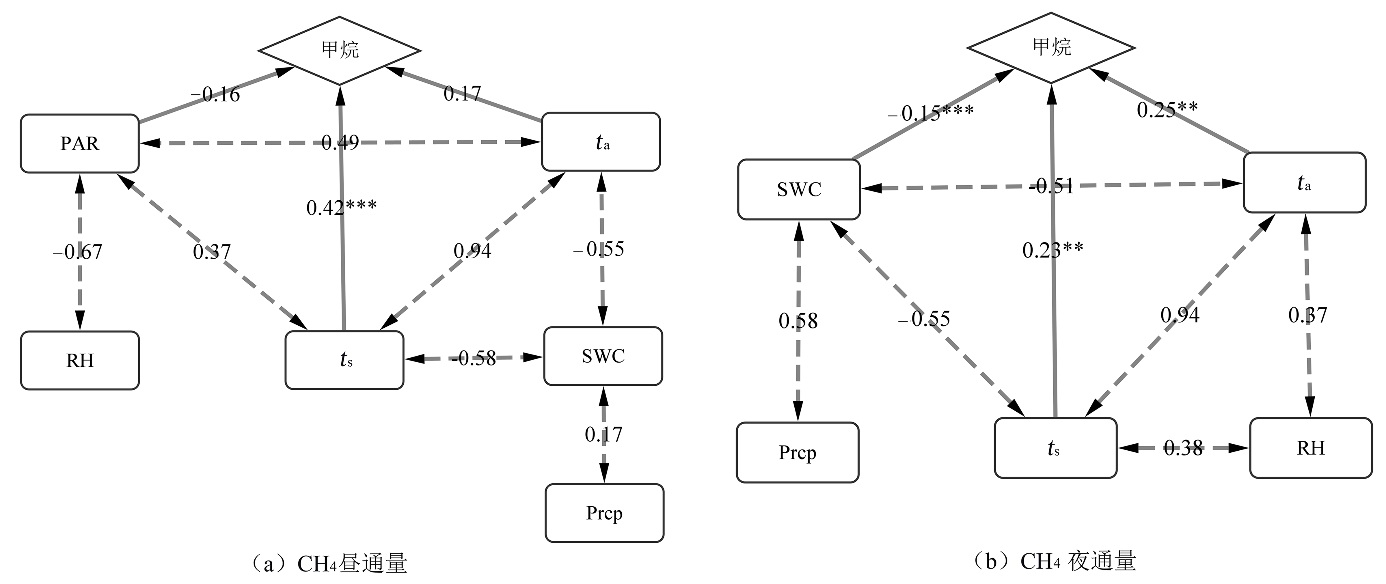
图5 不同气象因子对大九湖甲烷昼通量(n=1431)和夜通量(n=1431)影响的路径分析 图中数值表示路径系数
Figure 5 Pathway analyses between different climate parameters and methane fluxes during day (n=1431) and night (n=1431)
| 昼/夜通量 | 模型 | 未标准化系数 | 标准化系数 | 显著性 | ||
|---|---|---|---|---|---|---|
| B | 标准误差 | Beta | ||||
| CH4昼通量 | 常量 | 0.018 | 0.007 | 0.009 | ||
| ta | 0.000 | 0.000 | 0.176 | 0.071 | ||
| ts | 0.001 | 0.000 | 0.418 | 0.000 | ||
| SWC | 0.000 | 0.000 | −0.054 | 0.145 | ||
| Prcp | 0.001 | 0.003 | 0.008 | 0.778 | ||
| RH | 0.000 | 0.000 | −0.086 | 0.071 | ||
| PAR | 0.000 | 0.000 | −0.176 | 0.001 | ||
| CH4夜通量 | 常量 | 0.017 | 0.011 | 0.137 | ||
| ta | 0.000 | 0.000 | 0.246 | 0.007 | ||
| ts | 0.001 | 0.000 | 0.244 | 0.004 | ||
| SWC | 0.000 | 0.000 | −0.149 | 0.002 | ||
| Prcp | 0.255 | 0.121 | 0.081 | 0.035 | ||
| RH | 0.000 | 0.000 | 0.101 | 0.071 | ||
| PAR | 0.000 | 0.000 | 0.039 | 0.552 | ||
表2 CH4昼夜通量与气象因子间多元线性回归分析结果
Table 2 The multiple linear regression analysis between methane emissions and meteorological parameters in day and night
| 昼/夜通量 | 模型 | 未标准化系数 | 标准化系数 | 显著性 | ||
|---|---|---|---|---|---|---|
| B | 标准误差 | Beta | ||||
| CH4昼通量 | 常量 | 0.018 | 0.007 | 0.009 | ||
| ta | 0.000 | 0.000 | 0.176 | 0.071 | ||
| ts | 0.001 | 0.000 | 0.418 | 0.000 | ||
| SWC | 0.000 | 0.000 | −0.054 | 0.145 | ||
| Prcp | 0.001 | 0.003 | 0.008 | 0.778 | ||
| RH | 0.000 | 0.000 | −0.086 | 0.071 | ||
| PAR | 0.000 | 0.000 | −0.176 | 0.001 | ||
| CH4夜通量 | 常量 | 0.017 | 0.011 | 0.137 | ||
| ta | 0.000 | 0.000 | 0.246 | 0.007 | ||
| ts | 0.001 | 0.000 | 0.244 | 0.004 | ||
| SWC | 0.000 | 0.000 | −0.149 | 0.002 | ||
| Prcp | 0.255 | 0.121 | 0.081 | 0.035 | ||
| RH | 0.000 | 0.000 | 0.101 | 0.071 | ||
| PAR | 0.000 | 0.000 | 0.039 | 0.552 | ||
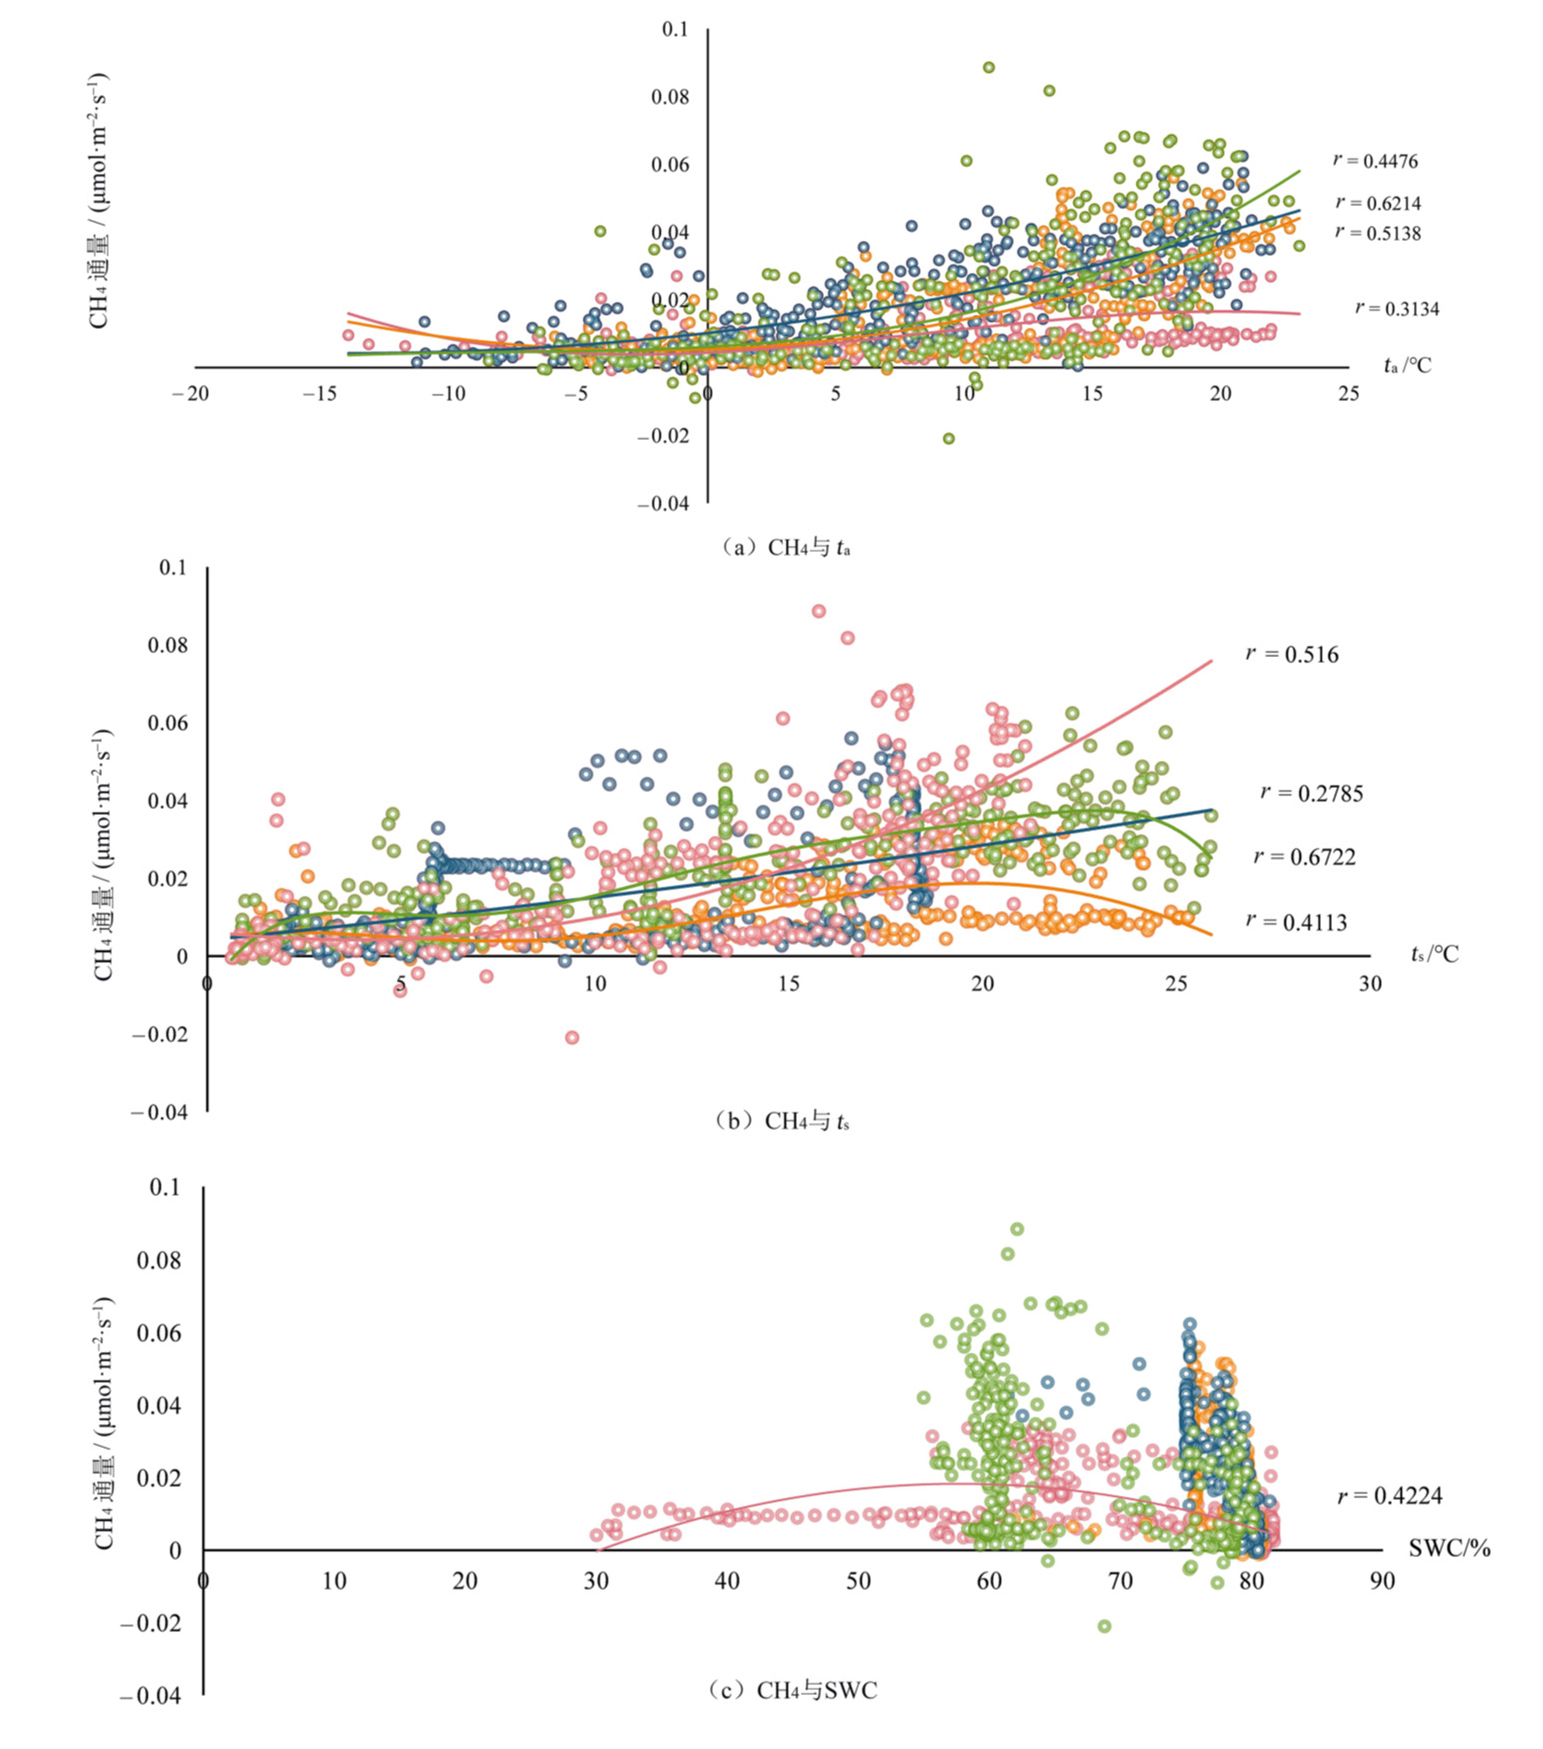
图6 2016-2019大九湖泥炭湿地CH4通量与气象因子的关系
Figure 6 Relationships between methane emission and meteorological records
| 研究范围 | 甲烷通量/ (μmol∙m−2∙h−1) | 年排放量/ (g∙m−1) | 参考文献 |
|---|---|---|---|
| 青藏高原日干桥 泥炭湿地 | 249.48 | 34.96 | Chen et al., |
| 意大利邦东尼峰 高原泥炭湿地 | 126.00 | 17.66 | Pullens et al., |
| 北欧泥炭湿地 | 0.69‒114.58 | 0.10‒15.96 | Huang et al., |
| 马来西亚马姆达鲁国家公园泥炭湿地 | 86.40 | 12.11 | Wong et al., |
| 福建省闽江口 山峪塘湿地 | 1412.50 | 197.98 | Tong et al., |
| 青海省隆宝滩 沼泽湿地 | 56.61 | 7.93 | 何方杰等, |
| 波兰别布扎河湿地 | 176.23 | 24.70 | Fortuniak et al., |
| 广东省珠江口 红树林 | 18.97 | 2.65 | 张涵等, |
| 阿根廷巴塔哥尼亚山毛榉林 | 4.38 | 0.61 | 2019 |
| 青海省尕海 湿生草甸 | 2.26‒8.67 | 0.32‒1.22 | Wu et al., |
| 菲律宾拉古纳 稻田土 | 241.20 | 33.60 | Alberto et al., |
| 江河岸带 | 372.08 | 52.15 | Tang et al., |
表3 国内外不同生态系统甲烷通量
Table 3 The mean methane emissions from different study sites
| 研究范围 | 甲烷通量/ (μmol∙m−2∙h−1) | 年排放量/ (g∙m−1) | 参考文献 |
|---|---|---|---|
| 青藏高原日干桥 泥炭湿地 | 249.48 | 34.96 | Chen et al., |
| 意大利邦东尼峰 高原泥炭湿地 | 126.00 | 17.66 | Pullens et al., |
| 北欧泥炭湿地 | 0.69‒114.58 | 0.10‒15.96 | Huang et al., |
| 马来西亚马姆达鲁国家公园泥炭湿地 | 86.40 | 12.11 | Wong et al., |
| 福建省闽江口 山峪塘湿地 | 1412.50 | 197.98 | Tong et al., |
| 青海省隆宝滩 沼泽湿地 | 56.61 | 7.93 | 何方杰等, |
| 波兰别布扎河湿地 | 176.23 | 24.70 | Fortuniak et al., |
| 广东省珠江口 红树林 | 18.97 | 2.65 | 张涵等, |
| 阿根廷巴塔哥尼亚山毛榉林 | 4.38 | 0.61 | 2019 |
| 青海省尕海 湿生草甸 | 2.26‒8.67 | 0.32‒1.22 | Wu et al., |
| 菲律宾拉古纳 稻田土 | 241.20 | 33.60 | Alberto et al., |
| 江河岸带 | 372.08 | 52.15 | Tang et al., |
| [1] |
ALBERTO M C R, WASSMANN R, BURESH R J, et al., 2014. Measuring methane flux from irrigated rice fields by eddy covariance method using open-path gas analyzer[J]. Field Crops Research, 160: 12-21.
DOI URL |
| [2] |
BALCOMBE P, SPEIRS J F, BRANDON N P, et al., 2018. Methane emissions: Choosing the right climate metric and time horizon[J]. Environmental Science: Processes and Impacts, 20(10): 1323-1339.
DOI URL |
| [3] |
BOUCHARD V, FREY S D, GILBERT J M, et al., 2007. Effects of macrophyte functional group richness on emergent freshwater wetland functions[J]. Ecology, 88(11): 2903-2914.
PMID |
| [4] |
BRIDGHAM S, MEGONIGAL P, KELLER J, et al., 2006. The carbon balance of north American wetlands[J]. Wetlands, 26(6): 889-916.
DOI URL |
| [5] |
CHEN H, LIU X W, XUE D, et al., 2021. Methane emissions during different freezing-thawing periods from a fen on the Qinghai-Tibetan Plateau: Four years of measurements[J]. Agricultural and Forest Meteorology, 297: 108279.
DOI URL |
| [6] |
CHENG J X, XU L G, WU J H, et al., 2022. Responses of ecosystem respiration and methane fluxes to warming and nitrogen addition in a subtropical littoral wetland[J]. CATENA, 215: 106335.
DOI URL |
| [7] |
DENG Y C, CUI X Y, LÜKE C, et al., 2013. Aerobic methanotroph diversity in Riganqiao peatlands on the Qinghai-Tibetan Plateau[J]. Environmental Microbiology Reports, 5(4): 566-574.
DOI PMID |
| [8] |
DISE N B, VERRY E S, 2001. Suppression of peatland methane emission by cumulative sulfate deposition in simulated acid rain[J]. Biogeochemistry, 53(2): 143-160.
DOI URL |
| [9] |
DREW T S, GREG F, DOROTHY M K, et al., 2009. Improved attribution of climate forcing to emissions[J]. Science, 326(5953): 716-718.
DOI PMID |
| [10] |
DUMAN T, SCHÄFER K V R, 2018. Partitioning net ecosystem carbon exchange of native and invasive plant communities by vegetation cover in an urban tidal wetland in the New Jersey Meadowlands (USA)[J]. Ecological Engineering, 114: 16-24.
DOI URL |
| [11] | FENG X, DEVENTER M J, LONCHAR R, et al., 2020. Climate sensitivity of peatland methane emissions mediated by seasonal hydrologic dynamics[J]. Geophysical Research Letters, 47(17): e2020GL088875. |
| [12] | FORSTER P V, RAMASWAMY P, ARTAXO T, et al., 2007. Changes in atmospheric constituents and in radiative forcing:In:climate change 2007: The physical science basis. contribution of working Group I to the fourth assessment report of the intergovernmental panel on climate changes[R]. United Kingdom: Cambridge University Press: 131-215. |
| [13] |
FORTUNIAK K, PAWLAK W, BEDNORZ L, et al., 2017. Methane and carbon dioxide fluxes of a temperate mire in Central Europe[J]. Agricultural and Forest Meteorology, 232: 306-318.
DOI URL |
| [14] |
HUANG X, SILVENNOINEN H, KLøVE B, et al., 2021. Modelling CO2 and CH4 emissions from drained peatlands with grass cultivation by the BASGRA-BGC model[J]. Science of the Total Environment, 765: 144385.
DOI URL |
| [15] |
JOABSSON A, CHRISTENSEN T R, WALLéN B, 1999. Influence of vascular plant photosynthetic rate on CH4 emission from peat monoliths from southern boreal Sweden[J]. Polar Research, 18(2): 215-220.
DOI URL |
| [16] |
KARAKURT I, AYDIN G, AYDINER K, 2012. Sources and mitigation of methane emissions by sectors: A critical review[J]. Renewable Energy, 39(1): 40-48.
DOI URL |
| [17] |
LE MER J, ROGER P, 2001. Production, oxidation, emission and consumption of methane by soils: A review[J]. European Journal of Soil Biology, 37(1): 25-50.
DOI URL |
| [18] |
LIU H Y, GU Y S, HUANG X Y, et al., 2019. A 13,000-year peatland palaeohydrological response to the ENSO-related Asian monsoon precipitation changes in the middle Yangtze Valley[J]. Quaternary Science Reviews, 212: 80-91.
DOI URL |
| [19] |
LIU H Y, GU Y S, GE J W, et al., 2022. The response of the Dajiuhu peatland ecosystem to hydrological variations: implications for carbon sequestration and peatlands conservation[J]. Journal of Hydrology, 612(Part C): 128307.
DOI URL |
| [20] |
MALTBY E, IMMIRZI P, 1993. Carbon dynamics in peatlands and other wetland soils regional and global perspectives[J]. Chemosphere, 27(6): 999-1023.
DOI URL |
| [21] |
McNICOL G, KNOX S H, GUILDERSON T P, et al., 2020. Where old meets new: An ecosystem study of methanogenesis in a reflooded agricultural peatland[J]. Global Change Biology, 26(2): 772-785.
DOI PMID |
| [22] |
MIAO G F, NOORMETS A, DOMEC J C, et al., 2017. Hydrology and microtopography control carbon dynamics in wetlands: implications in partitioning ecosystem respiration in a coastal plain forested wetland[J]. Agricultural and Forest Meteorology, 247: 343-355.
DOI URL |
| [23] |
PENG S, LIN X, THOMPSON R L, et al., 2022. Wetland emission and atmospheric sink changes explain methane growth in 2020[J]. Nature, 612(7940): 477-482.
DOI |
| [24] |
PULLENS J W M, SOTTOCORNOLA M, KIELY G, et al., 2016. Carbon fluxes of an alpine peatland in Northern Italy[J]. Agricultural and Forest Meteorology, 220: 69-82.
DOI URL |
| [25] |
SÁ M M F, SCHAEFER C E G R, LOUREIRO D C, et al., 2019. Fluxes of CO2, CH4, and N2O in tundra-covered and Nothofagus forest soils in the Argentinian Patagonia[J]. Science of the Total Environment, 659: 401-409.
DOI URL |
| [26] |
STRöM L, MASTEPANOV M, CHRISTENSEN T R, 2005. Species-specific effects of vascular plants on carbon turnover and methane emissions from wetlands[J]. Biogeochemistry, 75(1): 65-82.
DOI URL |
| [27] |
TANG W, XU Y J, MA Y M, et al., 2021. Hot spot of CH4 production and diffusive flux in rivers with high urbanization[J]. Water Research, 204: 117624.
DOI URL |
| [28] |
TOLLEFSON J, 2022. Scientists raise alarm over ‘dangerously fast’ growth in atmospheric methane[J]. Nature, DOI: 10.1038/d41586-022-00312-2.
DOI |
| [29] |
TONG C, BASTVIKEN D, TANG K W, et al., 2021. Annual CO2 and CH4 fluxes in coastal earthen ponds with Litopenaeus vannamei in southeastern China[J]. Aquaculture, 545: 737229.
DOI URL |
| [30] |
VAN DER NAT F-J W A, MIDDELBURG J J, 1998. Seasonal variation in methane oxidation by the rhizosphere of Phragmites australis and Scirpus lacustris[J]. Aquatic Botany, 61(2): 95-110.
DOI URL |
| [31] |
WANG L W, GE J W, FENG L, et al., 2022. The Synergism between methanogens and methanotrophs and the nature of their contributions to the seasonal variation of methane fluxes in a wetland: the case of Dajiuhu subalpine peatland[J]. Advances in Atmospheric Sciences, 39(8): 1375-1385.
DOI |
| [32] |
WANG R C, WANG H M, XI Z Q, et al., 2022. Hydrology driven vertical distribution of prokaryotes and methane functional groups in a subtropical peatland[J]. Journal of Hydrology, 608: 127592.
DOI URL |
| [33] |
WONG G X, HIRATA R, HIRANO T, et al., 2018. Micrometeorological measurement of methane flux above a tropical peat swamp forest[J]. Agricultural and Forest Meteorology, 256-257: 353-361.
DOI URL |
| [34] | WOODCOCK N, 1997. Climate change 1995. The science of climate change. Contribution of working group I to the second assessment report of the intergovernmental panel on climate change[J]. Geological Magazine, 134(2): 269-281. |
| [35] |
WU J Q, WANG H Y, LI G, et al., 2021. Responses of CH4 flux and microbial diversity to changes in rainfall amount and frequencies in a wet meadow in the Tibetan Plateau[J]. CATENA, 202: 105253.
DOI URL |
| [36] | XIAO J Y, XIAO X Y, ZHANG M H, et al., 2015. Late pleistocene montane vegetation and climate history from the Dajiuhu Basin in the western Hubei Province of central China[J]. Review of Palaeobotany & Palynology, 222: 22-32. |
| [37] |
XU X Y, ZHANG M M, XIONG Y S, et al., 2020. The influence of soil temperature, methanogens and methanotrophs on methane emissions from cold waterlogged paddy fields[J]. Journal of Environmental Management, 264: 110421.
DOI URL |
| [38] | 耿世聪, 陈志杰, 张军辉, 等, 2013. 长白山三种主要林地土壤甲烷通量[J]. 生态学杂志, 32(5): 1091-1096. |
| GENG S C, CHEN Z J, ZHANG J H, et al., 2013. Soil methane fluxes of three forest types in Changbai mountain of northeast China[J]. Chinese Journal of Ecology, 32(5): 1091-1096. | |
| [39] |
何方杰, 韩辉邦, 马学谦, 等, 2019. 隆宝滩沼泽湿地不同区域的甲烷通量特征及影响因素[J]. 生态环境学报, 28(4): 803-811.
DOI URL |
| HE F J, HAN H B, MA X Q, et al., 2019. Characteristics and influence factors of CH4 flux in different areas of Longbaotan marsh wetland[J]. Ecology and Environmental Sciences, 28(4): 803-811. | |
| [40] | 李永福, 葛继稳, 翁闻畅, 等, 2019. 神农架大九湖泥炭湿地二氧化碳和甲烷排放化学计量比研究[J]. 安全与环境工程, 26(4): 20-30. |
| LI Y F, GE J W, WENG W C, et al., 2019. Stoichiometry ratio of CO2 and CH4 emissions in Dajiuhu peat wetland of Shennongjia[J]. Safety and Environemntal Engineering, 26(4): 20-30. | |
| [41] | 栾军伟, 崔丽娟, 宋洪涛, 等, 2012. 国外湿地生态系统碳循环研究进展[J]. 湿地科学, 10(2): 235-242. |
| LUAN J W, CUI L J, SONG H T, et al., 2012. Foreign research progress on carbon cycle in wetland ecosystems[J]. Wetland Science, 10(2): 235-242. | |
| [42] | 罗涛, 伦子健, 顾延生, 等, 2015. 神农架大九湖湿地植物群落调查与生态保护研究[J]. 湿地科学, 13(2): 153-160. |
| LUO T, LUN Z J, GU Y S, et al., 2015. Plant community survey and ecological protection of Dajiuhu wetlands in Shennongjia area[J]. Wetland Science, 13(2): 153-160. | |
| [43] | 马己安, 冯克鹏, 李王成, 等, 2020. 压砂地和裸地对比条件下地温与含水率变化差异性分析[J]. 节水灌溉, (7): 63-68. |
| MA J A, FENG K P, LI W C, et al., 2020. Analysis of the difference between ground temperature and moisture content under the comparison between gravel-mulched land and bare land[J]. Water Saving Irrigation, (7): 63-68. | |
| [44] | 申格, 徐斌, 金云翔, 等, 2016. 若尔盖高原湿地研究进展[J]. 地理与地理信息科学, 32(4): 104-110. |
| SHEN G, XU B, JIN Y X, et al., 2016. Multi-model suitability assessment of construction land in Tsinling mountains based on the niche theory: A case study of Shangzhou, Shangluo[J]. Geography and Geo-Information Science, 32(4): 104-110. | |
| [45] |
张涵, 唐常源, 禤映雪, 等, 2022. 珠江口红树林土壤甲烷和二氧化碳通量特征及其影响因素研究[J]. 生态环境学报, 31(5): 939-948.
DOI URL |
| ZHANG H, TANG C Y, XUAN Y X, et al., 2022. The regular pattern and influencing factors of CO2 and CH4 fluxes from mangrove soil[J]. Ecology and Environmental Sciences, 31(5): 939-948. |
| [1] | 孙建波, 畅文军, 李文彬, 张世清, 李春强, 彭明. 香蕉不同生育期根际微生物生物量及土壤酶活的变化研究[J]. 生态环境学报, 2022, 31(6): 1169-1174. |
| [2] | 何瑞, 蒋然, 杨芳, 张心凤, 林键銮, 朱小平, 彭松耀. 茂名近岸海域中、小型浮游动物群落特征及其与环境因子的关系[J]. 生态环境学报, 2022, 31(1): 142-150. |
| [3] | 袁伟皓, 王华, 夏玉宝, 曾一川, 邓燕青, 李媛媛, 张心悦. 基于GAM模型的鄱阳湖叶绿素a与水质因子相关性分析[J]. 生态环境学报, 2021, 30(8): 1716-1723. |
| [4] | 邓慧颖, 陈立新, 余永江, 王宏. 武夷山市臭氧分布特征及其与气象要素关系分析[J]. 生态环境学报, 2021, 30(7): 1428-1435. |
| [5] | 王永志, 刘胜林. 黄河三角洲芦苇湿地生态系统碳通量动态特征及其影响因素[J]. 生态环境学报, 2021, 30(5): 949-956. |
| [6] | 马炳鑫, 靖娟利, 徐勇, 何宏昌, 刘兵. 2000—2019年滇黔桂岩溶区植被NPP时空变化及与气候变化的关系研究[J]. 生态环境学报, 2021, 30(12): 2285-2293. |
| 阅读次数 | ||||||
|
全文 |
|
|||||
|
摘要 |
|
|||||