生态环境学报 ›› 2026, Vol. 35 ›› Issue (3): 458-468.DOI: 10.16258/j.cnki.1674-5906.2026.03.012
张煜坤1,2,3,4( ), 陈懂懂1,2,3,4, 李奇1,2,3,4, 贺福全1,2,3,4, 张莉1,2,3,4, 赵亮1,2,3,4,*()
收稿日期:2025-05-28
修回日期:2025-09-17
接受日期:2025-11-11
出版日期:2026-03-18
发布日期:2026-03-13
通讯作者:
*E-mail: 作者简介:张煜坤(1994年生),男,工程师,硕士,研究方向为生态环境保护。E-mail: zhangyukun@nwipb.cas.cn
基金资助:
ZHANG Yukun1,2,3,4(), CHEN Dongdong1,2,3,4, LI Qi1,2,3,4, HE Fuquan1,2,3,4, ZHANG Li1,2,3,4, ZHAO Liang1,2,3,4,*()
Received:2025-05-28
Revised:2025-09-17
Accepted:2025-11-11
Online:2026-03-18
Published:2026-03-13
摘要:
土壤重金属污染已逐渐成为三江源范围内关注的问题。为探究0-20 cm土壤重金属污染特征及主要污染源,测定了5种重金属元素的含量(Pb、Cd、Cr、As、Hg),结合空间插值分析、相关性分析、PCA分析和正定矩阵因子分解(PMF)模型进行土壤重金属的来源解析。结果表明,1)三江源南部和东部地区土壤中的Cr、As达到轻度污染,Hg达到中度污染,潜在生态危害指数和综合污染指数较高的区域主要集中在南部和部分东部地区,不同土层的潜在生态危害指数和综合污染指数空间分布具有一致性。2)0-20 cm土层的Pb和As受交通排放和燃料燃烧来源的影响,Hg、Cr、Cd分别受人为活动、土壤母质、工业废料及农业肥料来源的影响。其中,交通排放和燃料燃烧的解释度最高平均为32.1%,工业废料及农业肥料解释度最低平均为15.8%。3)人为干扰因素对0-20 cm土层的重金属解释度均超过70%,随着土层深度的增加,土壤母质对重金属的解释度增大,人为干扰对对重金属的解释度降低,不同土层的Hg、Pb、Cd可能更多来源于人为活动,而10-20 cm的As和Cr可能更多来源于土壤母质。三江源区域土壤重金属含量主要受人为干扰因素的影响并存在Hg污染加重的风险,应加强对三江源南部和东部区域交通排放和燃料燃烧的监管以及加强玛多、可可西里、治多等北部地区Cr、As、Hg的污染防控。
中图分类号:
张煜坤, 陈懂懂, 李奇, 贺福全, 张莉, 赵亮. 基于多元统计分析和PMF模型的土壤重金属源解析——以三江源为例[J]. 生态环境学报, 2026, 35(3): 458-468.
ZHANG Yukun, CHEN Dongdong, LI Qi, HE Fuquan, ZHANG Li, ZHAO Liang. Source Analysis of Soil Heavy Metals Based on Multivariate Statistical Analysis and PMF Model: A Case Study of Sanjiangyuan[J]. Ecology and Environmental Sciences, 2026, 35(3): 458-468.

图1 采样点示意图 本文地图通过自然资源部“标准地图服务系统”进行查询;本文地图区域范围仅为三江源,其中高程数据来源于地理空间数据云下载(https://www.gscloud.cn/),做图目的只为标注采样点,未涉及国界、省界
Figure 1 Schematic diagram of sampling points
| E | R | 生态风险 级别 | |||
|---|---|---|---|---|---|
| 分级标准范围 | 本研究 | 分级标准范围 | 本研究 | ||
| <40 | <40 | <150 | <100 | 轻微风险 | |
| 40-80 | 40-80 | 150-300 | 100-200 | 中等风险 | |
| 80-160 | 80-160 | 300-600 | 200-400 | 较强风险 | |
| 160-320 | 160-320 | ≥600 | ≥400 | 很强风险 | |
| ≥320 | ≥320 | - | - | 极强风险 | |
表1 本研究的E和R分级标准与Hakanson分级标准的比较
Table1 Comparison Of E and R standards for different ecological risks with heavy metals between the Hkanson standards and this paper
| E | R | 生态风险 级别 | |||
|---|---|---|---|---|---|
| 分级标准范围 | 本研究 | 分级标准范围 | 本研究 | ||
| <40 | <40 | <150 | <100 | 轻微风险 | |
| 40-80 | 40-80 | 150-300 | 100-200 | 中等风险 | |
| 80-160 | 80-160 | 300-600 | 200-400 | 较强风险 | |
| 160-320 | 160-320 | ≥600 | ≥400 | 很强风险 | |
| ≥320 | ≥320 | - | - | 极强风险 | |

图2 Pb、Cd、Cr、As、Hg质量分数的空间分布
Figure 2 Spatial distribution of Pb, Cd, Cr, As, and Hg content
| 分布方位 | 采样点 | w(Pb)/(mg∙kg−1) | w(Cd)/(mg∙kg−1) | w(Cr)/(mg∙kg−1) | w(As)/(mg∙kg−1) | w(Hg)/(mg∙kg−1) | |||||||||
|---|---|---|---|---|---|---|---|---|---|---|---|---|---|---|---|
| 土壤深度/cm | 0-10 | 10-20 | 0-10 | 10-20 | 0-10 | 10-20 | 0-10 | 10-20 | 0-10 | 10-20 | |||||
| 北部 | QML | 6.32 | 6.73 | 0.051 | 0.04 | 39.63 | 39.12 | 10.11 | 10.3 | 0.02 | 0.014 | ||||
| WDL | 7.17 | 6.85 | 0.032 | 0.041 | 17.32 | 19.68 | 7.11 | 6.56 | 0.021 | 0.016 | |||||
| ZD | 9.45 | 9.72 | 0.066 | 0.07 | 37.16 | 37.52 | 10.82 | 11.84 | 0.051 | 0.019 | |||||
| KKXL | 4.68 | 4.69 | 0.021 | 0.025 | 14.5 | 16.63 | 8.63 | 9.03 | 0.011 | 0.0051 | |||||
| MD | 8.64 | 8.71 | 0.044 | 0.047 | 40.5 | 39.17 | 12.53 | 14.81 | 0.016 | 0.012 | |||||
| ELH | 14.11 | 13.85 | 0.029 | 0.021 | 31.21 | 33.25 | 20.21 | 20.81 | 0.014 | 0.009 | |||||
| 南部 | YS | 26.93 | 25.36 | 0.24 | 0.29 | 72.84 | 73.15 | 20.95 | 21.22 | 0.056 | 0.041 | ||||
| JZ | 11.67 | 12.45 | 0.073 | 0.077 | 58.63 | 58.43 | 13.13 | 13.6 | 0.045 | 0.035 | |||||
| CD | 9.24 | 10.24 | 0.047 | 0.054 | 53.26 | 47.76 | 12.91 | 15.9 | 0.066 | 0.049 | |||||
| BM | 10.73 | 10.41 | 0.069 | 0.069 | 56.3 | 56.71 | 13.05 | 12.9 | 0.033 | 0.028 | |||||
| NQ | 10.76 | 10.16 | 0.096 | 0.099 | 27.56 | 28.16 | 13.48 | 13.7 | 0.035 | 0.031 | |||||
| BT | 12.33 | 12.33 | 0.063 | 0.063 | 55.52 | 55.58 | 14.11 | 14.1 | 0.049 | 0.039 | |||||
| MQ | 9.41 | 9.56 | 0.063 | 0.069 | 46.52 | 48.52 | 11.82 | 11.5 | 0.032 | 0.028 | |||||
| 东部 | XH | 9.41 | 9.41 | 0.064 | 0.054 | 39.6 | 39.67 | 8.91 | 8.91 | 0.028 | 0.023 | ||||
| ZK | 23.21 | 20.85 | 0.14 | 0.08 | 63.15 | 62.25 | 28.95 | 29.12 | 0.017 | 0.013 | |||||
| GH | 20.08 | 16.86 | 0.14 | 0.08 | 46.22 | 47.58 | 14.38 | 15.32 | 0.062 | 0.041 | |||||
| HN | 10.13 | 9.43 | 0.08 | 0.06 | 50.26 | 48.56 | 12.53 | 13.02 | 0.032 | 0.032 | |||||
| GN | 19.11 | 18.97 | 0.11 | 0.07 | 45.03 | 44.32 | 11.03 | 12.98 | 0.039 | 0.028 | |||||
表2 三江源不同区域Pb、Cd、Cr、As、Hg质量分数
Table 2 The content of Pb, Cd, Cr, As, and Hg in different regions of Sanjiangyuan
| 分布方位 | 采样点 | w(Pb)/(mg∙kg−1) | w(Cd)/(mg∙kg−1) | w(Cr)/(mg∙kg−1) | w(As)/(mg∙kg−1) | w(Hg)/(mg∙kg−1) | |||||||||
|---|---|---|---|---|---|---|---|---|---|---|---|---|---|---|---|
| 土壤深度/cm | 0-10 | 10-20 | 0-10 | 10-20 | 0-10 | 10-20 | 0-10 | 10-20 | 0-10 | 10-20 | |||||
| 北部 | QML | 6.32 | 6.73 | 0.051 | 0.04 | 39.63 | 39.12 | 10.11 | 10.3 | 0.02 | 0.014 | ||||
| WDL | 7.17 | 6.85 | 0.032 | 0.041 | 17.32 | 19.68 | 7.11 | 6.56 | 0.021 | 0.016 | |||||
| ZD | 9.45 | 9.72 | 0.066 | 0.07 | 37.16 | 37.52 | 10.82 | 11.84 | 0.051 | 0.019 | |||||
| KKXL | 4.68 | 4.69 | 0.021 | 0.025 | 14.5 | 16.63 | 8.63 | 9.03 | 0.011 | 0.0051 | |||||
| MD | 8.64 | 8.71 | 0.044 | 0.047 | 40.5 | 39.17 | 12.53 | 14.81 | 0.016 | 0.012 | |||||
| ELH | 14.11 | 13.85 | 0.029 | 0.021 | 31.21 | 33.25 | 20.21 | 20.81 | 0.014 | 0.009 | |||||
| 南部 | YS | 26.93 | 25.36 | 0.24 | 0.29 | 72.84 | 73.15 | 20.95 | 21.22 | 0.056 | 0.041 | ||||
| JZ | 11.67 | 12.45 | 0.073 | 0.077 | 58.63 | 58.43 | 13.13 | 13.6 | 0.045 | 0.035 | |||||
| CD | 9.24 | 10.24 | 0.047 | 0.054 | 53.26 | 47.76 | 12.91 | 15.9 | 0.066 | 0.049 | |||||
| BM | 10.73 | 10.41 | 0.069 | 0.069 | 56.3 | 56.71 | 13.05 | 12.9 | 0.033 | 0.028 | |||||
| NQ | 10.76 | 10.16 | 0.096 | 0.099 | 27.56 | 28.16 | 13.48 | 13.7 | 0.035 | 0.031 | |||||
| BT | 12.33 | 12.33 | 0.063 | 0.063 | 55.52 | 55.58 | 14.11 | 14.1 | 0.049 | 0.039 | |||||
| MQ | 9.41 | 9.56 | 0.063 | 0.069 | 46.52 | 48.52 | 11.82 | 11.5 | 0.032 | 0.028 | |||||
| 东部 | XH | 9.41 | 9.41 | 0.064 | 0.054 | 39.6 | 39.67 | 8.91 | 8.91 | 0.028 | 0.023 | ||||
| ZK | 23.21 | 20.85 | 0.14 | 0.08 | 63.15 | 62.25 | 28.95 | 29.12 | 0.017 | 0.013 | |||||
| GH | 20.08 | 16.86 | 0.14 | 0.08 | 46.22 | 47.58 | 14.38 | 15.32 | 0.062 | 0.041 | |||||
| HN | 10.13 | 9.43 | 0.08 | 0.06 | 50.26 | 48.56 | 12.53 | 13.02 | 0.032 | 0.032 | |||||
| GN | 19.11 | 18.97 | 0.11 | 0.07 | 45.03 | 44.32 | 11.03 | 12.98 | 0.039 | 0.028 | |||||
| 重金属 元素 | 本研究区 | 青藏高原其他地区土壤重金属质量分数/(mg∙kg−1) | |||||||||
|---|---|---|---|---|---|---|---|---|---|---|---|
| 总样点 | 南部 | 北部 | 青海省背景值(郭立本等, | 青藏高原东北部(李雷明, | 青藏高原东北-西南(杨安等, | 环青海湖 (卫佩茹, | 青海湖流域表土(王平等, | 青海省重要交通沿线 (安思危, | 一江两河 (王伟鹏等, | 青海木里煤矿(王佟等, | |
| Pb | 9.36 | 12.97 | 8.41 | 20.9 | 72.49 | 28.65 | 21.86 | 20.47 | 32.91 | 35.81 | 240 |
| Cd | 0.06 | 0.1 | 0.04 | 0.14 | 0.68 | 0.17 | 0.62 | - | 0.19 | 0.21 | 0.81 |
| Cr | 45.75 | 52.78 | 30.47 | 70.1 | 83.11 | 70.84 | 41.35 | 54.17 | 74.62 | 82.95 | 350.02 |
| As | 11.69 | 14.45 | 11.89 | 14.00 | - | - | 11.73 | 11.66 | 21.61 | - | 20.01 |
| Hg | 0.03 | 0.041 | 0.017 | 0.021 | 0.28 | 0.029 | 0.031 | 0.035 | 0.05 | 0.022 | 1.00 |
表3 青藏高原其他地区土壤重金属含量及青海省土壤环境背景值的含量特征
Table 3 Heavy metal content in soils of other regions of the Qinghai-Tibet Plateau and the characteristics of soil environmental background values in Qinghai Province
| 重金属 元素 | 本研究区 | 青藏高原其他地区土壤重金属质量分数/(mg∙kg−1) | |||||||||
|---|---|---|---|---|---|---|---|---|---|---|---|
| 总样点 | 南部 | 北部 | 青海省背景值(郭立本等, | 青藏高原东北部(李雷明, | 青藏高原东北-西南(杨安等, | 环青海湖 (卫佩茹, | 青海湖流域表土(王平等, | 青海省重要交通沿线 (安思危, | 一江两河 (王伟鹏等, | 青海木里煤矿(王佟等, | |
| Pb | 9.36 | 12.97 | 8.41 | 20.9 | 72.49 | 28.65 | 21.86 | 20.47 | 32.91 | 35.81 | 240 |
| Cd | 0.06 | 0.1 | 0.04 | 0.14 | 0.68 | 0.17 | 0.62 | - | 0.19 | 0.21 | 0.81 |
| Cr | 45.75 | 52.78 | 30.47 | 70.1 | 83.11 | 70.84 | 41.35 | 54.17 | 74.62 | 82.95 | 350.02 |
| As | 11.69 | 14.45 | 11.89 | 14.00 | - | - | 11.73 | 11.66 | 21.61 | - | 20.01 |
| Hg | 0.03 | 0.041 | 0.017 | 0.021 | 0.28 | 0.029 | 0.031 | 0.035 | 0.05 | 0.022 | 1.00 |
| 指标 | 富集因子指数 | 潜在生态风险指数 | |||||||||||
|---|---|---|---|---|---|---|---|---|---|---|---|---|---|
| 重金属元素 | Pb | Cd | Cr | As | Hg | - | |||||||
| 土壤深度/cm | 0-10 | 10-20 | 0-10 | 10-20 | 0-10 | 10-20 | 0-10 | 10-20 | 0-10 | 10-20 | 0-10 | 10-20 | |
| QML | 0.49 | 0.58 | 0.61 | 0.53 | 0.92 | 0.92 | 1.07 | 1.07 | 1.88 | 1.31 | 59.50 | 47.27 | |
| MQ | 0.56 | 0.57 | 0.59 | 0.64 | 0.83 | 0.86 | 1.08 | 1.13 | 1.89 | 1.47 | 71.06 | 60.80 | |
| ZD | 0.66 | 0.68 | 0.75 | 0.8 | 0.78 | 0.78 | 1.25 | 1.32 | 1.77 | 1.28 | 82.50 | 55.54 | |
| JZ | 0.81 | 0.84 | 0.84 | 0.87 | 0.92 | 0.92 | 1.35 | 1.43 | 2.7 | 2.19 | 81.29 | 70.03 | |
| CD | 0.65 | 0.72 | 0.53 | 0.61 | 0.91 | 1.00 | 1.55 | 1.59 | 3.81 | 3.37 | 112.46 | 75.72 | |
| NQ | 0.75 | 0.71 | 0.96 | 0.94 | 0.58 | 0.59 | 1.37 | 1.41 | 1.93 | 1.84 | 83.61 | 70.76 | |
| BT | 0.86 | 0.86 | 0.71 | 0.71 | 1.06 | 1.16 | 1.46 | 1.46 | 3.94 | 3.94 | 121.03 | 99.42 | |
| HN | 0.71 | 0.73 | 0.91 | 0.71 | 0.95 | 0.91 | 1.33 | 1.33 | 1.92 | 1.58 | 96.73 | 64.00 | |
| XH | 0.66 | 0.66 | 0.73 | 0.73 | 0.83 | 0.83 | 0.98 | 0.98 | 1.94 | 1.94 | 65.46 | 59.19 | |
| BM | 0.75 | 0.73 | 0.79 | 0.79 | 1.07 | 1.18 | 1.19 | 1.2 | 2.17 | 2 | 80.67 | 74.18 | |
| KKXL | 0.53 | 0.53 | 0.38 | 0.45 | 0.49 | 0.56 | 0.99 | 1.05 | 0.84 | 0.66 | 26.16 | 28.10 | |
| MD | 0.58 | 0.58 | 0.78 | 0.84 | 0.81 | 0.78 | 1.18 | 1.35 | 1.19 | 0.85 | 50.78 | 45.92 | |
| GN | 0.75 | 0.72 | 0.97 | 0.95 | 0.85 | 0.86 | 1.08 | 1.06 | 1.13 | 1.05 | 107.57 | 100.62 | |
| GH | 0.92 | 0.87 | 0.77 | 0.75 | 1.26 | 1.35 | 1.26 | 1.28 | 1.29 | 1.09 | 138.07 | 127.19 | |
| WDL | 0.43 | 0.42 | 0.32 | 0.39 | 0.49 | 0.51 | 0.75 | 0.69 | 0.71 | 0.59 | 27.34 | 24.49 | |
| ELH | 0.52 | 0.53 | 0.41 | 0.42 | 0.52 | 0.53 | 0.92 | 0.88 | 0.79 | 0.69 | 52.43 | 49.56 | |
| YS | 0.88 | 0.89 | 0.73 | 0.72 | 1.02 | 1.09 | 1.41 | 1.52 | 3.15 | 3.01 | 168.74 | 151.08 | |
| ZK | 0.86 | 0.88 | 0.93 | 0.91 | 0.63 | 0.77 | 1.05 | 1.12 | 1.68 | 1.55 | 109.84 | 105.43 | |
表4 各采样点的潜在生态风险指数和富集因子指数
Table 4 Potential ecological risk index and enrichment factor index of each sampling site
| 指标 | 富集因子指数 | 潜在生态风险指数 | |||||||||||
|---|---|---|---|---|---|---|---|---|---|---|---|---|---|
| 重金属元素 | Pb | Cd | Cr | As | Hg | - | |||||||
| 土壤深度/cm | 0-10 | 10-20 | 0-10 | 10-20 | 0-10 | 10-20 | 0-10 | 10-20 | 0-10 | 10-20 | 0-10 | 10-20 | |
| QML | 0.49 | 0.58 | 0.61 | 0.53 | 0.92 | 0.92 | 1.07 | 1.07 | 1.88 | 1.31 | 59.50 | 47.27 | |
| MQ | 0.56 | 0.57 | 0.59 | 0.64 | 0.83 | 0.86 | 1.08 | 1.13 | 1.89 | 1.47 | 71.06 | 60.80 | |
| ZD | 0.66 | 0.68 | 0.75 | 0.8 | 0.78 | 0.78 | 1.25 | 1.32 | 1.77 | 1.28 | 82.50 | 55.54 | |
| JZ | 0.81 | 0.84 | 0.84 | 0.87 | 0.92 | 0.92 | 1.35 | 1.43 | 2.7 | 2.19 | 81.29 | 70.03 | |
| CD | 0.65 | 0.72 | 0.53 | 0.61 | 0.91 | 1.00 | 1.55 | 1.59 | 3.81 | 3.37 | 112.46 | 75.72 | |
| NQ | 0.75 | 0.71 | 0.96 | 0.94 | 0.58 | 0.59 | 1.37 | 1.41 | 1.93 | 1.84 | 83.61 | 70.76 | |
| BT | 0.86 | 0.86 | 0.71 | 0.71 | 1.06 | 1.16 | 1.46 | 1.46 | 3.94 | 3.94 | 121.03 | 99.42 | |
| HN | 0.71 | 0.73 | 0.91 | 0.71 | 0.95 | 0.91 | 1.33 | 1.33 | 1.92 | 1.58 | 96.73 | 64.00 | |
| XH | 0.66 | 0.66 | 0.73 | 0.73 | 0.83 | 0.83 | 0.98 | 0.98 | 1.94 | 1.94 | 65.46 | 59.19 | |
| BM | 0.75 | 0.73 | 0.79 | 0.79 | 1.07 | 1.18 | 1.19 | 1.2 | 2.17 | 2 | 80.67 | 74.18 | |
| KKXL | 0.53 | 0.53 | 0.38 | 0.45 | 0.49 | 0.56 | 0.99 | 1.05 | 0.84 | 0.66 | 26.16 | 28.10 | |
| MD | 0.58 | 0.58 | 0.78 | 0.84 | 0.81 | 0.78 | 1.18 | 1.35 | 1.19 | 0.85 | 50.78 | 45.92 | |
| GN | 0.75 | 0.72 | 0.97 | 0.95 | 0.85 | 0.86 | 1.08 | 1.06 | 1.13 | 1.05 | 107.57 | 100.62 | |
| GH | 0.92 | 0.87 | 0.77 | 0.75 | 1.26 | 1.35 | 1.26 | 1.28 | 1.29 | 1.09 | 138.07 | 127.19 | |
| WDL | 0.43 | 0.42 | 0.32 | 0.39 | 0.49 | 0.51 | 0.75 | 0.69 | 0.71 | 0.59 | 27.34 | 24.49 | |
| ELH | 0.52 | 0.53 | 0.41 | 0.42 | 0.52 | 0.53 | 0.92 | 0.88 | 0.79 | 0.69 | 52.43 | 49.56 | |
| YS | 0.88 | 0.89 | 0.73 | 0.72 | 1.02 | 1.09 | 1.41 | 1.52 | 3.15 | 3.01 | 168.74 | 151.08 | |
| ZK | 0.86 | 0.88 | 0.93 | 0.91 | 0.63 | 0.77 | 1.05 | 1.12 | 1.68 | 1.55 | 109.84 | 105.43 | |

图3 不同土层综合污染指数及综合潜在生态风险指数的空间分布
Figure 3 Spatial distribution of comprehensive pollution index and potential ecological risk index in different soil layers
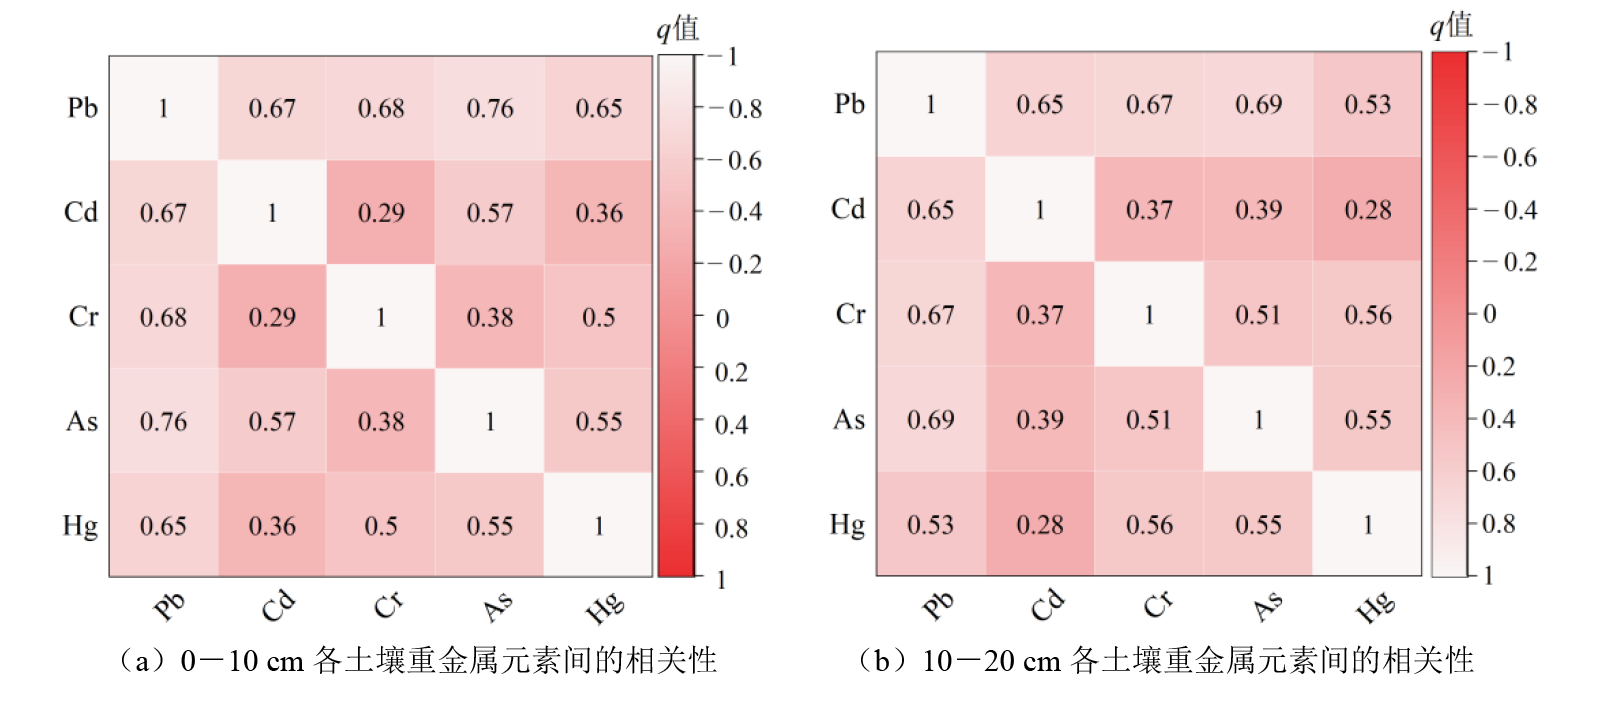
图4 各土壤重金属元素间的相关性分析
Figure 4 Correlation analysis among soil heavy metal elements
| 土壤深度/cm | 主成分 | 特征值 | 方差 | 累积方差 |
|---|---|---|---|---|
| 0-10 | 1 | 3.11 | 62.20 | 62.19 |
| 2 | 0.79 | 15.85 | 78.05 | |
| 3 | 0.49 | 9.87 | 87.92 | |
| 4 | 0.42 | 8.39 | 96.30 | |
| 5 | 0.19 | 3.70 | 100.00 | |
| 10-20 | 1 | 3.20 | 64.95 | 63.95 |
| 2 | 0.79 | 15.59 | 79.74 | |
| 3 | 0.53 | 10.61 | 90.35 | |
| 4 | 0.36 | 7.25 | 97.61 | |
| 5 | 0.12 | 2.39 | 100.00 |
表5 主成分分析结果
Table 5 Results of principal component analysis
| 土壤深度/cm | 主成分 | 特征值 | 方差 | 累积方差 |
|---|---|---|---|---|
| 0-10 | 1 | 3.11 | 62.20 | 62.19 |
| 2 | 0.79 | 15.85 | 78.05 | |
| 3 | 0.49 | 9.87 | 87.92 | |
| 4 | 0.42 | 8.39 | 96.30 | |
| 5 | 0.19 | 3.70 | 100.00 | |
| 10-20 | 1 | 3.20 | 64.95 | 63.95 |
| 2 | 0.79 | 15.59 | 79.74 | |
| 3 | 0.53 | 10.61 | 90.35 | |
| 4 | 0.36 | 7.25 | 97.61 | |
| 5 | 0.12 | 2.39 | 100.00 |

图5 主成分分析因子载荷图
Figure 5 Principal component analysis factor loading plot
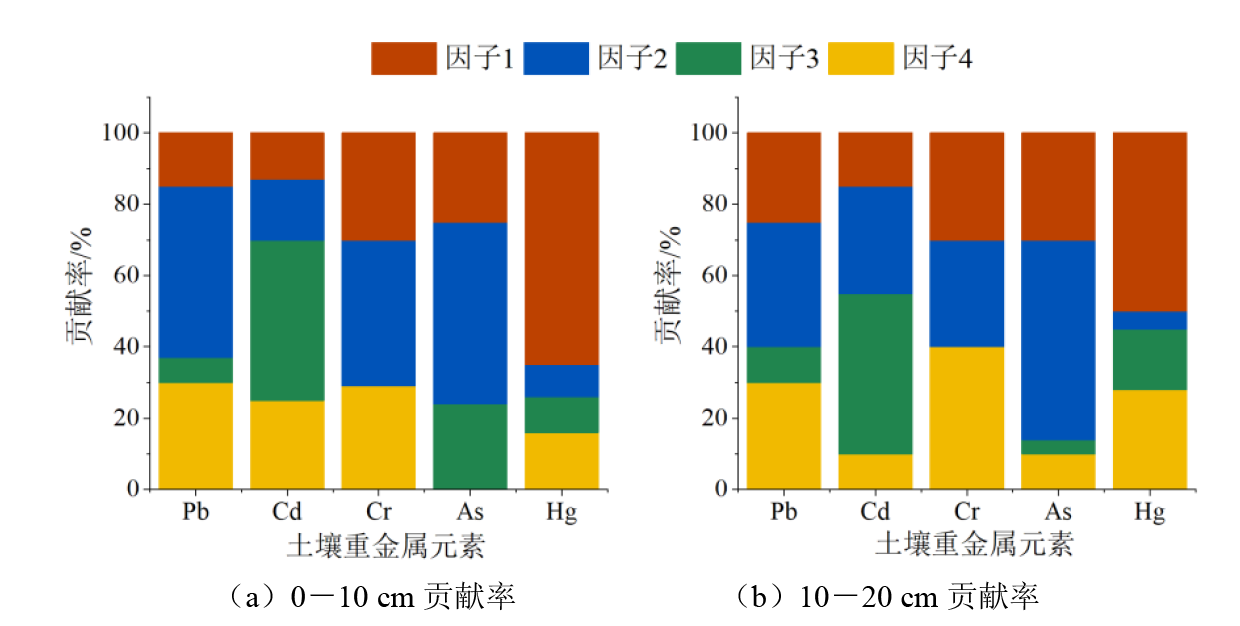
图6 土壤重金属PMF源解析贡献
Figure 6 Soil heavy metal PMF source analysis contribution
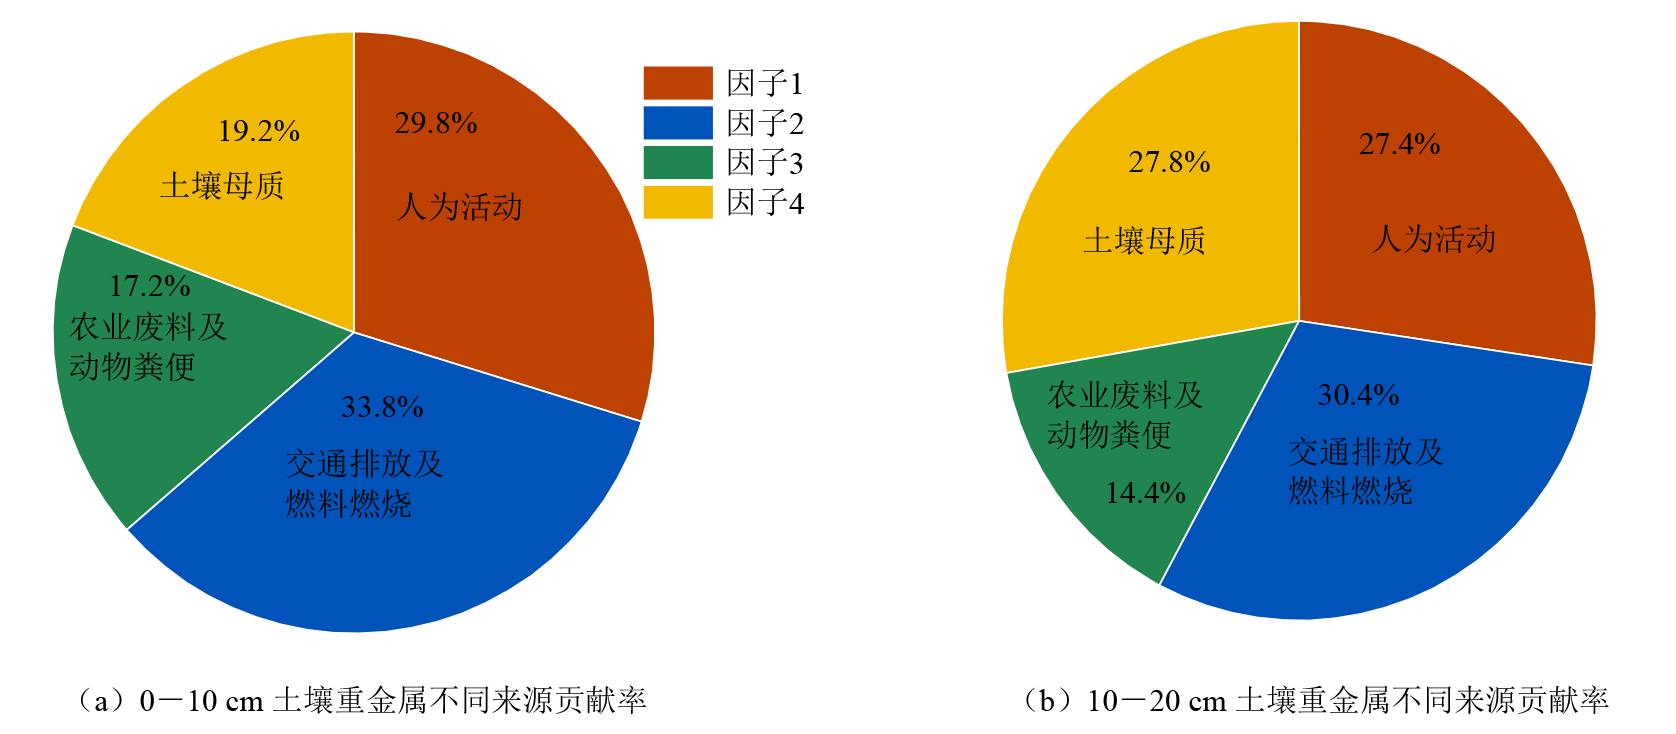
图7 PMF模型中不同土层各土壤重金属不同来源的贡献率
Figure 7 Contribution rate of different sources of soil heavy metals in the PMF model
| [1] |
AN S W, LIU N T, LI X M, et al., 2022. Understanding heavy metal accumulation in roadside soils along major roads in the Tibet Plateau[J]. Science of the Total Environment, 802: 149865.
DOI URL |
| [2] |
BAI Y R, ZHANG Y H, LIU X, et al., 2023. The spatial distribution and source apportionment of heavy metals in soil of Shizuishan, China[J]. Environmental Earth Sciences, 82(21): 494.
DOI |
| [3] |
BHUIYAN M A H, KARMAKER S C, BODRUD-DOZA M, et al., 2021. Enrichment, sources and ecological risk mapping of heavy metals in agricultural soils of dhaka district employing SOM, PMF and GIS methods[J]. Chemosphere, 263: 128339.
DOI URL |
| [4] |
CHEN P, KANG S, BAI J, et al., 2015. Yak dung combustion aerosols in the Tibetan Plateau: Chemical characteristics and influence on the local atmospheric environment[J]. Atmospheric Research, 156: 58-66.
DOI URL |
| [5] | CHEN R, HAN L, LIU Z, et al., 2022. Assessment of soil-heavy metal pollution and the health risks in a mining area from Southern Shaanxi Province, China[J]. Science of The Total Environment, 10(7): 385. |
| [6] |
CHI H J, LIU X, YANG X F, et al., 2024. Risk assessment and source identification of soil heavy metals: a case study of farmland soil along a river in the southeast of a mining area in Southwest China[J]. Environmental Geochemistry and Health, 46(2): 39.
DOI PMID |
| [7] |
DE SILVA S, BALL A S, HUYNH T, et al., 2016. Metal accumulation in roadside soil in Melbourne, Australia: Effect of road age, traffic density and vehicular speed[J]. Environmental Pollution, 208(Part A): 102-109.
DOI URL |
| [8] |
DU H L, WANG J S, WANG Y, et al., 2023. Contamination characteristics, source analysis, and spatial prediction of soil heavy metal concentrations on the Qinghai-Tibet Plateau[J]. Journal of Soils and Sediments, 23(5): 2202-2215.
DOI |
| [9] |
GUÉDÉ K G, YU Z B, SIMONOVIC S P, et al., 2025. Combined effect of landuse/landcover and climate change projection on the spatiotemporal streamflow response in cryosphere catchment in the Tibetan Plateau[J]. Journal of Environmental Management, 376: 124353.
DOI URL |
| [10] |
HAN R Y, XU Z F, 2022. Spatial distribution and ecological risk assessment of heavy metals in karst soils from the Yinjiang County, Southwest China[J]. Peer J, 10: e12716.
DOI URL |
| [11] | HE L H, GAO X H, 2016. Assessment of potential ecological risk for soil heavy metals in Sanjiang Source Region: A case study of Yushu County, Qinghai Province[J]. Journal of Agro-Environment Science, 35(6): 1071-1080. |
| [12] |
LIANG J H, LIU Z Y, TIAN Y Q, et al., 2023. Research on health risk assessment of heavy metals in soil based on multi-factor source apportionment: A case study in Guangdong Province, China[J]. Science of the Total Environment, 858(Part 3): 159991.
DOI URL |
| [13] |
LIU Y L, WANG J F, GUO J M, et al., 2022. Vertical distribution characteristics of soil mercury and its formation mechanism in permafrost regions: A case study of the Qinghai-Tibetan Plateau[J]. Journal of Environmental Sciences, 113: 311-321.
DOI PMID |
| [14] | LIU Z P, WANG L, YAN M J, et al., 2024. Source apportionment of soil heavy metals based on multivariate statistical analysis and the PMF model: A case study of the Nanyang Basin, China[J]. Environmental Technology & Innovation, 33: 103537. |
| [15] |
LONG Z J, ZHU H, BING H J, et al., 2021. Contamination, sources and health risk of heavy metals in soil and dust from different functional areas in an industrial city of Panzhihua City, Southwest China[J]. Journal of Hazardous Materials, 420: 126638.
DOI URL |
| [16] |
MARRUGO-NEGRETE J, PINEDO-HERNÁNDEZ J, DÍEZ S, 2017. Assessment of heavy metal pollution, spatial distribution and origin in agricultural soils along the Sinú River Basin, Colombia[J]. Environmental research, 154: 380-388.
DOI URL |
| [17] |
NURALYKYZY B, WANG P, DENG X, et al., 2021. Heavy metal contents and assessment of soil contamination in different land-use types in the Qaidam Basin[J]. Sustainability, 13(21): 12020.
DOI URL |
| [18] |
SHAH M T, ARA J, MUHAMMAD S, et al., 2012. Health risk assessment via surface water and sub-surface water consumption in the mafic and ultramafic terrain, Mohmand agency, northern Pakistan[J]. Journal of Geochemical Exploration, 118: 60-67.
DOI URL |
| [19] |
TAN C, WANG H, YANG Q C, et al., 2023. An integrated approach for quantifying source apportionment and source-oriented health risk of heavy metals in soils near an old industrial area[J]. Environmental Pollution, 323: 121271.
DOI URL |
| [20] |
TEPANOSYAN G, SAHAKYAN L, BELYAEVA O, et al., 2017. Human health risk assessment and riskiest heavy metal origin identification in urban soils of Yerevan, Armenia[J]. Chemosphere, 184: 1230-1240.
DOI PMID |
| [21] | WANG G, ZENG C, ZHANG F, et al., 2017. Traffic-related trace elements in soils along six highway segments on the Tibetan Plateau: Influence factors and spatial variation[J]. Science of the Total Environment, 581: 811-821. |
| [22] |
YUAN S J, YANG G D, ZHANG X L, et al., 2025. Assessment of distribution, contamination, ecological risks, and sources of heavy metals in soil from metal recycling sites[J]. Environmental Monitoring and Assessment, 197(6): 1-19.
DOI |
| [23] |
ZHANG H, WANG Z F, ZHANG Y L, et al., 2015. Identification of traffic-related metals and the effects of different environments on their enrichment in roadside soils along the Qinghai-Tibet highway[J]. Science of the Total Environment, 521-522: 160-172.
DOI URL |
| [24] |
ZHANG T, WANG P, WANG M G, et al., 2023b. Spatial distribution, source identification, and risk assessment of heavy metals in riparian soils of the Tibetan Plateau[J]. Environmental Research, 237: 116977.
DOI URL |
| [25] |
ZHANG Y X, SONG B, ZHOU Z Y, 2023a. Pollution assessment and source apportionment of heavy metals in soil from lead-zinc mining areas of south China[J]. Journal of Environmental Chemical Engineering, 11(2): 109320.
DOI URL |
| [26] |
ZHENG J T, WANG P, SHI H Y, et al., 2023. Quantitative source apportionment and driver identification of soil heavy metals using advanced machine learning techniques[J]. Science of the Total Environment, 873: 162371.
DOI URL |
| [27] | 安思危, 2021. 青藏高原重要交通沿线土壤-植被重金属累积特征与过程解析[D]. 重庆: 西南大学. |
| AN S W, 2021. Accumulation characteristics and progresses of heavy metals in soil-vegetation system along the important roads in the Tibet Plateau[D]. Chongqing: Southwest University. | |
| [28] | 陈林, 马琨, 马建军, 等, 2023. 宁夏引黄灌区农田土壤重金属生态风险评价及来源解析[J]. 环境科学, 44(1): 356-366. |
|
CHEN L, MA K, MA J J, et al., 2023. Risk assessment and sources of heavy metals in farmland soils of Yellow River irrigation area of Ningxia[J]. Environmental Science, 44(1): 356-366.
DOI URL |
|
| [29] | 杜昊霖, 王莺, 王劲松, 等, 2021. 青藏高原典型流域土壤重金属分布特征及其生态风险评价[J]. 环境科学, 42(9): 4422-4431. |
|
DU H L, WANG Y, WANG J S, et al., 2021. Distribution characteristics and ecological risk assessment of soil heavy metals in typical watersheds of the Qinghai-Tibet Plateau[J]. Environmental Science, 42(9): 4422-4431.
DOI URL |
|
| [30] | 高越, 吕童, 张蕴凯, 等, 2023. PMF和RF模型联用的土壤重金属污染来源解析与污染评价: 以西北某典型工业园区为例[J]. 环境科学, 44(6): 3488-3499. |
| GAO Y, LÜ T, ZHANG Y K, et al., 2023. Source apportionment and pollution assessment of soil heavy metal pollution using PMF and RF model: A case study of a typical industrial park in northwest China[J]. Environmental Science, 44(6): 3488-3499. | |
| [31] | 郭立本, 郭竞世, 1995. 青海省土壤环境背景值研究实验室质量控制[J]. 青海环境, 5(1): 40-42. |
| GUO L B, GUO J S, 1995. Quality Control of the Research Laboratory on Soil Environmental Background Values in Qinghai Province[J]. Journal of Qinghai Environment, 5(1): 40-42. | |
| [32] | 宫殿清, 王兆锋, 张镱锂, 等, 2025. 西藏一江两河地区草地土壤重金属的富集程度及其源解析[J]. 环境科学, 46(9): 6046-6055. |
| GONG D Q, WANG Z F, ZHANG Y L, et al., 2025. Enrichment levels and source apportionment of heavy metals in grassland soil of the one river and its two tributaries in Xizang[J]. Environmental Science, 46(9): 6046-6055. | |
| [33] | 韩琳, 徐夕博, 2020. 基于PMF模型及地统计的土壤重金属健康风险定量评价[J]. 环境科学, 41(11): 5114-5124. |
|
HAN L, XU X B, 2020. Quantitative evaluation of human health risk of heavy metals in soils based on positive matrix factorization model and Geo-statistics[J]. Environmental Science, 41(11): 5114-5124.
DOI URL |
|
| [34] | 何林华, 高小红, 2016. 三江源区土壤重金属的累积特征及潜在生态风险评价——以青海省玉树县为例[J]. 农业环境科学学报, 35(6): 1071-1080. |
| HE L H, GAO X H, 2016. Assessment of potential ecological risk for soil heavy metals in Sanjiang Source Region: A case study of Yushu[J]. Journal of Agro-Environment Science, 35(6): 1071-80. | |
| [35] | 李雷明, 2020. 青藏高原东北部土壤痕量元素环境地球化学行为[D]. 西宁: 中国科学院青海盐湖研究所. |
| LI L M, 2020. Environmental geochemical behaviors of trace elements in soils of the northeastern Qinhai-Tibet Plateau[D]. Xining: Qinghai Institute of Salt Lakes, Chinese Academy of Sciences. | |
| [36] | 李文明, 孙朝, 陈霄燕, 等, 2023. 青海省典型高山农业区域土壤重金属污染评价及来源探析[J]. 岩矿测试, 42(3): 598-615. |
| LI W M, SUN Z, CHEN X Y, et al., 2023. Evaluation and source of heavy metal pollution in surface soils in typical alpine agricultural areas of Qinghai Province[J]. Rock and Mineral Analysis, 42(3): 598-615. | |
| [37] | 孙雪纯, 侯书贵, 黄壬晖, 等, 2023. 可可西里特拉什湖中微塑料污染特征、来源和生态风险[J]. 环境科学学报, 43(2): 231-240. |
| SUN X C, HOU S G, HUANG R H, et al., 2023. Characteristics, sources and ecological risks of microplastics in Telashi Lake in Hoh Xil[J]. Acta Scientiae Circumstantiae, 43(2): 231-240. | |
| [38] | 孙友敏, 李少洛, 陈春竹, 等, 2018. 济南市机动车排气污染特征及对市区PM2.5的影响[J]. 环境科学学报, 38(4): 1384-1391. |
| SUN Y M, LI S L, CHEN C Z, et al., 2018. Study on characteristics of vehicle exhaust and the influence on PM2.5 in Jinan City[J]. Acta Scientiae Circumstantiae, 38(4): 1384-1391. | |
| [39] | 未亚西, 贺慧丹, 罗谨, 等, 2018. 三江源畜牧业示范区土壤重金属含量特征及评[J]. 中国环境监测, 34(4): 95-101. |
| WEI Y X, HE H D, LUO J, et al., 2018. Characteristics and potential risks evaluation of soil heavy metals of the stockbreeding demonstration zone in the source of Lantsang, Yellow and Yangtse River[J]. Environmental Monitoring in China, 34(4): 95-101. | |
| [40] | 卫佩茹, 2020. 环青海湖地区表层土壤中重金属污染研究[D]. 西安: 陕西师范大学. |
| WEI P R, 2020. Heavy metal pollution in surface soil around Qinghai Lake[D]. Xi’an: Shaanxi Normal University. | |
| [41] | 夏子书, 白一茹, 王幼奇, 等, 2022. 基于PMF模型的宁南山区小流域土壤重金属空间分布及来源解析[J]. 环境科学, 43(1): 432-441. |
| XIA Z S, BAI Y R, WANG Y Q, et al., 2022. Spatial distribution and source analysis of soil heavy metals in a small watershed in the mountainous area of southern Ningxia based on PMF model[J]. Environmental Science, 43(1): 432-441. | |
| [42] | 王佟, 章梅, 徐辉, 等, 2022. 青海木里煤田聚乎更矿区土壤肥力及重金属风险评价[J]. 煤田地质与勘探, 52(4): 113-120. |
| WANG T, ZHANG M, XU H, et al., 2022. Soil fertility and heavy metal risk assessment in Jvhugeng mining area, Muli Coalfield, Qinghai Province[J]. Coal Geology & Exploration, 50(4): 113-120. | |
| [43] | 王平, 曹军骥, 吴枫, 2010. 青海湖流域表层土壤环境背景值及其影响因素[J]. 地球环境学报, 1(3): 189-200. |
| WANG P, CAO J J, WU F, 2010. Environmental background values and its impact factors of topsoils within the Lake Qinghai catchment, northeast Tibetan Plateau, China[J]. Journal of Earth Environment, 1(3): 189-200. | |
| [44] | 王伟鹏, 卢宏玮, 冯三三, 2020. 西藏一江两河流域中部地区土壤重金属生态风险评价[J]. 农业资源与环境学报, 37(6): 970-980. |
| WANG W P, LÜ H W, FENG S S, 2020. Ecological risk assessment of soil heavy metals in the middle of the “One River and Two Tributaries” Basin in Tibet[J]. Journal of Agricultural Resources and Environment, 37(6): 970-980. | |
| [45] |
杨灵玉, 高小红, 张威, 等, 2016. 基于Hyperion影像植被光谱的土壤重金属含量空间分布反演——以青海省玉树县为例[J]. 应用生态学报, 27(6): 1775-1784.
DOI |
|
YANG L Y, GAO X H, ZHANG W, et al., 2016. Estimating heavy metal concentrations in topsoil from vegetation reflectance spectra of Hyperion images: A case study of Yushu County, Qinghai, China[J]. Chinese Journal of Applied Ecology, 27(6): 1775-1784.
DOI |
|
| [46] | 杨安, 王艺涵, 胡健, 等, 2020. 青藏高原表土重金属污染评价与来源解析[J]. 环境科学, 41(2): 886-894. |
| YANG A, WANG Y H, HU J, et al., 2020. Evaluation and source of heavy metal pollution in surface soil of Qinghai-Tibet Plateau[J]. Environmental Science, 41(2): 886-894. | |
| [47] | 张威, 高小红, 杨扬, 等, 2014. 基于光谱分析的土壤重金属含量估算研究——以三江源区玉树县和玛多县为例[J]. 土壤, 46(6): 1052-1060. |
| ZHANG W, GAO X H, YANG Y, et al., 2014. Estimating heavy metal contents for topsoil based on spectral analysis: A case study of Yushu and Maduo Counties in the Three-River Source Region[J]. Soils, 46(6): 1052-1060. | |
| [48] | 中华人民共和国国家质量监督检验检疫总局, 中国国家标准化管理委员会, 2018. 土壤质量总汞、总砷、总铅的测定原子荧光法第1部分: 土壤中总汞的测定: GB/T 22105.1—2008[S]. |
| General Administration of Quality Supervision, Inspection and Quarantine of the People’s Republic of China, Standardization Administration of the People’s Republic of China, 2018. Atomic fluorescence method for the determination of total mercury, total arsenic and total lead in soil Part 1: Determination of total mercury in soil: GB/T 22105. 1—2008[S]. | |
| [49] |
周会程, 周恒, 肖海龙, 等, 2020. 三江源区不同退化梯度高寒草原土壤重金属含量及其与养分和酶活性的变化特征[J]. 草地学报, 28(3): 784-792.
DOI |
| ZHOU H C, ZHOU H, XIAO H L, et al., 2020. The Variation characteristics of heavy metal content, nutrient and enzyme activity in soil of alpine steppe with different degradation gradient in the Three River-Headwaters Region[J]. Acta Agrestia Sinica, 28(3): 784-792. |
| [1] | 蒋凯, 柯常栋, 王丽萍, 李朋辉, 赖迪智, 张杨, 吴永洁, 吴仁人, 肖利平. 珠江广州河段粪便污染和溶解有机质的来源解析及分布特征[J]. 生态环境学报, 2025, 34(9): 1452-1462. |
| [2] | 张传华, 刘力, 代杰, 李曼曼, 张凤太, 邓凌. 基于土壤重金属污染和累积性评价的耕地环境质量类别划分与风险管控[J]. 生态环境学报, 2025, 34(2): 311-320. |
| [3] | 梁亚迪, 姚雪雯, 李涵博, 陈志怀, 历红波, 欧阳铭韩, 罗小三. 典型轮胎磨损颗粒中重金属的含量特征及生态和健康风险评估[J]. 生态环境学报, 2025, 34(11): 1770-1777. |
| [4] | 张洋洋, 刘学军. 北京城区冬季大气氨浓度、来源及启示[J]. 生态环境学报, 2025, 34(10): 1579-1587. |
| [5] | 欧阳美凤, 尹宇莹, 张金谌, 刘清霖, 谢意南, 方平. 洞庭湖典型水域重金属含量的空间分布与来源解析[J]. 生态环境学报, 2024, 33(8): 1269-1278. |
| [6] | 高文明, 宋芊, 张皓翔, 王士如. 基于生态系统服务功能和保护动物栖息地适宜性评价的优先保护区选取——以三江源地区为例[J]. 生态环境学报, 2024, 33(8): 1318-1328. |
| [7] | 吴文伟, 沈城, 沙晨燕, 林匡飞, 吴健, 谢雨晴, 周璇. 城市工业地块土壤重金属污染风险评价与源解析[J]. 生态环境学报, 2024, 33(5): 791-801. |
| [8] | 张淼, 王桂霞, 王昌伟, 贺艳云, 许艳芳, 李琪, 许杨, 张俊骁, 张桂芹. 济南市区黑碳污染变化特征及来源解析[J]. 生态环境学报, 2024, 33(4): 560-572. |
| [9] | 闫兴蕊, 龚平, 王小萍, 商立海, 李一农, 毛飞剑, 牛学锐, 张勃. 三江源地区土壤和牧草中的有机氯污染物:分布、来源和生态风险[J]. 生态环境学报, 2024, 33(3): 428-438. |
| [10] | 唐舒娅, 王春辉, 宋靖, 李刚. 环象山港区域土壤重金属污染特征及风险评估[J]. 生态环境学报, 2024, 33(11): 1768-1781. |
| [11] | 高文明, 宋芊, 张皓翔, 王士如. 三江源区生态脆弱性时空演变及驱动因素分析[J]. 生态环境学报, 2024, 33(10): 1648-1660. |
| [12] | 蒋伯琪, 浮天, 程昳璇, 苏枞枞, 沈建东, 于谨铖, 于兴娜. 沈阳市臭氧污染特征及其影响因素[J]. 生态环境学报, 2024, 33(1): 72-79. |
| [13] | 陈懂懂, 霍莉莉, 赵亮, 陈昕, 舒敏, 贺福全, 张煜坤, 张莉, 李奇. 青海高寒草地水热因子对土壤微生物生物量碳、氮空间变异的贡献——基于增强回归树模型[J]. 生态环境学报, 2023, 32(7): 1207-1217. |
| [14] | 许肖云, 饶芝菡, 蒋红斌, 张巍, 陈超, 杨永安, 胡艳丽, 魏海川. 遂宁工业园区夏季VOCs污染特征及其对O3、SOA生成潜势研究[J]. 生态环境学报, 2023, 32(5): 956-968. |
| [15] | 冯树娜, 吕家珑, 何海龙. KI淋洗对黄绵土汞污染的去除效果及土壤理化性状的影响[J]. 生态环境学报, 2023, 32(4): 776-783. |
| 阅读次数 | ||||||
|
全文 |
|
|||||
|
摘要 |
|
|||||