生态环境学报 ›› 2024, Vol. 33 ›› Issue (1): 72-79.DOI: 10.16258/j.cnki.1674-5906.2024.01.008
蒋伯琪1( ), 浮天1, 程昳璇1, 苏枞枞2, 沈建东3, 于谨铖1, 于兴娜1,*()
收稿日期:2023-09-05
出版日期:2024-01-18
发布日期:2024-03-19
通讯作者:
*于兴娜。E-mail: xnyu@nuist.edu.cn作者简介:蒋伯琪(2001年生),男,硕士研究生,主要研究方向为臭氧污染防治。E-mail: jiang2938236692@163.com
基金资助:
JIANG Boqi1(), FU Tian1, CHENG Yixuan1, SU Zongzong2, SHEN Jiandong3, YU Jincheng1, YU Xingna1,*()
Received:2023-09-05
Online:2024-01-18
Published:2024-03-19
摘要:
近年来中国城市O3污染问题日益突出,近地面O3已成为沈阳市的主要空气污染物之一。基于沈阳市2019年近地面臭氧(O3)及其前体物(VOCs和NO2)的逐时数据,结合同期气象观测资料,研究了2019年沈阳大气O3的季节变化特征,分析了VOCs和NO2以及气象条件对O3生成的影响;利用最大增量反应活性法(MIR)估算了沈阳大气VOCs的臭氧生成潜势(OFP),并运用正交矩阵因子分解法(PMF)进行了沈阳夏季VOCs的来源解析。结果表明:2019年沈阳市O3平均质量浓度夏季最高,其次是春季和秋季,冬季最低;四季O3日变化特征均表现为单峰型,质量浓度峰值出现在14:00左右,谷值出现在07:00左右。沈阳市O3质量浓度与温度、风速均呈现正相关关系(P=0.001,P=0.005),与相对湿度呈负相关关系(P=0.005);当温度达到30.0 ℃以上,O3质量浓度明显升高;风速低于3.0 m∙s−1时O3质量浓度小于75.0 μg∙m−3,而风速超过4.0 m∙s−1时O3质量浓度迅速升高至100 μg∙m−3;湿度小于20%时O3质量浓度较高,当湿度大于80%时O3质量浓度显著降低,由75.0 μg∙m−3降低至58.7 μg∙m−3。O3平均质量浓度与前体物VOCs和NO2质量浓度呈负相关关系(P=0.005),O3平均质量浓度最大值对应的NO2质量浓度区间为20.0-30.0 μg∙m−3。2019年沈阳市大气VOCs的臭氧生成潜势依次表现为烯烃>芳香烃>烷烃>炔烃,烯烃在4个季节均为最大贡献者,表明烯烃对沈阳市O3生成具有重要贡献。夏季沈阳市VOCs主要来源于石油化工源、溶剂使用源、液化石油气污染源、燃烧源和机动车排放源。沈阳作为我国传统重工业基地,加强对石油化工、溶剂使用和燃料挥发等方面的监管是降低沈阳市大气O3质量浓度水平的有效途径。该研究可以为沈阳市O3污染治理提供重要参考。
中图分类号:
蒋伯琪, 浮天, 程昳璇, 苏枞枞, 沈建东, 于谨铖, 于兴娜. 沈阳市臭氧污染特征及其影响因素[J]. 生态环境学报, 2024, 33(1): 72-79.
JIANG Boqi, FU Tian, CHENG Yixuan, SU Zongzong, SHEN Jiandong, YU Jincheng, YU Xingna. Characteristics of Ozone Pollution and Its Influencing Factors in Shenyang[J]. Ecology and Environment, 2024, 33(1): 72-79.
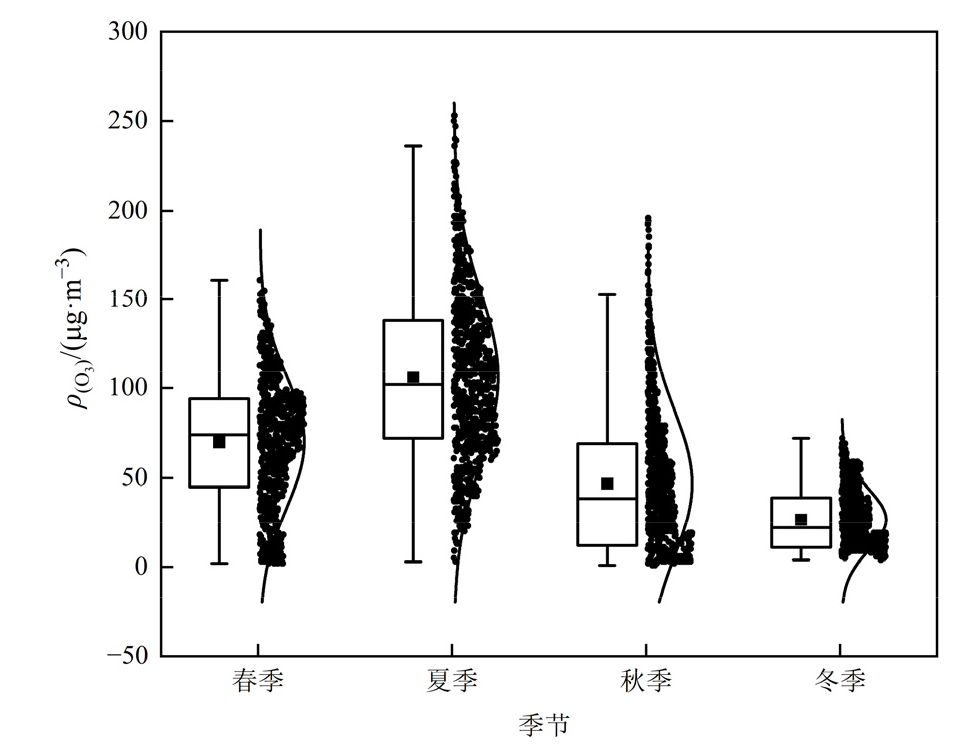
图1 沈阳市O3质量浓度季节变化箱型图
Figure 1 Box plot of seasonal variation of O3 concentration in Shenyang
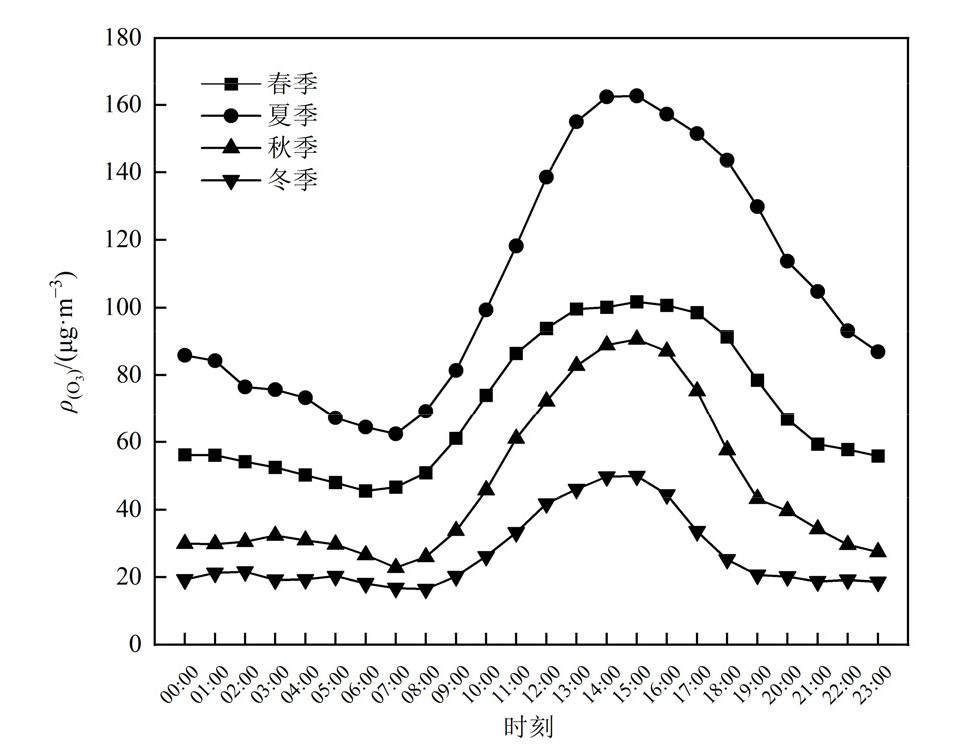
图2 沈阳市四季O3质量浓度日变化
Figure 2 The diurnal variation of O3 in the four seasons in Shenyang
| 季节 | 气象因子 | 拟合方程 | 相关系数 | P值 |
|---|---|---|---|---|
| 春季 | t | y=3.89x+31.23 | 0.69 | 0.001 |
| Hr | y= −0.39x+85.49 | −0.22 | 0.005 | |
| vw | y=14.10x+31.61 | 0.71 | 0.005 | |
| 夏季 | t | y=12.14x−215.32 | 0.77 | 0.001 |
| Hr | y= −2.45x+290.80 | −0.69 | 0.005 | |
| vw | y=24.11x+61.48 | 0.46 | 0.005 | |
| 秋季 | t | y=5.34x−14.25 | 0.76 | 0.001 |
| Hr | y= −0.41x+69.84 | −0.19 | 0.005 | |
| vw | y=15.83x+17.97 | 0.42 | 0.005 | |
| 冬季 | t | y=1.34x+38.53 | 0.36 | 0.001 |
| Hr | y= −0.63x+54.26 | −0.58 | 0.005 | |
| vw | y=8.43x+11.28 | 0.53 | 0.005 |
表1 气象因子与O3拟合方程及相关系数
Table 1 Fitted equation of meteorological factors to O3 and its correlation coefficient
| 季节 | 气象因子 | 拟合方程 | 相关系数 | P值 |
|---|---|---|---|---|
| 春季 | t | y=3.89x+31.23 | 0.69 | 0.001 |
| Hr | y= −0.39x+85.49 | −0.22 | 0.005 | |
| vw | y=14.10x+31.61 | 0.71 | 0.005 | |
| 夏季 | t | y=12.14x−215.32 | 0.77 | 0.001 |
| Hr | y= −2.45x+290.80 | −0.69 | 0.005 | |
| vw | y=24.11x+61.48 | 0.46 | 0.005 | |
| 秋季 | t | y=5.34x−14.25 | 0.76 | 0.001 |
| Hr | y= −0.41x+69.84 | −0.19 | 0.005 | |
| vw | y=15.83x+17.97 | 0.42 | 0.005 | |
| 冬季 | t | y=1.34x+38.53 | 0.36 | 0.001 |
| Hr | y= −0.63x+54.26 | −0.58 | 0.005 | |
| vw | y=8.43x+11.28 | 0.53 | 0.005 |
| t/ ℃ | O3质量浓度/ (μg∙m−3) | Hr/ % | O3质量浓度/ (μg∙m−3) | vw/ (m∙s−1) | O3质量浓度/ (μg∙m−3) |
|---|---|---|---|---|---|
| ≤0 | 25.4 | ≤20 | 75.2 | ≤1.0 | 35.9 |
| 0‒10.0 | 35.6 | 20‒40 | 52.3 | 1.0‒2.0 | 53.0 |
| 10.0‒20.0 | 68.0 | 40‒60 | 59.1 | 2.0‒3.0 | 74.6 |
| 20.0‒30.0 | 98.4 | 60‒80 | 75.0 | 3.0‒4.0 | 87.1 |
| >30.0 | 173 | >80 | 58.7 | >4.0 | 99.3 |
表2 不同气象要素区间内O3质量浓度
Table 2 Concentration of O3 in different meteorological factors
| t/ ℃ | O3质量浓度/ (μg∙m−3) | Hr/ % | O3质量浓度/ (μg∙m−3) | vw/ (m∙s−1) | O3质量浓度/ (μg∙m−3) |
|---|---|---|---|---|---|
| ≤0 | 25.4 | ≤20 | 75.2 | ≤1.0 | 35.9 |
| 0‒10.0 | 35.6 | 20‒40 | 52.3 | 1.0‒2.0 | 53.0 |
| 10.0‒20.0 | 68.0 | 40‒60 | 59.1 | 2.0‒3.0 | 74.6 |
| 20.0‒30.0 | 98.4 | 60‒80 | 75.0 | 3.0‒4.0 | 87.1 |
| >30.0 | 173 | >80 | 58.7 | >4.0 | 99.3 |

图3 沈阳市四季O3质量浓度与风向风速变化关系图
Figure 3 Relationship between O3 concentration and wind direction and wind speed in four seasons of Shenyang
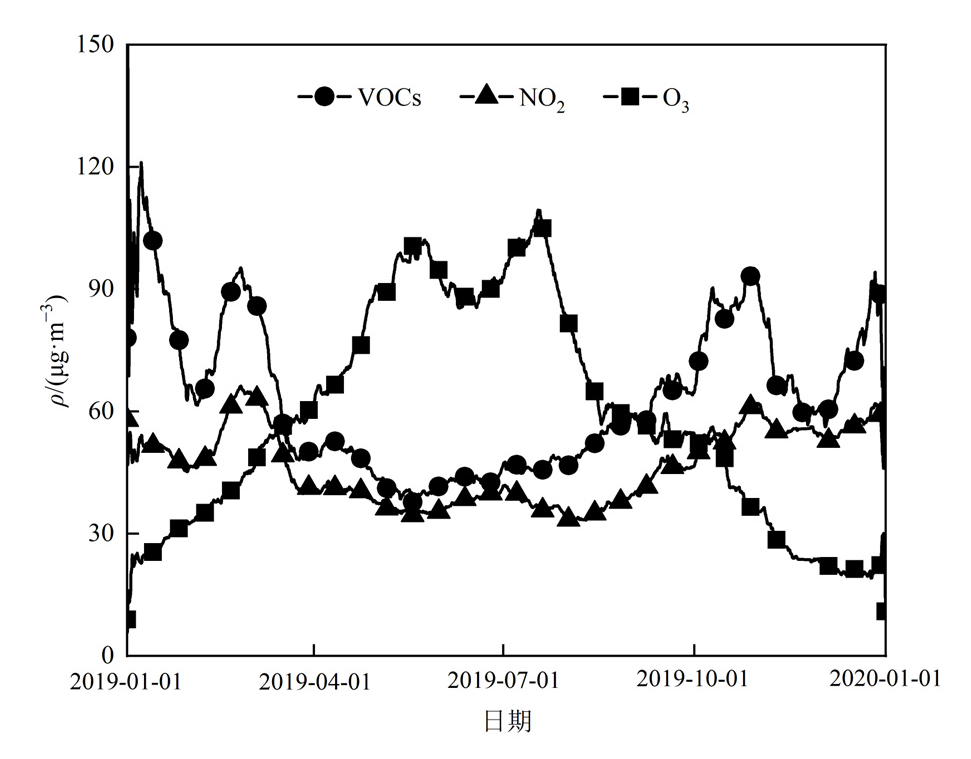
图4 沈阳市2019年O3及其前体物VOCs、NO2质量浓度
Figure 4 Mass concentrations of O3, VOCs and NO2 in Shenyang in 2019
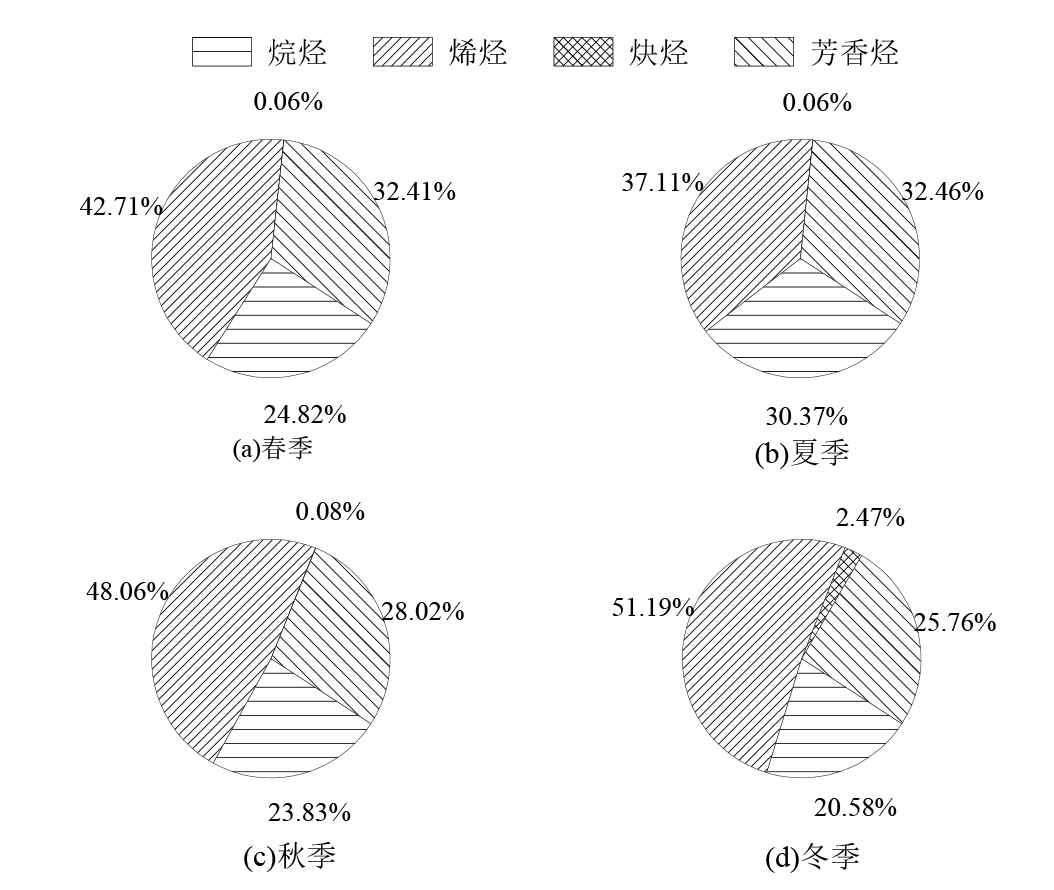
图5 沈阳市四季各类VOCs的OFP贡献占比
Figure5 The OFP contribution of various VOCs in four seasons of Shenyang
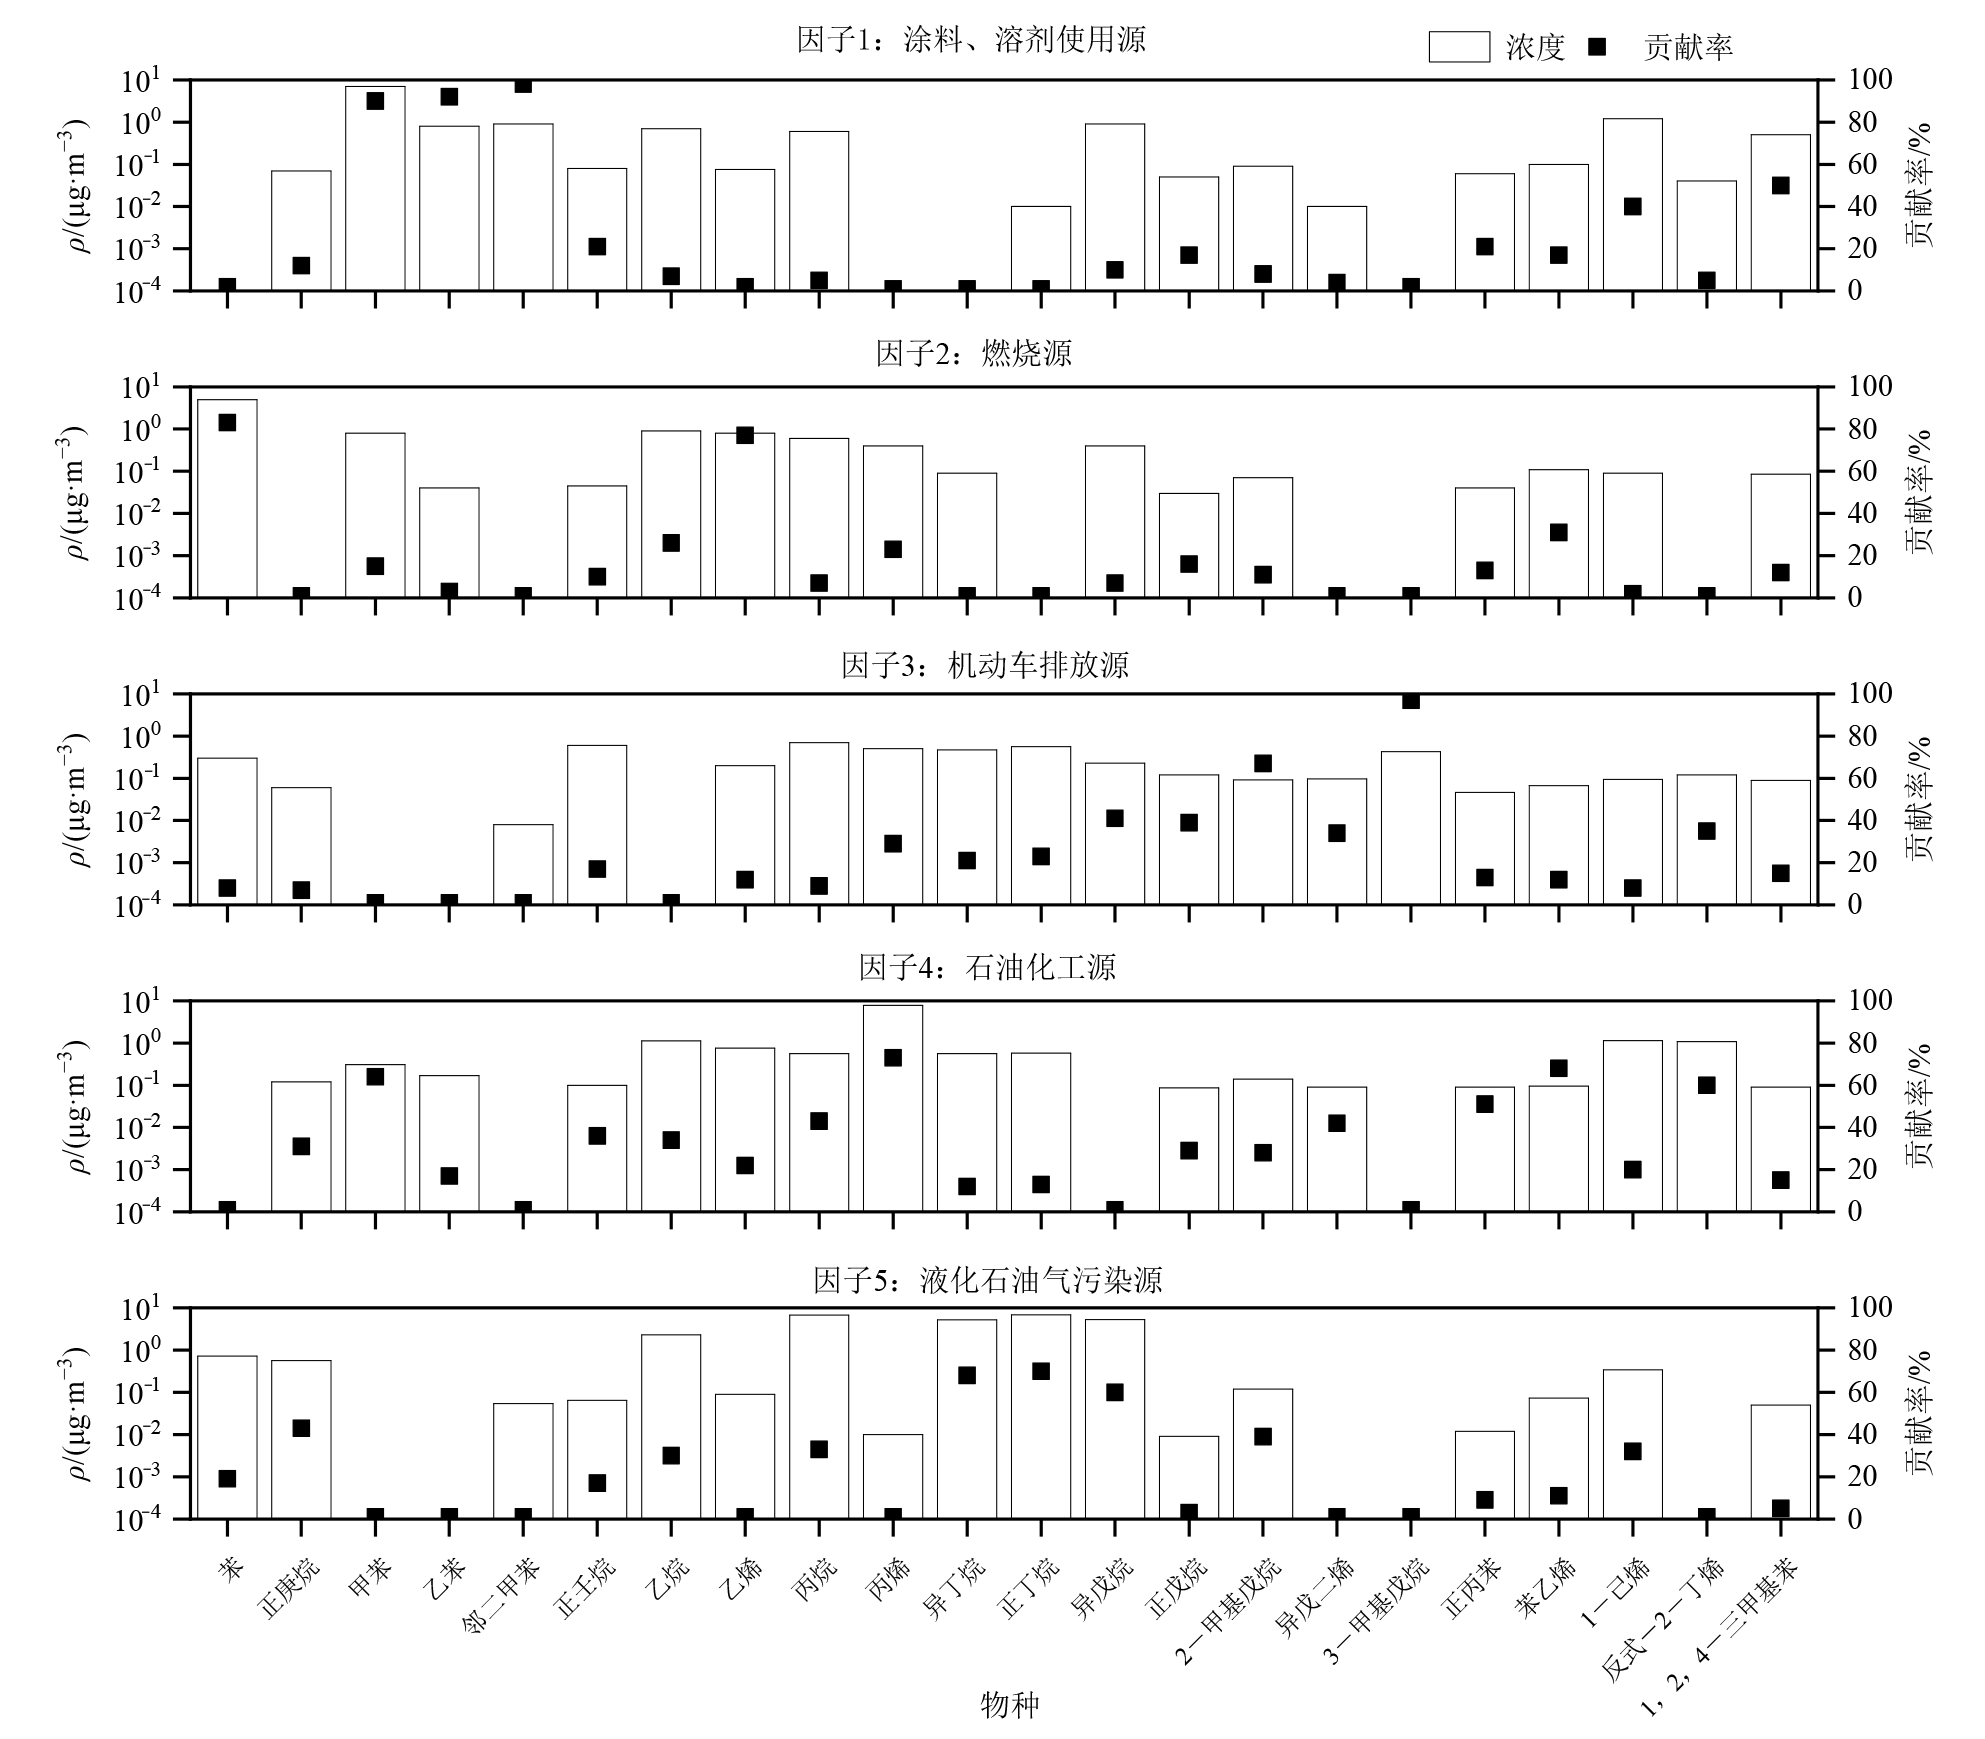
图6 VOCs的PMF源解析因子谱图
Figure 6 Contribution of each VOCs species to each factor by PMF method
| [1] |
ATKINSON R, 2000. Atmospheric chemistry of VOCs and NOx[J]. Atmospheric Environment, 34(12-14): 2063-2101.
DOI URL |
| [2] |
BATTERMAN S A, PENG C Y, JAMES B, et al., 2002. Levels and composition of volatile organic compounds on commuting routes in Detroit, Michigan[J]. Atmospheric Environment, 36(39-40): 6015-6030.
DOI URL |
| [3] | CARTER W P L, 2010. Development of the SAPRC-07chemical mechanism and updated ozone reactivity scales[M]. California: California Air Resources Board, Research Division: 178-205. |
| [4] |
CHIANG P C, CHING Y C, CHING E E, 1996. Characterization of hazardous air pollution emitted from motor vehicles[J]. Toxicological Environmental Chemistry, 56(1-4): 85-104.
DOI URL |
| [5] |
DUAN J C, TAN J H, YANG L, et al., 2008. Concentration sources and ozone formation potential of volatile organic compounds (VOCs) during ozone episode in Beijing[J]. Atmospheric Research, 88(1): 25-35.
DOI URL |
| [6] |
FAN H, ZHAO C F, YANG Y K, 2020. A comprehensive analysis of the spatio-temporal variation of urban air pollution in China during 2014-2018[J]. Atmospheric Environment, 220: 117066.
DOI URL |
| [7] |
HAN L X, CHEN L H, LI K W, et al., 2019. Source apportionment of volatile organic compounds (VOCs) during ozone polluted days in Hangzhou, China[J]. Atmosphere, 10(12): 780.
DOI URL |
| [8] |
HUI L R, LIU X G, TAN Q W, et al., 2018. Characteristics, source apportionment and contribution of VOCs to ozone formation in Wuhan, Central China[J]. Atmospheric Environment, 192: 55-71.
DOI URL |
| [9] | KALABOKAS P, HJORTH J, FORET G, et al., 2017. An investigation on the origin of regional springtime ozone episodes in the western Mediterranean[J]. Atmospheric Chemistry and Physics, 17(6): 3905-3928. |
| [10] | LI B W, HO S S H, GONG S L, et al., 2019. Characterization of VOCs and their related atmospheric processes in a central Chinese city during severe ozone pollution periods[J]. Atmospheric Chemistry and Physics, 19(1): 617-638. |
| [11] |
LIU Y, SONG M, LIU X, et al., 2020. Characterization and sources of volatile organic compounds (VOCs) and their related changes during ozone pollution days in 2016 in Beijing, China[J]. Environmental Pollution, 257: 113599.
DOI URL |
| [12] |
SIMAYI M, SHI Y Q, XI Z Y, et al., 2020. Understanding the sources and spatiotemporal characteristics of VOCs in the Chengdu Plain, China, through measurement and emission inventory[J]. Science of the Total Environment, 714: 136692.
DOI URL |
| [13] |
SITCH S, COX P M, COLLINS W J, et al., 2007. Indirect radiative forcing of climate change through ozone effects on the land-carbon sink[J]. Nature, 448(7155): 791-794.
DOI |
| [14] | THORNHILL D A, WILLIAMS A E, ONASCH T B, et al., 2010. Application of positive matrix factorization to on-road measurements for source apportionment of diesel- and gasoline-powered vehicle emissions in Mexico City[J]. Atmospheric Chemistry and Physics, 10(8): 3629-3644. |
| [15] |
WANG Q L, LI S J, DONG M L, et al., 2018. VOCs emission characteristics and priority control analysis based on VOCs emission inventories and ozone formation potentials in Zhoushan[J]. Atmospheric Environment, 182: 234-241.
DOI URL |
| [16] |
WANG T, XUE L K, BRIMBLECOMBE P, et al., 2017. Ozone pollution in China: a review of concentrations, meteorological influences, chemical precursors, and effects[J]. Science of the Total Environment, 575: 1582-1596.
DOI URL |
| [17] |
XU C X, HE X J, SUN S D, et al., 2022. Sensitivity of ozone formation in summer in Jinan using observation-based model[J]. Atmosphere, 13(12): 2024.
DOI URL |
| [18] |
YANG S D, LI X, SONG M D, et al., 2021. Characteristics and sources of volatile organic compounds during pollution episodes and clean periods in the Beijing-Tianjin-Hebei region[J]. Science of the Total Environment, 799: 149491.
DOI URL |
| [19] |
YU R L, LIN Y L, ZOU J H, et al., 2021. Review on atmospheric ozone pollution in China: formation, spatiotemporal distribution, precursors and affecting factors[J]. Atmosphere, 12(12): 1675.
DOI URL |
| [20] |
ZHANG C, LIU X G, ZHANG Y Y, et al., 2021. Characteristics, source apportionment and chemical conversions of VOCs based on a comprehensive summer observation experiment in Beijing[J]. Atmospheric Pollution Research, 12(3): 230-241.
DOI URL |
| [21] |
ZHAO S P, YIN D Y, YU Y, et al., 2020. PM2.5 and O3 pollution during 2015-2019 over 367 Chinese cities: spatiotemporal variations, meteorological and topographical impacts[J]. Environmental Pollution, 264: 114694.
DOI URL |
| [22] |
ZHENG H, KONG S F, CHEN N, et al., 2021. Source apportionment of volatile organic compounds: implications to reactivity, ozone formation, and secondary organic aerosol potential[J]. Atmospheric Research, 249: 105344.
DOI URL |
| [23] |
ZHOU B A, ZHAO T Y, MA J, et al., 2022. Characterization of VOCs during nonheating and heating periods in the typical suburban area of Beijing, China: sources and health assessment[J]. Atmosphere, 13(4): 560.
DOI URL |
| [24] | 邓思欣, 刘永林, 司徒淑姆, 等, 2021. 珠三角典型产业重镇大气VOCs污染特征及来源解析[J]. 中国环境科学, 41(7): 2993-3003. |
| DENG S X, LIU Y L, SITU S M, et al., 2021. Characteristics and source apportionment of volatile organic compounds in an industrial town of Pearl River Delta[J]. China Environmental Science, 41(7): 2993-3003. | |
| [25] | 冯兆忠, 彭金龙, 2020. 地表臭氧对中国主要粮食作物产量与品质的影响: 现状与展望[J]. 农业环境科学学报, 39(4): 797-804. |
| FENG Z Z, PENG J L, 2020. Effects of ground-level ozone on grain yield and quality of cereal crops in China: status and perspectives[J]. Journal of Agro-Environment Science, 39(4): 797-804. | |
| [26] | 符传博, 周航, 2021. 中国城市臭氧的形成机理及污染影响因素研究进展[J]. 中国环境监测, 37(2): 33-43. |
| FU C B, ZHOU H, 2021. Research progress on the formation mechanism and impact factors of urban ozone pollution in China[J]. Environmental Monitoring in China, 37(2): 33-43. | |
| [27] | 何琰, 林惠娟, 曹舒娅, 等, 2023. 城市臭氧污染特征与高影响气象因子: 以苏州为例[J]. 环境科学, 44(1): 85-93. |
| HE Y, LIN H J, CAO S Y, et al., 2023. Characteristics of ozone pollution and high-impact meteorological factors in urban cities: A case of Suzhou[J]. Environmental Science, 44(1): 85-93. | |
| [28] | 库盈盈, 任万辉, 苏枞枞, 等, 2021. 沈阳市不同功能区挥发性有机物分布特征及臭氧生成潜势[J]. 环境科学, 42(11): 5201-5209. |
| KU Y Y, REN W H, SU Z Z, et al., 2021. Pollution characteristics and ozone formation potential of ambient VOCs in different functional zones of Shenyang, China[J]. Environmental Science, 42(11): 5201-5209. | |
| [29] | 李强强, 2019. 沈阳地区臭氧浓度时空分布特征及影响因素研究[D]. 沈阳: 沈阳航空航天大学. |
| LI Q Q, 2019. Spatial and temporal distribution characteristics and influencing factors of ozone concentration in Shenyang area[D]. Shenyang: Shenyang Aerospace University. | |
| [30] | 刘建, 吴兑, 范绍佳, 等, 2017. 前体物与气象因子对珠江三角洲臭氧污染的影响[J]. 中国环境科学, 37(3): 813-820. |
| LIU J, WU D, FAN S J, et al., 2017. Impacts of precursors and meteorological factors on ozone pollution in Pearl River Delta[J]. China Environmental Science, 37(3): 813-820. | |
| [31] | 刘晶淼, 丁裕国, 黄永德, 等, 2003. 太阳紫外辐射强度与气象要素的相关分析[J]. 高原气象, 22(1): 45-50. |
| LIU J M, DING Y G, HUANG Y D, et al., 2003. Correlation analyses between intensity of solar ultraviolet radiation and meteorological elements[J]. Plateau Meteorology, 22(1): 45-50. | |
| [32] | 罗瑞雪, 刘保双, 梁丹妮, 等, 2021. 天津市郊夏季的臭氧变化特征及其前体物VOCs的来源解析[J]. 环境科学, 42(1): 75-87. |
|
LUO R X, LIU B S, LIANG D N, et al., 2021. Characteristics of ozone and source apportionment of the precursor VOCs in Tianjin suburbs in summer[J]. Environmental Science, 42(1): 75-87.
DOI URL |
|
| [33] | 任万辉, 2021. 沈阳地区臭氧污染日时空变化特征及天气分型研究[J]. 中国环境监测, 37(4): 75-82. |
| REN W H, 2021. Study on spatial and temporal variation characteristics of ozone pollution and weather classification in Shenyang[J]. Environmental Monitoring in China, 37(4): 75-82. | |
| [34] | 孙学斌, 王男, 2021. 沈阳市典型区域环境空气中VOCs来源解析[J]. 环境保护与循环经济, 41(12): 59-66. |
| SUN X B, WANG N, 2021. Analysis of VOCs sources in ambient air in typical areas of Shenyang[J]. Environmental Protection and Circular Economy, 41(12): 59-66. | |
| [35] | 王倩, 陈长虹, 王红丽, 等, 2013. 上海市秋季大气VOCs对二次有机气溶胶的生成贡献及来源研究[J]. 环境科学, 34(2): 424-433. |
| WANG Q, CHEN C H, WANG H L, et al., 2013. Forming potential of secondary organic aerosols and sources apportionment of VOCs in autumn of Shanghai, China[J]. Environmental Science, 34(2): 424-433. | |
| [36] | 王帅, 王琦, 刘闽, 等, 2019. 沈阳环境空气臭氧浓度及累积速率时序曲线模拟研究[J]. 中国环境监测, 35(5): 26-36. |
| WANG S, WANG Q, LIU M, et al., 2019. Simulation of environmental air ozone concentration and cumulative rate time series curve in Shenyang[J]. Environmental Monitoring in China, 35(5): 26-36. | |
| [37] | 徐虹, 肖致美, 陈魁, 等, 2019. 天津市2017年重污染过程二次无机化学污染特征分析[J]. 环境科学, 40(6): 2519-2525. |
| XU H, XIAO Z M, CHEN K, et al., 2019. Secondary inorganic pollution characteristics during heavy pollution episodes of 2017 in Tianjin[J]. Environmental Science, 40(6): 2519-2525. | |
| [38] | 严茹莎, 陈敏东, 高庆先, 等, 2013. 北京夏季典型臭氧污染分布特征及影响因子[J]. 环境科学研究, 26(1): 43-49. |
| YAN R S, CHEN M D, GAO Q X, et al., 2013. Characteristics of typical ozone pollution distribution and impact factors in Beijing in summer[J]. Research of Environmental Sciences, 26(1): 43-49. |
| [1] | 王传扬, 张小玲, 兰琳惠, 潘婕. 2022年夏季高温干旱对四川盆地污染物浓度变化的影响分析[J]. 生态环境学报, 2024, 33(1): 80-91. |
| [2] | 陈鸿展, 区晖, 叶四化, 张倩华, 周树杰, 麦磊. 珠江广州段水体微塑料的时空分布特征及生态风险评估[J]. 生态环境学报, 2023, 32(9): 1663-1672. |
| [3] | 闫学军, 郝赛梅, 张荣荣, 秦华, 高素莲, 王锋, 靳宪忠, 孙友敏, 张桂芹. 家居市场挥发性有机物排放成分谱及排放估算[J]. 生态环境学报, 2023, 32(6): 1070-1077. |
| [4] | 许肖云, 饶芝菡, 蒋红斌, 张巍, 陈超, 杨永安, 胡艳丽, 魏海川. 遂宁工业园区夏季VOCs污染特征及其对O3、SOA生成潜势研究[J]. 生态环境学报, 2023, 32(5): 956-968. |
| [5] | 温丽容, 江明, 黄渤, 袁鸾, 周炎, 陆炜梅, 张莹, 刘明, 张力昀. 珠三角典型区域臭氧成因分析与VOCs来源解析——以中山为例[J]. 生态环境学报, 2023, 32(3): 500-513. |
| [6] | 符传博, 丹利, 佟金鹤, 陈红. 海口市区臭氧污染变化特征及潜在源区分析[J]. 生态环境学报, 2023, 32(2): 331-340. |
| [7] | 李姝亭, 胡冠九, 罗小三. 大气环境中全(多)氟烷基化合物(PFASs)的来源、分布及健康风险研究进展[J]. 生态环境学报, 2023, 32(12): 2103-2114. |
| [8] | 黄国锋, 贺斌, 谢志宜, 刘军, 王安侯, 廖彤, 王博瑾, 郝贝贝. 广东省农业源污染对水环境的影响及其空间分异格局[J]. 生态环境学报, 2023, 32(12): 2207-2215. |
| [9] | 樊珂宇, 高原, 赖子尼, 曾艳艺, 刘乾甫, 李海燕, 麦永湛, 杨婉玲, 魏敬欣, 孙金辉, 王超. 珠三角河网鱼类微塑料污染特征研究[J]. 生态环境学报, 2022, 31(8): 1590-1598. |
| [10] | 王默雷, 李智慧, 陈来国, 郭送军, 刘明, 王硕, 陆海涛. 城市垃圾焚烧厂烟气及周边土壤中多溴联苯醚的污染特征[J]. 生态环境学报, 2022, 31(8): 1582-1589. |
| [11] | 朱丽, 闫怀忠, 孙友敏, 范晶, 刘光辉, 张桂芹. 山东典型重工业区降尘污染特征及成因分析[J]. 生态环境学报, 2022, 31(7): 1393-1399. |
| [12] | 李程程, 张子蕤, 宋晓萱, 孔娟娟, 韩阳, 阮亚男. 臭氧胁迫对大豆抗氧化代谢与生殖生长的影响[J]. 生态环境学报, 2022, 31(7): 1383-1392. |
| [13] | 陈雪泉, 孔彬, 兰青, 余志铨, 谢银斯, 黄俊毅. 胶黏剂生产行业VOCs组分特征及臭氧生成潜势分析[J]. 生态环境学报, 2022, 31(4): 750-758. |
| [14] | 李颖慧, 郭前进, 闫雨龙, 胡冬梅, 邓萌杰, 彭林. 晋城市环境空气中BTEX变化特征及来源[J]. 生态环境学报, 2022, 31(3): 504-511. |
| [15] | 刘娣, 苏超, 张红, 秦冠宇. 典型煤炭产业聚集区土壤重金属污染特征与风险评价[J]. 生态环境学报, 2022, 31(2): 391-399. |
| 阅读次数 | ||||||
|
全文 |
|
|||||
|
摘要 |
|
|||||