生态环境学报 ›› 2025, Vol. 34 ›› Issue (10): 1598-1608.DOI: 10.16258/j.cnki.1674-5906.2025.10.010
陈凡1( ), 池善庆2, 林财强2, 俞伯林2,*(), 谢蓉蓉1,3,4, 李家兵1,3,4, 黄翔峰5, 张海平5, 刘佳5, 吴乔枫2,5
收稿日期:2025-03-04
出版日期:2025-10-18
发布日期:2025-09-26
通讯作者:
E-mail: 作者简介:陈凡(2001年生),女,硕士研究生,主要研究方向为水域温室气体排放。E-mail: 1194881687@qq.com
CHEN Fan1(), CHI Shanqing2, LIN Caiqiang2, YU Bolin2,*(), XIE Rongrong1,3,4, LI Jiabing1,3,4, HUANG Xiangfeng5, ZHANG Haiping5, LIU Jia5, WU Qiaofeng2,5
Received:2025-03-04
Online:2025-10-18
Published:2025-09-26
摘要:
研究受居民用排水影响的城市水体溶存N2O的产排特征及影响因子对控制城市水域温室气体具有重要意义。选择福州城区自然河流-排污渠-人工湖连通系统,研究居民用排水影响下典型城市水体的表层溶存N2O的日变化及季节变化过程,并识别主要的环境影响因子。 结果表明,1)研究区域表层溶存N2O浓度为中等水平(11-476 nmol·L−1),但排放通量低于大多数城市河流(5-763 nmol·m−2·h−1),与河湖连通系统减缓温室气体产排有关。2)排污渠表层溶存N2O浓度显著高于自然河流和人工湖,主要受高氮环境以及pH、溶解氧(DO)的影响,各季节的日变化均显著;自然河流和人工湖溶存N2O仅在秋季18:00时出现浓度小高峰。3)排污渠表层N2O排放通量也显著高于自然河流和人工湖,各点位均有显著日变化;受风速和氮元素的影响,除秋季城市河渠在13:00达到峰值外,其余季节均于18:00达到排放峰值;流经城市的自然河流(R1)主要受到氮元素和风速的显著影响;流经林地和公园的自然河流(R3)与环境因子的相关性小;排污渠和人工湖的环境影响因子介于R1和R3之间。该研究为城市河湖系统的N2O温室气体分布格局、排放特征及环境影响因子研究提供了重要的理论依据。
中图分类号:
陈凡, 池善庆, 林财强, 俞伯林, 谢蓉蓉, 李家兵, 黄翔峰, 张海平, 刘佳, 吴乔枫. 城市河渠-人工湖连通系统表层溶存N2O浓度及排放通量研究[J]. 生态环境学报, 2025, 34(10): 1598-1608.
CHEN Fan, CHI Shanqing, LIN Caiqiang, YU Bolin, XIE Rongrong, LI Jiabing, HUANG Xiangfeng, ZHANG Haiping, LIU Jia, WU Qiaofeng. Surface Dissolved N2O Concentration and Emission Fluxes in an Urban River-canal-artificial Lake Linkage System[J]. Ecology and Environmental Sciences, 2025, 34(10): 1598-1608.

图1 研究区域采样点示意图
Figure 1 Schematic diagram of sampling points in the studied area
| 采样点 | 采样时间 | pH | ρ(DO)/(mg∙L−1) | tw/℃ | ρ(BOD5)/(mg∙L−1) | ρ(CODMn)/(mg∙L−1) | ρ(叶绿素a)/(μg∙L−1) |
|---|---|---|---|---|---|---|---|
| R1 | 夏季 | 6.62±0.26C | 6.09±0.43cB | 28.7±0.33aB | 1.16±0.07cB | 2.86±0.19bC | 2.50±0.49bB |
| 秋季 | 7.06±0.52B | 5.92±0.23cA | 22.3±0.52b | 1.54±0.27cB | 2.60±0.19bB | 5.24±1.22bB | |
| 冬季 | 7.28±0.15C | 9.73±0.42a | 17.5±3.26c | 3.15±0.51b | 2.81±0.36bAB | 17.8±3.34aA | |
| 春季 | 6.52±0.71B | 7.07±0.06bB | 18.6±1.27c | 4.30±0.55aA | 3.37±0.08aB | 2.96±0.21bB | |
| R2 | 夏季 | 6.69±0.08cC | 3.60±0.13bB | 31.4±0.91aA | 4.33±0.91aA | 6.13±0.68aA | 3.49±1.25B |
| 秋季 | 7.69±0.20aAB | 7.27±0.41aA | 22.4±0.90b | 1.85±0.73bAB | 3.16±0.19bB | 1.74±0.54B | |
| 冬季 | 7.20±0.24bC | 8.26±0.63a | 19.8±2.77b | 3.10±1.37ab | 3.36±0.42bA | 3.67±1.78B | |
| 春季 | 7.08±0.28bAB | 7.63±0.84aAB | 20.0±2.34b | 1.56±0.96bB | 3.44±0.39bB | 3.77±2.24B | |
| R3 | 夏季 | 7.70±0.22B | 4.48±0.56cB | 28.1±1.88aB | 1.60±0.32bB | 3.32±0.27bcC | 3.37±0.67B |
| 秋季 | 7.69±0.30AB | 3.69±0.37cB | 21.9±1.29b | 3.30±0.90bA | 4.56±1.05abA | 2.29±0.64B | |
| 冬季 | 7.96±0.20B | 8.94±0.37a | 17.8±3.00b | 2.32±0.50b | 2.12±0.60cB | 3.65±1.02B | |
| 春季 | 8.15±0.22A | 7.85±0.42bAB | 18.3±0.70b | 5.50±1.78aA | 4.98±0.74aA | 4.33±2.17B | |
| LC | 夏季 | 9.11±0.16aA | 11.4±2.35A | 32.7±0.85aA | 3.81±0.45A | 4.73±0.22aB | 33.2±5.15aA |
| 秋季 | 7.80±0.06bA | 7.48±1.39A | 21.9±0.35b | 2.38±1.00AB | 3.58±0.34bAB | 14.9±7.40bA | |
| 冬季 | 8.80±0.09aA | 8.61±4.13 | 17.5±2.16c | 2.85±0.74 | 2.33±0.19cB | 14.2±5.46bA | |
| 春季 | 7.75±0.85bA | 8.98±1.41A | 19.2±0.78bc | 4.46±1.42A | 5.05±0.49aA | 33.2±10.1aA |
表1 研究区域水体物理化学参数
Table 1 Physico-chemical parameters of water bodies in the studied area
| 采样点 | 采样时间 | pH | ρ(DO)/(mg∙L−1) | tw/℃ | ρ(BOD5)/(mg∙L−1) | ρ(CODMn)/(mg∙L−1) | ρ(叶绿素a)/(μg∙L−1) |
|---|---|---|---|---|---|---|---|
| R1 | 夏季 | 6.62±0.26C | 6.09±0.43cB | 28.7±0.33aB | 1.16±0.07cB | 2.86±0.19bC | 2.50±0.49bB |
| 秋季 | 7.06±0.52B | 5.92±0.23cA | 22.3±0.52b | 1.54±0.27cB | 2.60±0.19bB | 5.24±1.22bB | |
| 冬季 | 7.28±0.15C | 9.73±0.42a | 17.5±3.26c | 3.15±0.51b | 2.81±0.36bAB | 17.8±3.34aA | |
| 春季 | 6.52±0.71B | 7.07±0.06bB | 18.6±1.27c | 4.30±0.55aA | 3.37±0.08aB | 2.96±0.21bB | |
| R2 | 夏季 | 6.69±0.08cC | 3.60±0.13bB | 31.4±0.91aA | 4.33±0.91aA | 6.13±0.68aA | 3.49±1.25B |
| 秋季 | 7.69±0.20aAB | 7.27±0.41aA | 22.4±0.90b | 1.85±0.73bAB | 3.16±0.19bB | 1.74±0.54B | |
| 冬季 | 7.20±0.24bC | 8.26±0.63a | 19.8±2.77b | 3.10±1.37ab | 3.36±0.42bA | 3.67±1.78B | |
| 春季 | 7.08±0.28bAB | 7.63±0.84aAB | 20.0±2.34b | 1.56±0.96bB | 3.44±0.39bB | 3.77±2.24B | |
| R3 | 夏季 | 7.70±0.22B | 4.48±0.56cB | 28.1±1.88aB | 1.60±0.32bB | 3.32±0.27bcC | 3.37±0.67B |
| 秋季 | 7.69±0.30AB | 3.69±0.37cB | 21.9±1.29b | 3.30±0.90bA | 4.56±1.05abA | 2.29±0.64B | |
| 冬季 | 7.96±0.20B | 8.94±0.37a | 17.8±3.00b | 2.32±0.50b | 2.12±0.60cB | 3.65±1.02B | |
| 春季 | 8.15±0.22A | 7.85±0.42bAB | 18.3±0.70b | 5.50±1.78aA | 4.98±0.74aA | 4.33±2.17B | |
| LC | 夏季 | 9.11±0.16aA | 11.4±2.35A | 32.7±0.85aA | 3.81±0.45A | 4.73±0.22aB | 33.2±5.15aA |
| 秋季 | 7.80±0.06bA | 7.48±1.39A | 21.9±0.35b | 2.38±1.00AB | 3.58±0.34bAB | 14.9±7.40bA | |
| 冬季 | 8.80±0.09aA | 8.61±4.13 | 17.5±2.16c | 2.85±0.74 | 2.33±0.19cB | 14.2±5.46bA | |
| 春季 | 7.75±0.85bA | 8.98±1.41A | 19.2±0.78bc | 4.46±1.42A | 5.05±0.49aA | 33.2±10.1aA |
| 指标 | 时间差异(季节对比) | 空间差异(点位对比) |
|---|---|---|
| pH | R2:秋季>冬、春季>夏季;LC:夏、冬季>秋、春季 | LC>R1、R2、R3(夏、冬季) |
| DO | R1、R2、R3:冬季最高;LC:夏季最高 | 非冬季时,LC最高 |
| tw | 夏季>秋、冬、春季 | R2、LC>R1、R3(夏季) |
| BOD5 | R2:夏、冬季>秋、春季;其他点位:春季最高 | R2、LC>R1、R3(夏季);R1、R3、LC>R2(冬季) |
| CODMn | 除R2外,春季普遍偏高 | R2>LC>R1、R3(夏季);R3、LC>R1、R2(春季) |
| 叶绿素a | R1:冬季>夏、秋、春季;LC:夏、春季>秋、冬季 | LC>R1、R2、R3(夏、秋、春季) |
表2 研究区域主要水质参数差异汇总
Table 2 Summary of differences in key water quality parameters in the studied area
| 指标 | 时间差异(季节对比) | 空间差异(点位对比) |
|---|---|---|
| pH | R2:秋季>冬、春季>夏季;LC:夏、冬季>秋、春季 | LC>R1、R2、R3(夏、冬季) |
| DO | R1、R2、R3:冬季最高;LC:夏季最高 | 非冬季时,LC最高 |
| tw | 夏季>秋、冬、春季 | R2、LC>R1、R3(夏季) |
| BOD5 | R2:夏、冬季>秋、春季;其他点位:春季最高 | R2、LC>R1、R3(夏季);R1、R3、LC>R2(冬季) |
| CODMn | 除R2外,春季普遍偏高 | R2>LC>R1、R3(夏季);R3、LC>R1、R2(春季) |
| 叶绿素a | R1:冬季>夏、秋、春季;LC:夏、春季>秋、冬季 | LC>R1、R2、R3(夏、秋、春季) |
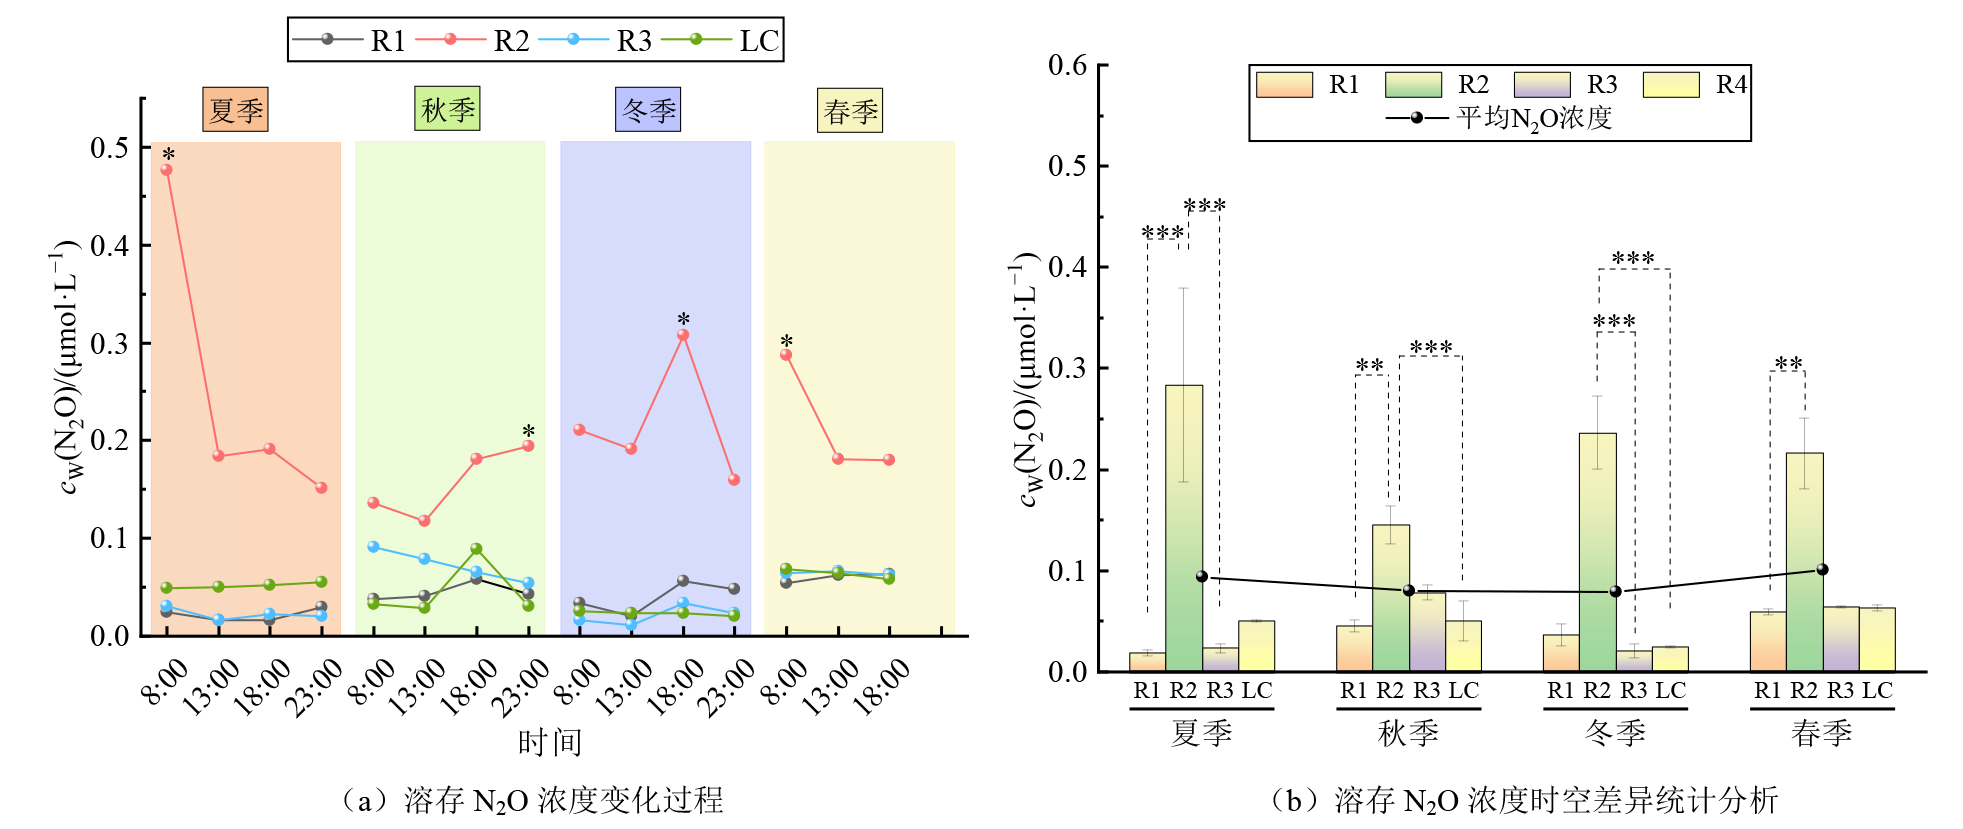
图2 研究区域溶存N2O浓度变化过程和时空差异统计分析 (a)n=2,*p≤0.05;(b)n=8,春季n=6,*p≤0.05,**p≤0.01,***p≤0.001。下同
Figure 2 Statistical analysis of variations in dissolved N?O concentrations and spatiotemporal differences in the studied area
| 点位 | 夏季 | 秋季 | 冬季 | 春季 | |||||||
|---|---|---|---|---|---|---|---|---|---|---|---|
| z | p | z | p | z | p | z | p | ||||
| R1 | −4.32 | 0 | −3.62 | 0.002 | −2.35 | 0.114 | −3.63 | 0.002 | |||
| R3 | 4.21 | 0 | 1.95 | 0.310 | 4.18 | 0 | 2.57 | 0.061 | |||
| LC | 1.71 | 0.528 | 4.34 | 0 | 3.7 | 0.001 | 2.61 | 0.054 | |||
表3 不同季节R2点位溶存N2O较其他点位显著性差异值
Table 3 Significantly different values of dissolved N2O at R2 site compared to other sites in different seasons
| 点位 | 夏季 | 秋季 | 冬季 | 春季 | |||||||
|---|---|---|---|---|---|---|---|---|---|---|---|
| z | p | z | p | z | p | z | p | ||||
| R1 | −4.32 | 0 | −3.62 | 0.002 | −2.35 | 0.114 | −3.63 | 0.002 | |||
| R3 | 4.21 | 0 | 1.95 | 0.310 | 4.18 | 0 | 2.57 | 0.061 | |||
| LC | 1.71 | 0.528 | 4.34 | 0 | 3.7 | 0.001 | 2.61 | 0.054 | |||
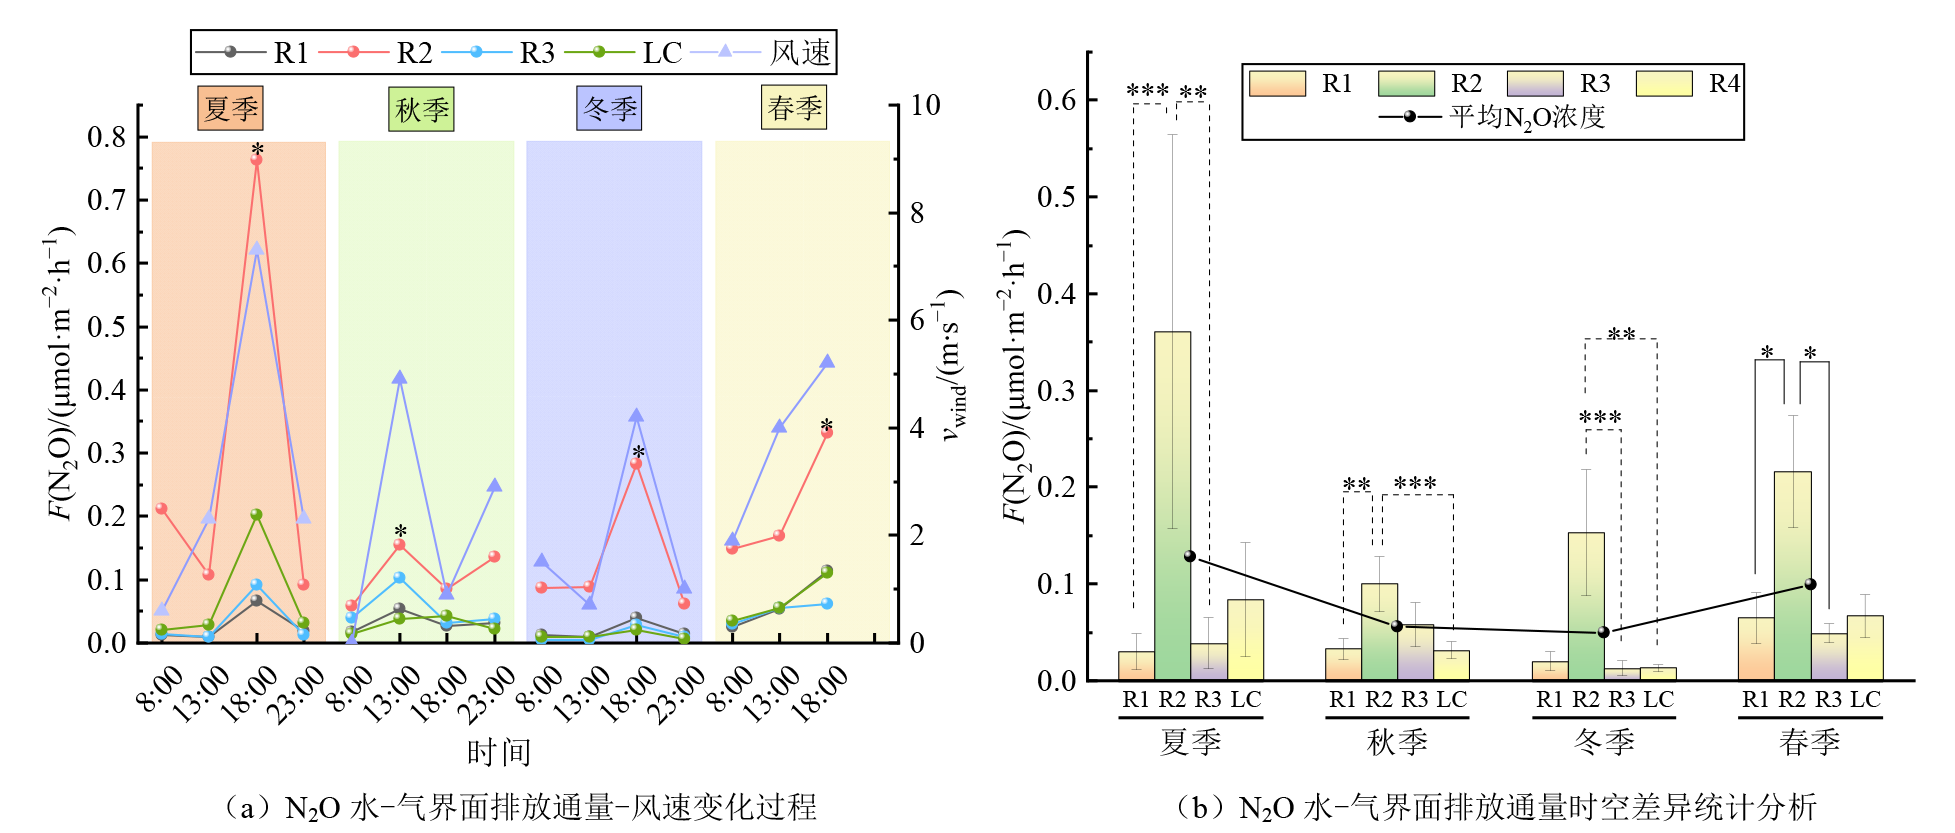
图3 研究区域N2O水-气界面排放通量-风速变化过程和时空差异统计分析
Figure 3 Statistical analysis of processes of N?O emission flux-wind speed variations across water-air interface and their spatiotemporal differences in the studied area
| 点位 | 夏季 | 秋季 | 冬季 | 春季 | |||||||
|---|---|---|---|---|---|---|---|---|---|---|---|
| z | p | z | p | z | p | z | p | ||||
| R1 | −3.73 | 0.001 | −3.44 | 0.004 | −2.53 | 0.068 | −3.1 | 0.012 | |||
| R3 | 3.57 | 0.002 | 2 | 0.274 | 4.1 | 0 | 3.10 | 0.012 | |||
| LC | 1.87 | 0.373 | 3.73 | 0.001 | 3.6 | 0.002 | 2.61 | 0.054 | |||
表4 不同季节R2点位N2O排放通量和其他点位显著性差异值
Table 4 Significantly different values of N2O emission fluxes at R2 site and other sites in different seasons
| 点位 | 夏季 | 秋季 | 冬季 | 春季 | |||||||
|---|---|---|---|---|---|---|---|---|---|---|---|
| z | p | z | p | z | p | z | p | ||||
| R1 | −3.73 | 0.001 | −3.44 | 0.004 | −2.53 | 0.068 | −3.1 | 0.012 | |||
| R3 | 3.57 | 0.002 | 2 | 0.274 | 4.1 | 0 | 3.10 | 0.012 | |||
| LC | 1.87 | 0.373 | 3.73 | 0.001 | 3.6 | 0.002 | 2.61 | 0.054 | |||
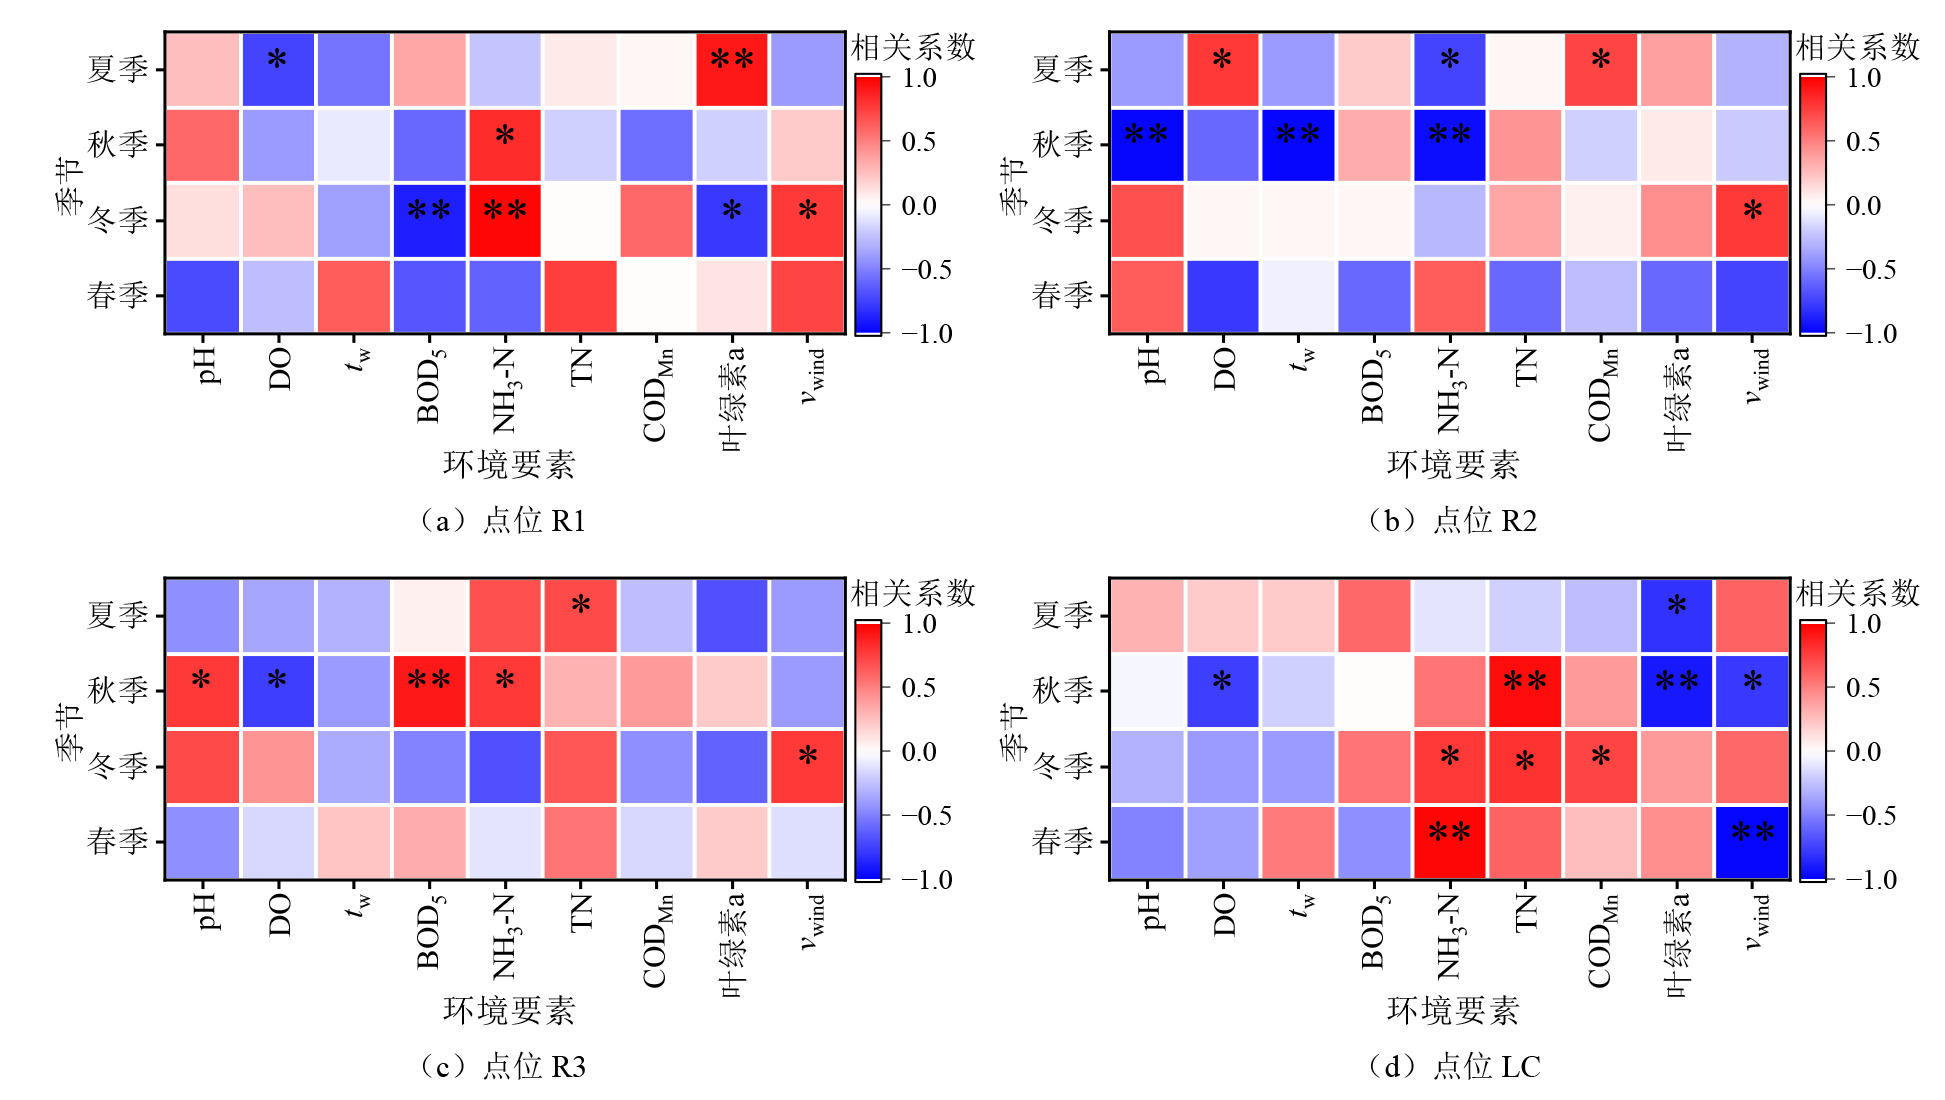
图4 不同点位溶存N2O浓度的季节性影响分析 n=8,春季n=6,*p≤0.05,**p≤0.01。下同
Figure 4 Analysis of the seasonal effects of dissolved N2O concentrations at different sites
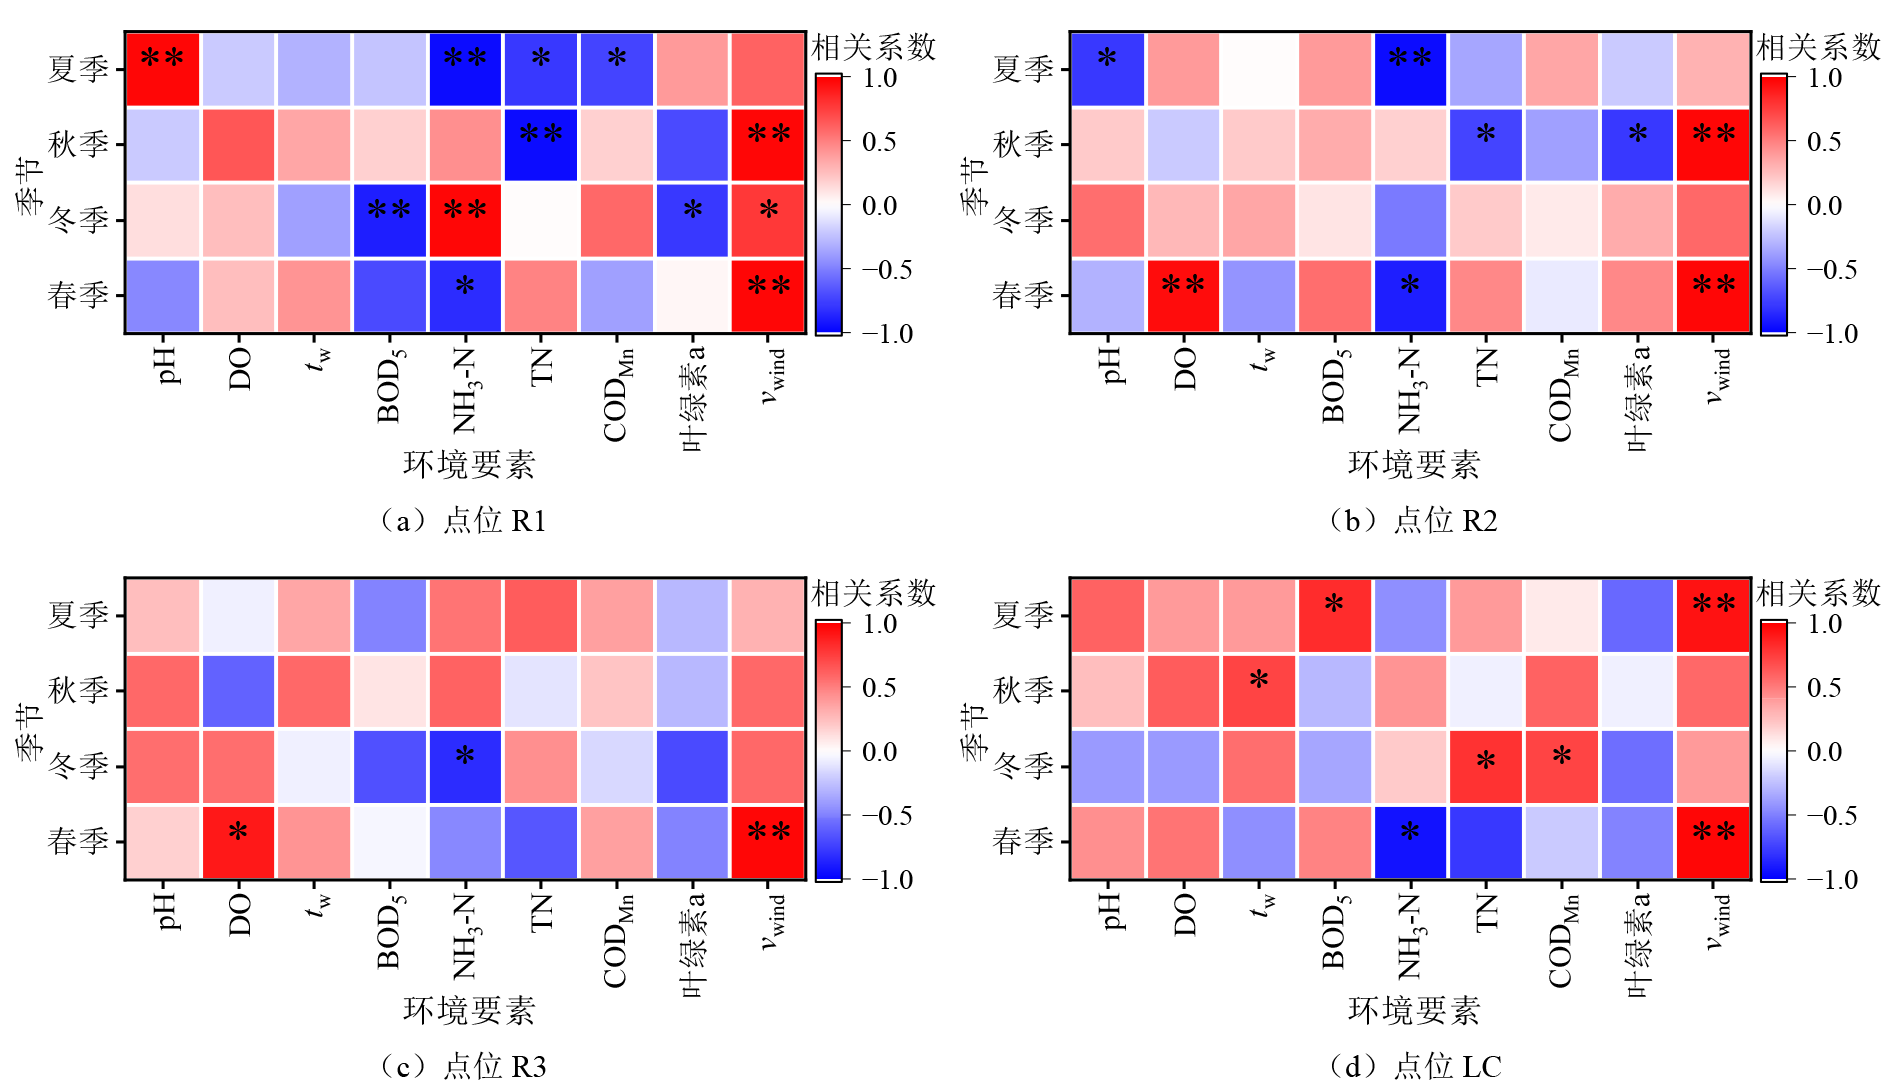
图5 不同点位N2O排放通量季节性影响分析
Figure 5 Analysis of the seasonal effects of N2O emission fluxes at different sites
| 研究区域 | 河湖类型 | cw(N2O)/ (nmol·L−1) | F(N2O)/(nmol·m−2·h−1) | ρ(DO)/(mg·L−1) | ρ(NH3-N)/(mg·L−1) | ρ(TN)/(mg·L−1) | 文献来源 |
|---|---|---|---|---|---|---|---|
| 本研究 | 城市河湖连通系统 | 11-476, 平均:89 | 5-763, 平均:83 | 7.303±2.525 | 0.836±0.798 | 4.48±3.82 | |
| 中国东南部 鳝鱼滩湿地 | 天然河流 | 季节平均: 5.6-14.2 | 平均:322 | 冬季:8.4 春季:8.5 | 季节平均: 0.44-1.35 | 季节平均: 1.62-2.81 | Yang et al., |
| 闽江河口 | 天然河流 | 0.99-55.9 | −118-180 | 2.54-10.3 | 0.03-0.7 | - | 漆梦婷等, |
| 太湖北部梅梁湾和 东南部徐口湾湖滨区 | 天然湖泊 | 北部:15.1 东南部:14.5 | 北部:150 东南部:20 | 北部:4.79 东南部:5.61 | - | - | Yang et al., |
| 渤海湾典型闸 控入海河流 | 天然河流 | 0.4-185 | −300-670 | 9.4-13.1 | 最高:0.21 | 最高:1.38 | 李肖正等, |
| 武汉市:长江以南7个河流和11个湖泊 | 城市河流、 城市河湖 连通系统 | 城市河流:326 城市河湖系统:49.7 | 城市河流:1.95×10⁴城市河湖系统:2.8×10³ | 城市河流:5.93 城市河湖系统:9.2 | 城市河流:3.6 城市河湖系统:1.1 | 城市河流:10.4 城市河湖系统:2.1 | Wang et al., |
| 天津城市河流 | 城市河流 | 18.7-234 | 87.5 | 7.9±2.8 | 1.9±1.6 | 6.01±2.13 | Liu et al., |
| 中国东部巢湖 | 城市湖泊 | 11.7-5.96×10³ 平均:410 | 1.96×10⁴ | 6.37±3.2 | 3.31±3.78 | 7.68±4.26 | Miao et al., |
表5 研究区域与其他区域溶存N2O浓度和排放通量结果对比
Table 5 Comparison of dissolved N2O concentration and emission flux results between the studied area and other regions
| 研究区域 | 河湖类型 | cw(N2O)/ (nmol·L−1) | F(N2O)/(nmol·m−2·h−1) | ρ(DO)/(mg·L−1) | ρ(NH3-N)/(mg·L−1) | ρ(TN)/(mg·L−1) | 文献来源 |
|---|---|---|---|---|---|---|---|
| 本研究 | 城市河湖连通系统 | 11-476, 平均:89 | 5-763, 平均:83 | 7.303±2.525 | 0.836±0.798 | 4.48±3.82 | |
| 中国东南部 鳝鱼滩湿地 | 天然河流 | 季节平均: 5.6-14.2 | 平均:322 | 冬季:8.4 春季:8.5 | 季节平均: 0.44-1.35 | 季节平均: 1.62-2.81 | Yang et al., |
| 闽江河口 | 天然河流 | 0.99-55.9 | −118-180 | 2.54-10.3 | 0.03-0.7 | - | 漆梦婷等, |
| 太湖北部梅梁湾和 东南部徐口湾湖滨区 | 天然湖泊 | 北部:15.1 东南部:14.5 | 北部:150 东南部:20 | 北部:4.79 东南部:5.61 | - | - | Yang et al., |
| 渤海湾典型闸 控入海河流 | 天然河流 | 0.4-185 | −300-670 | 9.4-13.1 | 最高:0.21 | 最高:1.38 | 李肖正等, |
| 武汉市:长江以南7个河流和11个湖泊 | 城市河流、 城市河湖 连通系统 | 城市河流:326 城市河湖系统:49.7 | 城市河流:1.95×10⁴城市河湖系统:2.8×10³ | 城市河流:5.93 城市河湖系统:9.2 | 城市河流:3.6 城市河湖系统:1.1 | 城市河流:10.4 城市河湖系统:2.1 | Wang et al., |
| 天津城市河流 | 城市河流 | 18.7-234 | 87.5 | 7.9±2.8 | 1.9±1.6 | 6.01±2.13 | Liu et al., |
| 中国东部巢湖 | 城市湖泊 | 11.7-5.96×10³ 平均:410 | 1.96×10⁴ | 6.37±3.2 | 3.31±3.78 | 7.68±4.26 | Miao et al., |
| 水体类型 | 采样点及时间 | pH | DO | tw | BOD5 | NH3-N | TN | CODMn | 叶绿素a | 风速 |
|---|---|---|---|---|---|---|---|---|---|---|
| 自然河流 | R1-秋-18:00 | - | 谷值 | 接近谷值 | - | 峰值 | - | 接近谷值 | - | - |
| R1-冬-18:00 | 接近峰值 | 接近峰值 | - | - | 峰值 | - | 峰值 | 接近谷值 | 峰值 | |
| R3-冬-18:00 | 峰值 | 峰值 | - | 谷值 | 谷值 | 峰值 | - | - | 峰值 | |
| 人工湖 | LC-秋-18:00 | 接近峰值 | - | 接近峰值 | - | 峰值 | 峰值 | 峰值 | 谷值 | - |
| 排污渠 | R2-夏-8:00 | 接近峰值 | 峰值 | 谷值 | - | - | - | 峰值 | 峰值 | 谷值 |
| R2-秋-23:00 | 谷值 | 接近谷值 | 谷值 | 峰值 | 谷值 | - | 谷值 | 接近谷值 | - | |
| R2-冬-18:00 | 峰值 | 接近峰值 | - | - | 谷值 | - | - | - | 峰值 | |
| R2-春-8:00 | 峰值 | 谷值 | - | 谷值 | 峰值 | 谷值 | 接近谷值 | 谷值 | 谷值 |
表6 研究区域溶存N2O浓度峰值和环境因子极值分析
Table 6 Analysis of peak dissolved N2O concentration and extreme values of environmental factors in the studied area
| 水体类型 | 采样点及时间 | pH | DO | tw | BOD5 | NH3-N | TN | CODMn | 叶绿素a | 风速 |
|---|---|---|---|---|---|---|---|---|---|---|
| 自然河流 | R1-秋-18:00 | - | 谷值 | 接近谷值 | - | 峰值 | - | 接近谷值 | - | - |
| R1-冬-18:00 | 接近峰值 | 接近峰值 | - | - | 峰值 | - | 峰值 | 接近谷值 | 峰值 | |
| R3-冬-18:00 | 峰值 | 峰值 | - | 谷值 | 谷值 | 峰值 | - | - | 峰值 | |
| 人工湖 | LC-秋-18:00 | 接近峰值 | - | 接近峰值 | - | 峰值 | 峰值 | 峰值 | 谷值 | - |
| 排污渠 | R2-夏-8:00 | 接近峰值 | 峰值 | 谷值 | - | - | - | 峰值 | 峰值 | 谷值 |
| R2-秋-23:00 | 谷值 | 接近谷值 | 谷值 | 峰值 | 谷值 | - | 谷值 | 接近谷值 | - | |
| R2-冬-18:00 | 峰值 | 接近峰值 | - | - | 谷值 | - | - | - | 峰值 | |
| R2-春-8:00 | 峰值 | 谷值 | - | 谷值 | 峰值 | 谷值 | 接近谷值 | 谷值 | 谷值 |
| [1] | BEAULIEU J J, SHUSTER W D, REBHOLZ J A, 2010. Nitrous oxide emissions from a large, impounded river: The Ohio river[J]. Environmental Science & Technology, 44(19): 7527-7533. |
| [2] | BEAULIEU J J, TANK J L, HAMILTON S K, 2011. Nitrous oxide emission from denitrification in stream and river networks[J]. Proceedings of the National Academy of Sciences, 108(1): 214-219. |
| [3] | COLE J J, CARACO N F, 1998. Atmospheric exchange of carbon dioxide in a low‐wind oligotrophic lake measured by the addition of SF6[J]. Limnology and Oceanography, 43(4): 647-656. |
| [4] | HAMPTON T B, ZARNETSKE J P, BRIGGS M A, et al., 2020. Experimental shifts of hydrologic residence time in a sandy urban stream sediment-water interface alter nitrate removal and nitrous oxide fluxes[J]. Biogeochemistry, 149: 195-219. |
| [5] | HE Y X, WANG X F, CHEN H, et al., 2017. Effect of watershed urbanization on N2O emissions from the Chongqing metropolitan river network, China[J]. Atmospheric Environment, 171: 70-81. |
| [6] | HERREID A M, WYMORE A S, VARNER R K, et al., 2021. Divergent controls on stream greenhouse gas concentrations across a land-use gradient[J]. Ecosystems, 24(6): 1299-1316. |
| [7] | HO L, JERVES-COBO R, BARTHEL M, et al., 2020. Effects of land use and water quality on greenhouse gas emissions from an urban river system[J]. Biogeosciences Discussions, 2020: 1-22. |
| [8] | HOUGHTON J T, DING Y, GRIGGS D J, et al., 2001. Climate change 2001: The scientific basis[M]. Cambridge, United Kingdom: Cambridge University Press: 1-881. |
| [9] | HU B B, WANG D Q, ZHOU J, et al., 2018. Greenhouse gases emission from the sewage draining rivers[J]. Science of Total Environment, 612: 1454-1462. |
| [10] |
KORTELAINEN P, LARMOLA T, RANTAKARI M, et al., 2020. Lakes as nitrous oxide sources in the boreal landscape[J]. Global Change Biology, 26(3): 1432-1445.
DOI PMID |
| [11] | LIANG X, WANG B, GAO D, et al., 2022. Nitrification regulates the spatiotemporal variability of N2O emissions in a eutrophic lake[J]. Environmental Science & Technology, 56(23): 17430-17442. |
| [12] | LIU X L, BAI L, WANG Z L, et al., 2015. Nitrous oxide emissions from river network with variable nitrogen loading in Tianjin, China[J]. Journal of Geochemical Exploration, 157: 153-161. |
| [13] |
MAAVARA T, LAUERWALD R, LARUELLE G G, et al., 2019. Nitrous oxide emissions from inland waters: Are IPCC estimates too high?[J]. Global Change Biology, 25(2): 473-488.
DOI PMID |
| [14] | MIAO Y Q, HUANG J, DUAN H T, et al., 2020. Spatial and seasonal variability of nitrous oxide in a large freshwater lake in the lower reaches of the Yangtze River, China[J]. Science of the Total Environment, 721: 137716. |
| [15] | OGILVIE B, NEDWELL D B, HARRISON R M, et al., 1997. High nitrate, muddy estuaries as nitrogen sinks: the nitrogen budget of the River Colne estuary (United Kingdom)[J]. Marine Ecology Progress Series, 150(1-3): 217-228. |
| [16] | QUICK A M, REEDER W J, FARRELL T B, et al., 2019. Nitrous oxide from streams and rivers: A review of primary biogeochemical pathways and environmental variables[J]. Earth-science Reviews, 191: 224-262. |
| [17] |
RAVISHANKARA A R, DANIEL J S, PORTMANN R W, 2009. Nitrous oxide (N2O): The dominant ozone-depleting substance emitted in the 21st century[J]. Science, 326: 123-125.
DOI PMID |
| [18] | SMITH R L, BÖHLKE J K, 2019. Methane and nitrous oxide temporal and spatial variability in two midwestern USA streams containing high nitrate concentrations[J]. Science of the Total Environment, 685: 574-588. |
| [19] | TIAN H Q, XU R T, CANADELL J G, et al., 2020. A comprehensive quantification of global nitrous oxide sources and sinks[J]. Nature, 586: 248-256. |
| [20] | WANG C L, XV Y H, WU Z F, et al., 2024. Denitrification regulates spatiotemporal pattern of N2O emission in an interconnected urban river-lake network[J]. Water Research, 251: 121144. |
| [21] | WANG G Q, XIA X H, LIU S D, et al., 2021. Distinctive patterns and controls of nitrous oxide concentrations and fluxes from urban inland waters[J]. Environmental Science & Technology, 55(12): 8422-8431. |
| [22] | WANG R, ZHANG H, ZHANG W, et al., 2020. An urban polluted river as a significant hotspot for water-atmosphere exchange of CH4 and N2O[J]. Environmental Pollution, 264: 114770. |
| [23] | WANG X F, YU L L, LIU T T, et al., 2022. Methane and nitrous oxide concentrations and fluxes from heavily polluted urban streams: Comprehensive influence of pollution and restoration[J]. Environmental Pollution, 313: 120098. |
| [24] | WANNINKHOF R, 1992. Relationship between wind speed and gas exchange over the ocean[J]. Journal of Geophysical Research: Oceans, 97(C5): 7373-7382. |
| [25] | WUEBBLES D J, 2009. Nitrous oxide: No laughing matter[J]. Science, 326(5949): 56-57. |
| [26] | XIAO Q T, XU X F, ZHANG M, et al., 2019. Coregulation of nitrous oxide emissions by nitrogen and temperature in China’s third largest freshwater lake (Lake Taihu)[J]. Limnology and Oceanography, 64(3): 1070-1086. |
| [27] | YANG F Y, ZHENG X L, WANG D Q, et al., 2024a. Significant diurnal variations in nitrous oxide (N2O) emissions from two contrasting habitats in a large eutrophic lake (Lake Taihu, China)[J]. Environmental Research, 261: 119691. |
| [28] | YANG P, LIN Y X, YANG H, et al., 2024b. Spatiotemporal distributions of dissolved N2O concentration, diffusive N2O flux and relevant functional genes along a coastal creek in southeastern China[J]. Journal of Hydrology, 637: 131331. |
| [29] |
YU Z J, DENG H G, WANG D Q, et al., 2013. Nitrous oxide emissions in the Shanghai river network: Implications for the effects of urban sewage and IPCC methodology[J]. Global Change Biology, 19(10): 2999-3010.
DOI PMID |
| [30] | ZHANG G L, ZHANG J, LIU S M, et al., 2010. Nitrous oxide in the Changjiang (Yangtze River) Estuary and its adjacent marine area: Riverine input sediment release and atmospheric fluxes[J]. Biogeosciences, 7(11): 3505-3516. |
| [31] | ZHANG W S, LI H P, XIAO Q T, et al., 2020a. Surface nitrous oxide (N2O) concentrations and fluxes from different rivers draining contrasting landscapes: Spatio-temporal variability, controls, and implications based on IPCC emission factor[J]. Environmental Pollution, 263(Part A): 114457. |
| [32] | ZHANG W S, LI H P, XIAO Q T, et al., 2020b. Urban rivers are hotspots of riverine greenhouse gas (N2O, CH4, CO2) emissions in the mixed-landscape Chaohu Lake Basin[J]. Water Research, 189: 116624. |
| [33] | 陈姝, 2022. 不同时间尺度城市河流水体温室气体排放特征[D]. 上海: 华东师范大学: 1-238. |
| CHEN S, 2022. Characteristics of greenhouse gases emission from urban rivers at different time scales[D]. Shanghai: East China Normal University: 1-238. | |
| [34] | 池善庆, 林财强, 吴礼贵, 等, 2024. 城市人工湖营养盐与抗生素的时空分布特征及生态风险评价[J]. 环境工程, 42(1): 29-36. |
| CHI S Q, LIN C Q, WU L G, et al., 2024. Temporal and spatial distribution characteristics and ecological risk assessment of nutrients and antibiotics in urban artificial lakes[J]. Environmental Engineering, 42(1): 29-36. | |
| [35] | 金宝石, 2018. 福建主要河口湿地围垦养虾塘氧化亚氮产生、溶存与释放[D]. 福建: 福建师范大学: 1-200. |
| JIN B S, 2018. Production, dissolution and emissions of nitrous oxide from reclaimed shrimp ponds in the two main estuaries, Fujian[D]. Fujian: Fujian Normal University: 1-200. | |
| [36] | 李玲玲, 闫人华, 2024. 滨湖城市河网N2O溶存浓度、空间分布及对生态修复的响应[J]. 湖泊科学, 36(5): 1412-1424. |
| LI L L, YAN R H, 2024. Concentration, spatial distribution, and response to ecological restoration of N2O in urban river networks of lakeside city[J]. Journal of Lake Sciences, 36(5): 1412-1424. | |
| [37] | 李轩, 苑心, 门聪, 等, 2024. 城市河流CH4和N2O产生及排放研究进展[J]. 环境科学, 45(8): 4932-4945. |
| LI X, YUAN X, MEN C, et al., 2024. Research progress on production and emission of CH4 and N2O from urban rivers[J]. Environmental Science, 45(8): 4932-4945. | |
| [38] | 李肖正, 岳甫均, 周滨, 等, 2022. 渤海湾典型闸控入海河流水体N2O释放研究[J]. 中国环境科学, 42(1): 356-366. |
| LI X Z, YUE F J, ZHOU B, et al., 2022. Spatial and temporal variations and influencing factors of nitrous oxide emissions from surface water in Min River Estuary[J]. China Environmental Science, 42(1): 356-366. | |
| [39] | 刘朝荣, 朱俊羽, 李宇阳, 等, 2022. 太湖氧化亚氮 (N2O) 排放特征及潜在驱动因素[J]. 环境科学, 43(8): 4118-4126. |
| LIU C R, ZHU J Y, LI Y Y, et al., 2022. Emissiom of nitrous oxide (N2O) from LakeTaihu and corresponding potential driving factors[J]. Environmental Science, 43(8): 4118-4126. | |
| [40] | 漆梦婷, 罗柳, 洪晓静, 等, 2022. 闽江河口表层水体氧化亚氮释放时空变化特征及其影响因素[J]. 环境科学学报, 42(7): 489-500. |
| QI M T, LUO L, HONG X J, et al., 2022. Spatial and temporal variations and influencing factors of nitrous oxide emissions from surface water in Min River Estuary[J]. Acta Scientiae Circumstantiae, 42(7): 489-500. | |
| [41] | 王红岩, 周旭东, 孙国新, 等, 2022. 城市化地区典型水体的N2O排放通量特征——以南京市为例[J]. 生态学报, 42(23): 9577-9589. |
| WANG H Y, ZHOU X D, SUN G X, et al., 2022. N2O emission in typical urban waterbodies: Example of Nanjing[J]. Acta Ecologica Sinica, 42(23): 9577-9589. | |
| [42] | 中华人民共和国生态环境部, 国家市场监督管理总局, 2002. 地表水环境质量标准: GB 3838—2002[S]. 北京: 中国标准出版社: 1-12. |
| Ministry of Ecology and Environment of the People’s Republic of China, State Administration for Market Regulation, 2002. Environmental Quality Standards for Surface Water: GB 3838—2002[S]. Beijing: China Standards Press: 1-12. |
| [1] | 吴锡言, 李维军, 卡那特, 彭玉杰. 基于随机森林和OCO-2遥感数据分析2023年中国连续时空xCO2变化特征[J]. 生态环境学报, 2025, 34(9): 1341-1350. |
| [2] | 张晟博, 吴作航, 党皓飞, 廖廓, 陆灯盛, 李登秋. 近20年武夷山地区不同遥感指标对极端气候事件的响应及差异[J]. 生态环境学报, 2025, 34(8): 1240-1254. |
| [3] | 丁馨, 刘健, 魏俐宏, 解德威, 郑昭佩. 基于GSMSR模型的山东省植被NEP时空格局及影响因素[J]. 生态环境学报, 2025, 34(7): 1079-1089. |
| [4] | 郭欣达, 付奔, 余思洁, 侯鹰, 陈卫平. 城市内涝和夏季高温风险评价与优先管控区识别方法研究[J]. 生态环境学报, 2025, 34(5): 731-742. |
| [5] | 蒋存征, 陈安强, 胡万里, 付斌, 朱林立, 刘云娥, 黎明琦, 王炽, 张丹. 异龙湖区浅层地下水NO3−-N浓度时空变化及其来源解析[J]. 生态环境学报, 2025, 34(4): 570-580. |
| [6] | 郭铭彬, 龚建周, 王丽娟, 王时宽. 2019-2023年粤港澳大湾区NO2浓度变化的自然主控因子解析[J]. 生态环境学报, 2025, 34(4): 534-547. |
| [7] | 陈鹏, 马育军, 张梦雅, 陈婉婷, 江晓鹏. 基于kNDVI的广东省植被动态变化分析[J]. 生态环境学报, 2025, 34(4): 499-510. |
| [8] | 郭昭, 师芸, 刘铁铭, 张雨欣, 闫永智. 2001-2020年秦岭北麓NPP时空格局及驱动因素分析[J]. 生态环境学报, 2025, 34(3): 401-410. |
| [9] | 赵乐鋆, 王诗瑶, 赵子渝, 洪星, 李夫星, 吴佳仪, 华婧妤. 2008-2022年华北平原七省市AOD时空变化特征及主要影响因素分析[J]. 生态环境学报, 2025, 34(2): 256-267. |
| [10] | 侯金龙, 马志强, 杨澄, 葛双双, 何迪, 董璠. 京津冀地区植被碳源/汇的时空变化特征及影响因素分析[J]. 生态环境学报, 2024, 33(9): 1329-1338. |
| [11] | 王捷纯, 邓玉娇, 朱怀卫, 孔蕴淇. 广东省不同生态系统植被NPP时空变化及对气候因子的响应[J]. 生态环境学报, 2024, 33(6): 831-840. |
| [12] | 陈晓辉, 胡喜生. 耦合ER和GWR的福州市生态环境质量的驱动力分析[J]. 生态环境学报, 2024, 33(5): 812-823. |
| [13] | 张淼, 王桂霞, 王昌伟, 贺艳云, 许艳芳, 李琪, 许杨, 张俊骁, 张桂芹. 济南市区黑碳污染变化特征及来源解析[J]. 生态环境学报, 2024, 33(4): 560-572. |
| [14] | 杨非凡, 何浩. 基于“EVI-ESV”伊犁河谷生态环境评估及生态分区构建[J]. 生态环境学报, 2024, 33(4): 655-664. |
| [15] | 李霞, 陈永昊, 陈喆, 张国壮, 唐梦雅. 中国沿海地区植被NDVI时空变化及驱动力分析[J]. 生态环境学报, 2024, 33(2): 180-191. |
| 阅读次数 | ||||||
|
全文 |
|
|||||
|
摘要 |
|
|||||