生态环境学报 ›› 2025, Vol. 34 ›› Issue (9): 1341-1350.DOI: 10.16258/j.cnki.1674-5906.2025.09.002
吴锡言1( ), 李维军1,2,*(), 卡那特1,2, 彭玉杰1
收稿日期:2024-11-15
出版日期:2025-09-18
发布日期:2025-09-05
通讯作者:
*E-mail: lishz0993@163.com
作者简介:吴锡言(2002年生),女,硕士研究生,研究方向为污染物防治与控制。E-mail: 1508485570@qq.com
基金资助:
WU Xiyan1(), LI Weijun1,2,*(), KA Nate1,2, PENG Yujie1
Received:2024-11-15
Online:2025-09-18
Published:2025-09-05
摘要:
为准确把握协同减污降碳和区域碳达峰的战略布局,基于随机森林(RF)模型和轨道碳观测卫星-2(OCO-2)遥感数据,构建2023年中国陆地月尺度时空连续性大气二氧化碳柱平均摩尔分数(xCO2),空间分辨率为0.1°×0.1°的数据集。使用香河站点的xCO2数据验证OCO-2观测数据,结果表明两者相关性高,决定系数(R2)为0.902,均方误差(σMSE)为1.45×10⁻⁶。选取以自然环境、人为活动、气象条件等影响因素为辅助变量,结合遥感数据训练模型,真实值与预测值之间的R2超过0.82,σMSE小于0.48×10⁻⁶,绝对误差(E)小于0.02×10⁻⁶,结果表明模型预测的数据具有极高的可信度。还分析了中国大气CO2浓度的时空变化分布特征,在时间上,大气CO2浓度4月达到峰值,8月则降至最低,呈现出明显的季节性变化;在空间上,xCO2总体呈现“西低东高,北低南高”的空间分布格局,纬度越高,季节性变化越大,不同温度带也表现出xCO2分布的差异性。该研究对准确估算中国区域大气的xCO2,以及理解陆地生态系统碳循环的过程至关重要,为城市碳排放工作的精细化监测提供参考,还为区域层面推进“碳达峰、碳中和”战略的实施提供了有力的地理空间信息支撑。
中图分类号:
吴锡言, 李维军, 卡那特, 彭玉杰. 基于随机森林和OCO-2遥感数据分析2023年中国连续时空xCO2变化特征[J]. 生态环境学报, 2025, 34(9): 1341-1350.
WU Xiyan, LI Weijun, KA Nate, PENG Yujie. Analysis of China’s Continuous Temporal xCO2 Change in 2023 Based on Random Forest and OCO-2 Remote Sensing Data[J]. Ecology and Environmental Sciences, 2025, 34(9): 1341-1350.
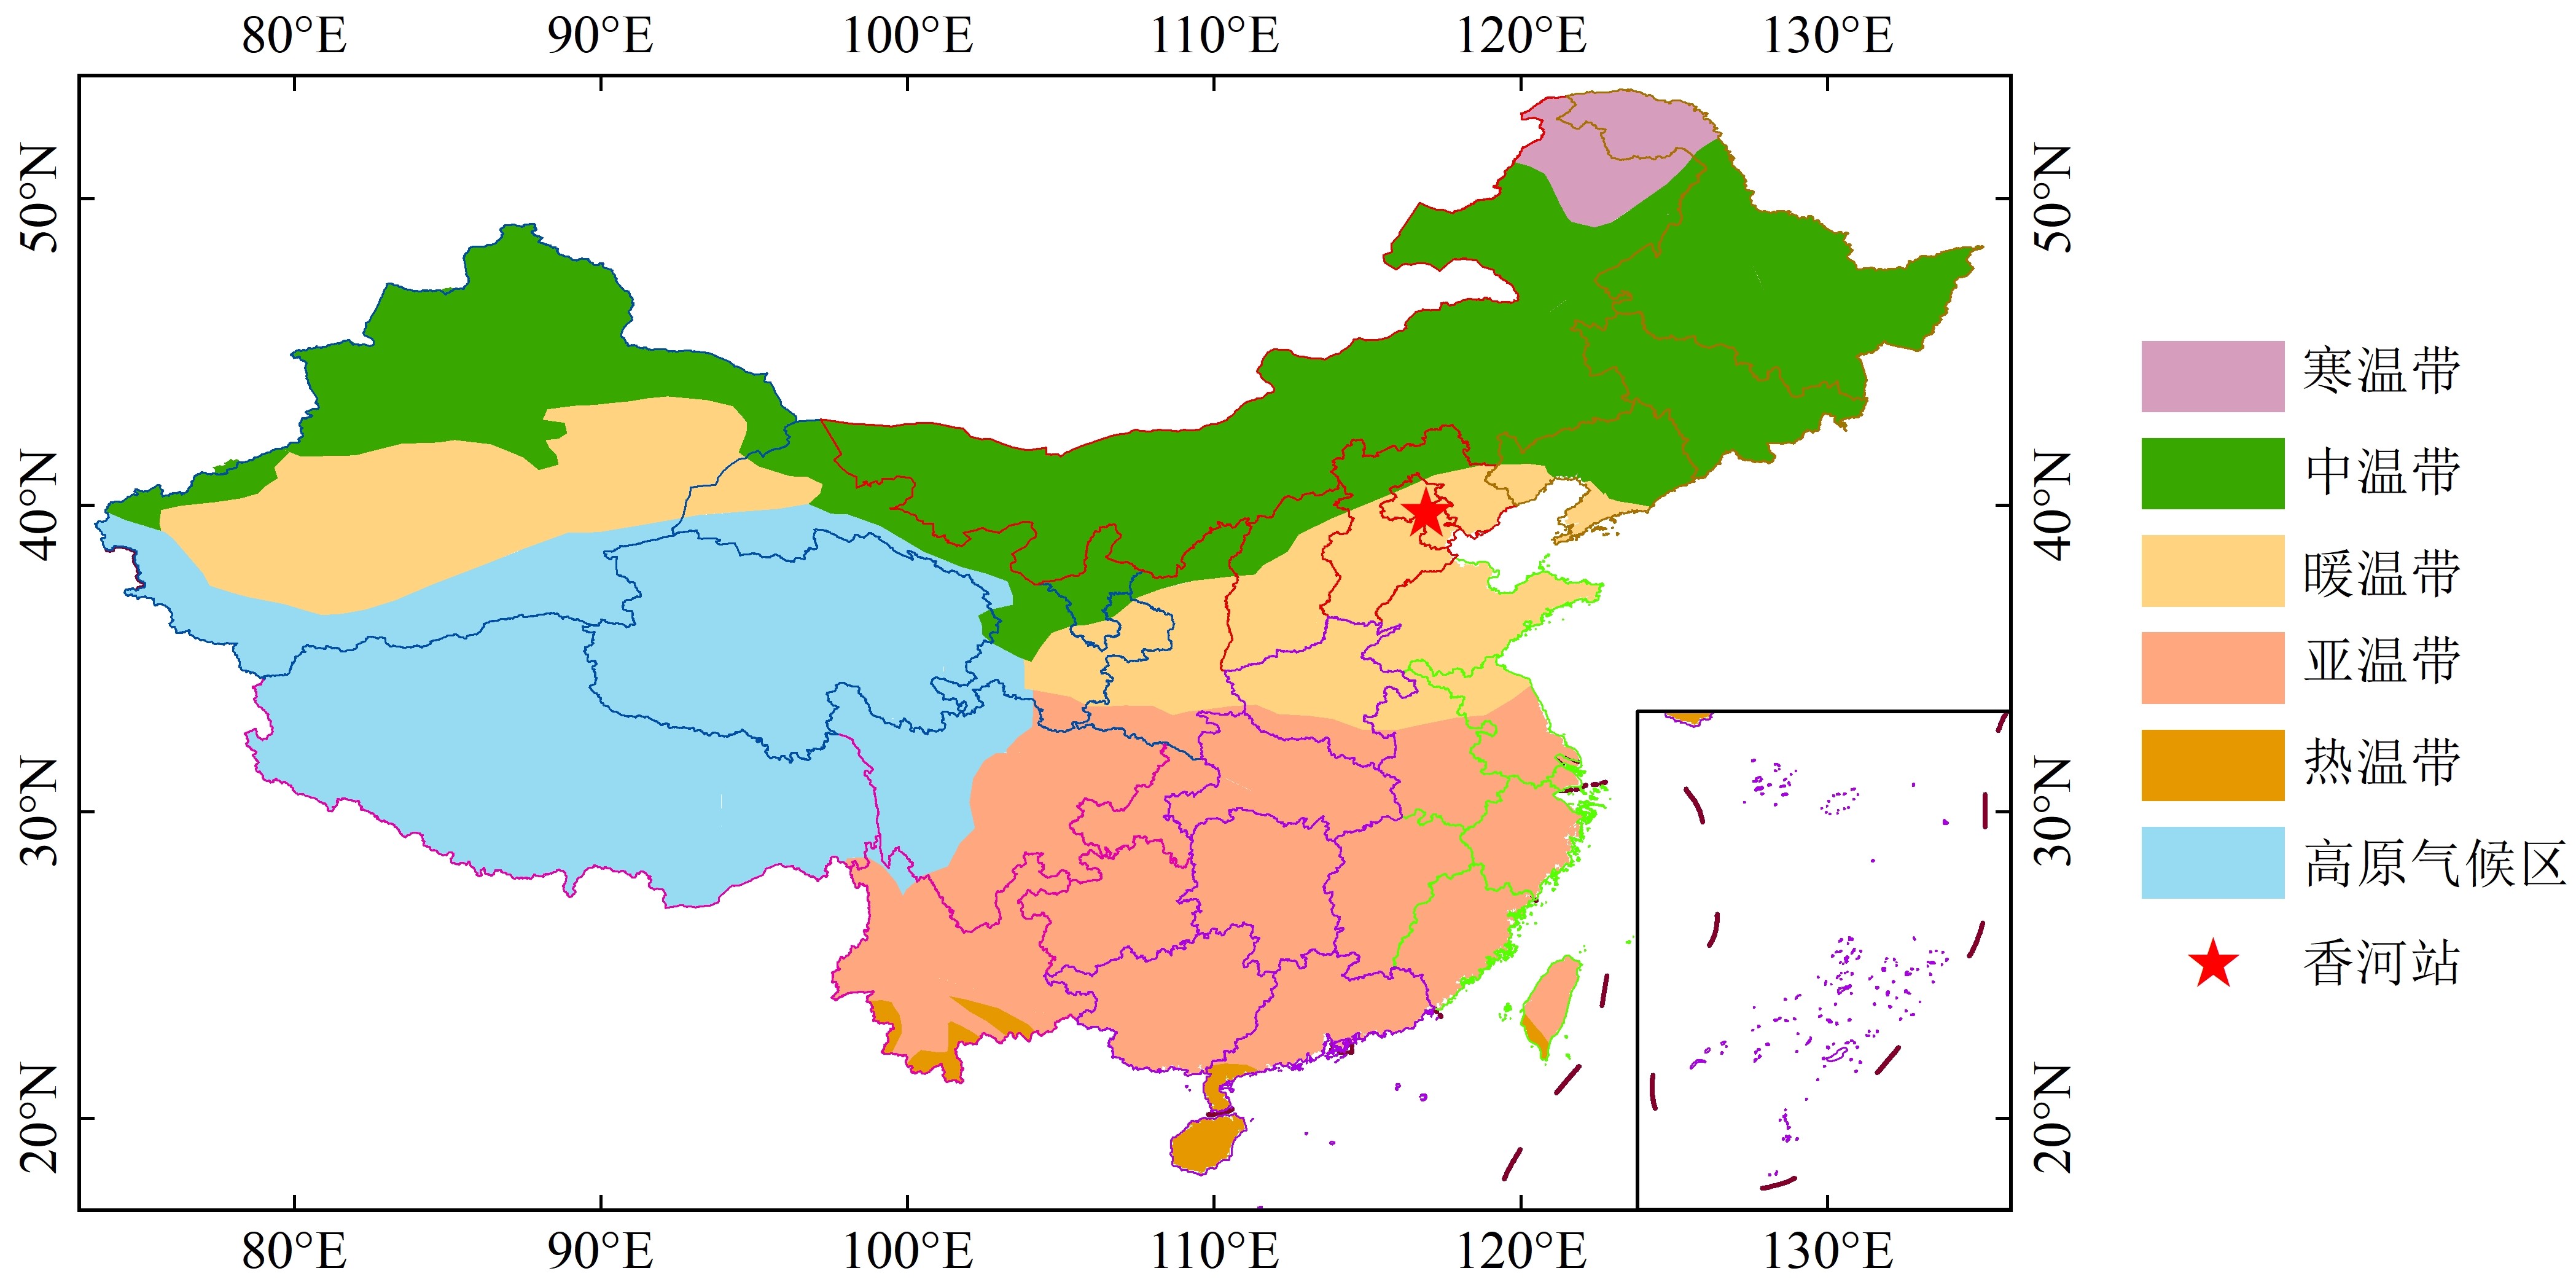
图1 研究区域概况 本文底图基于国家地理信息公共服务平台下载的审图号为GS(2024)0650号的标准地图制作,底图无修改
Figure 1 Overview of the studied area
| 数据名称 | 数据来源 | 时间分辨率 | 空间分 辨率 | 单位 | 数据 时间 |
|---|---|---|---|---|---|
| xCO2 | OCO-2 | 16 d | 1.29 km× 2.25 km | ×10−6 | 2022-2023 |
| TCCON | - | - | 2022 | ||
| u10 | ERA5-land | 月 | 0.1°×0.1° | m∙s−1 | 2023 |
| v10 | m∙s−1 | ||||
| t | K | ||||
| Pt | m | ||||
| INDVI | MODIS/MOD13A3 | 月 | 1 km×1 km | - | 2023 |
| PLULC | 中国科学院资源环境科学与数据中心 | a | 1 km | - | 2020 |
| HDEM | 250 m | m | |||
| INL | VIIRS Nighttime Light | 月 | 15ʺ | nW∙cm−2∙sr−1 | 2023 |
表1 数据信息
Table 1 Data information
| 数据名称 | 数据来源 | 时间分辨率 | 空间分 辨率 | 单位 | 数据 时间 |
|---|---|---|---|---|---|
| xCO2 | OCO-2 | 16 d | 1.29 km× 2.25 km | ×10−6 | 2022-2023 |
| TCCON | - | - | 2022 | ||
| u10 | ERA5-land | 月 | 0.1°×0.1° | m∙s−1 | 2023 |
| v10 | m∙s−1 | ||||
| t | K | ||||
| Pt | m | ||||
| INDVI | MODIS/MOD13A3 | 月 | 1 km×1 km | - | 2023 |
| PLULC | 中国科学院资源环境科学与数据中心 | a | 1 km | - | 2020 |
| HDEM | 250 m | m | |||
| INL | VIIRS Nighttime Light | 月 | 15ʺ | nW∙cm−2∙sr−1 | 2023 |
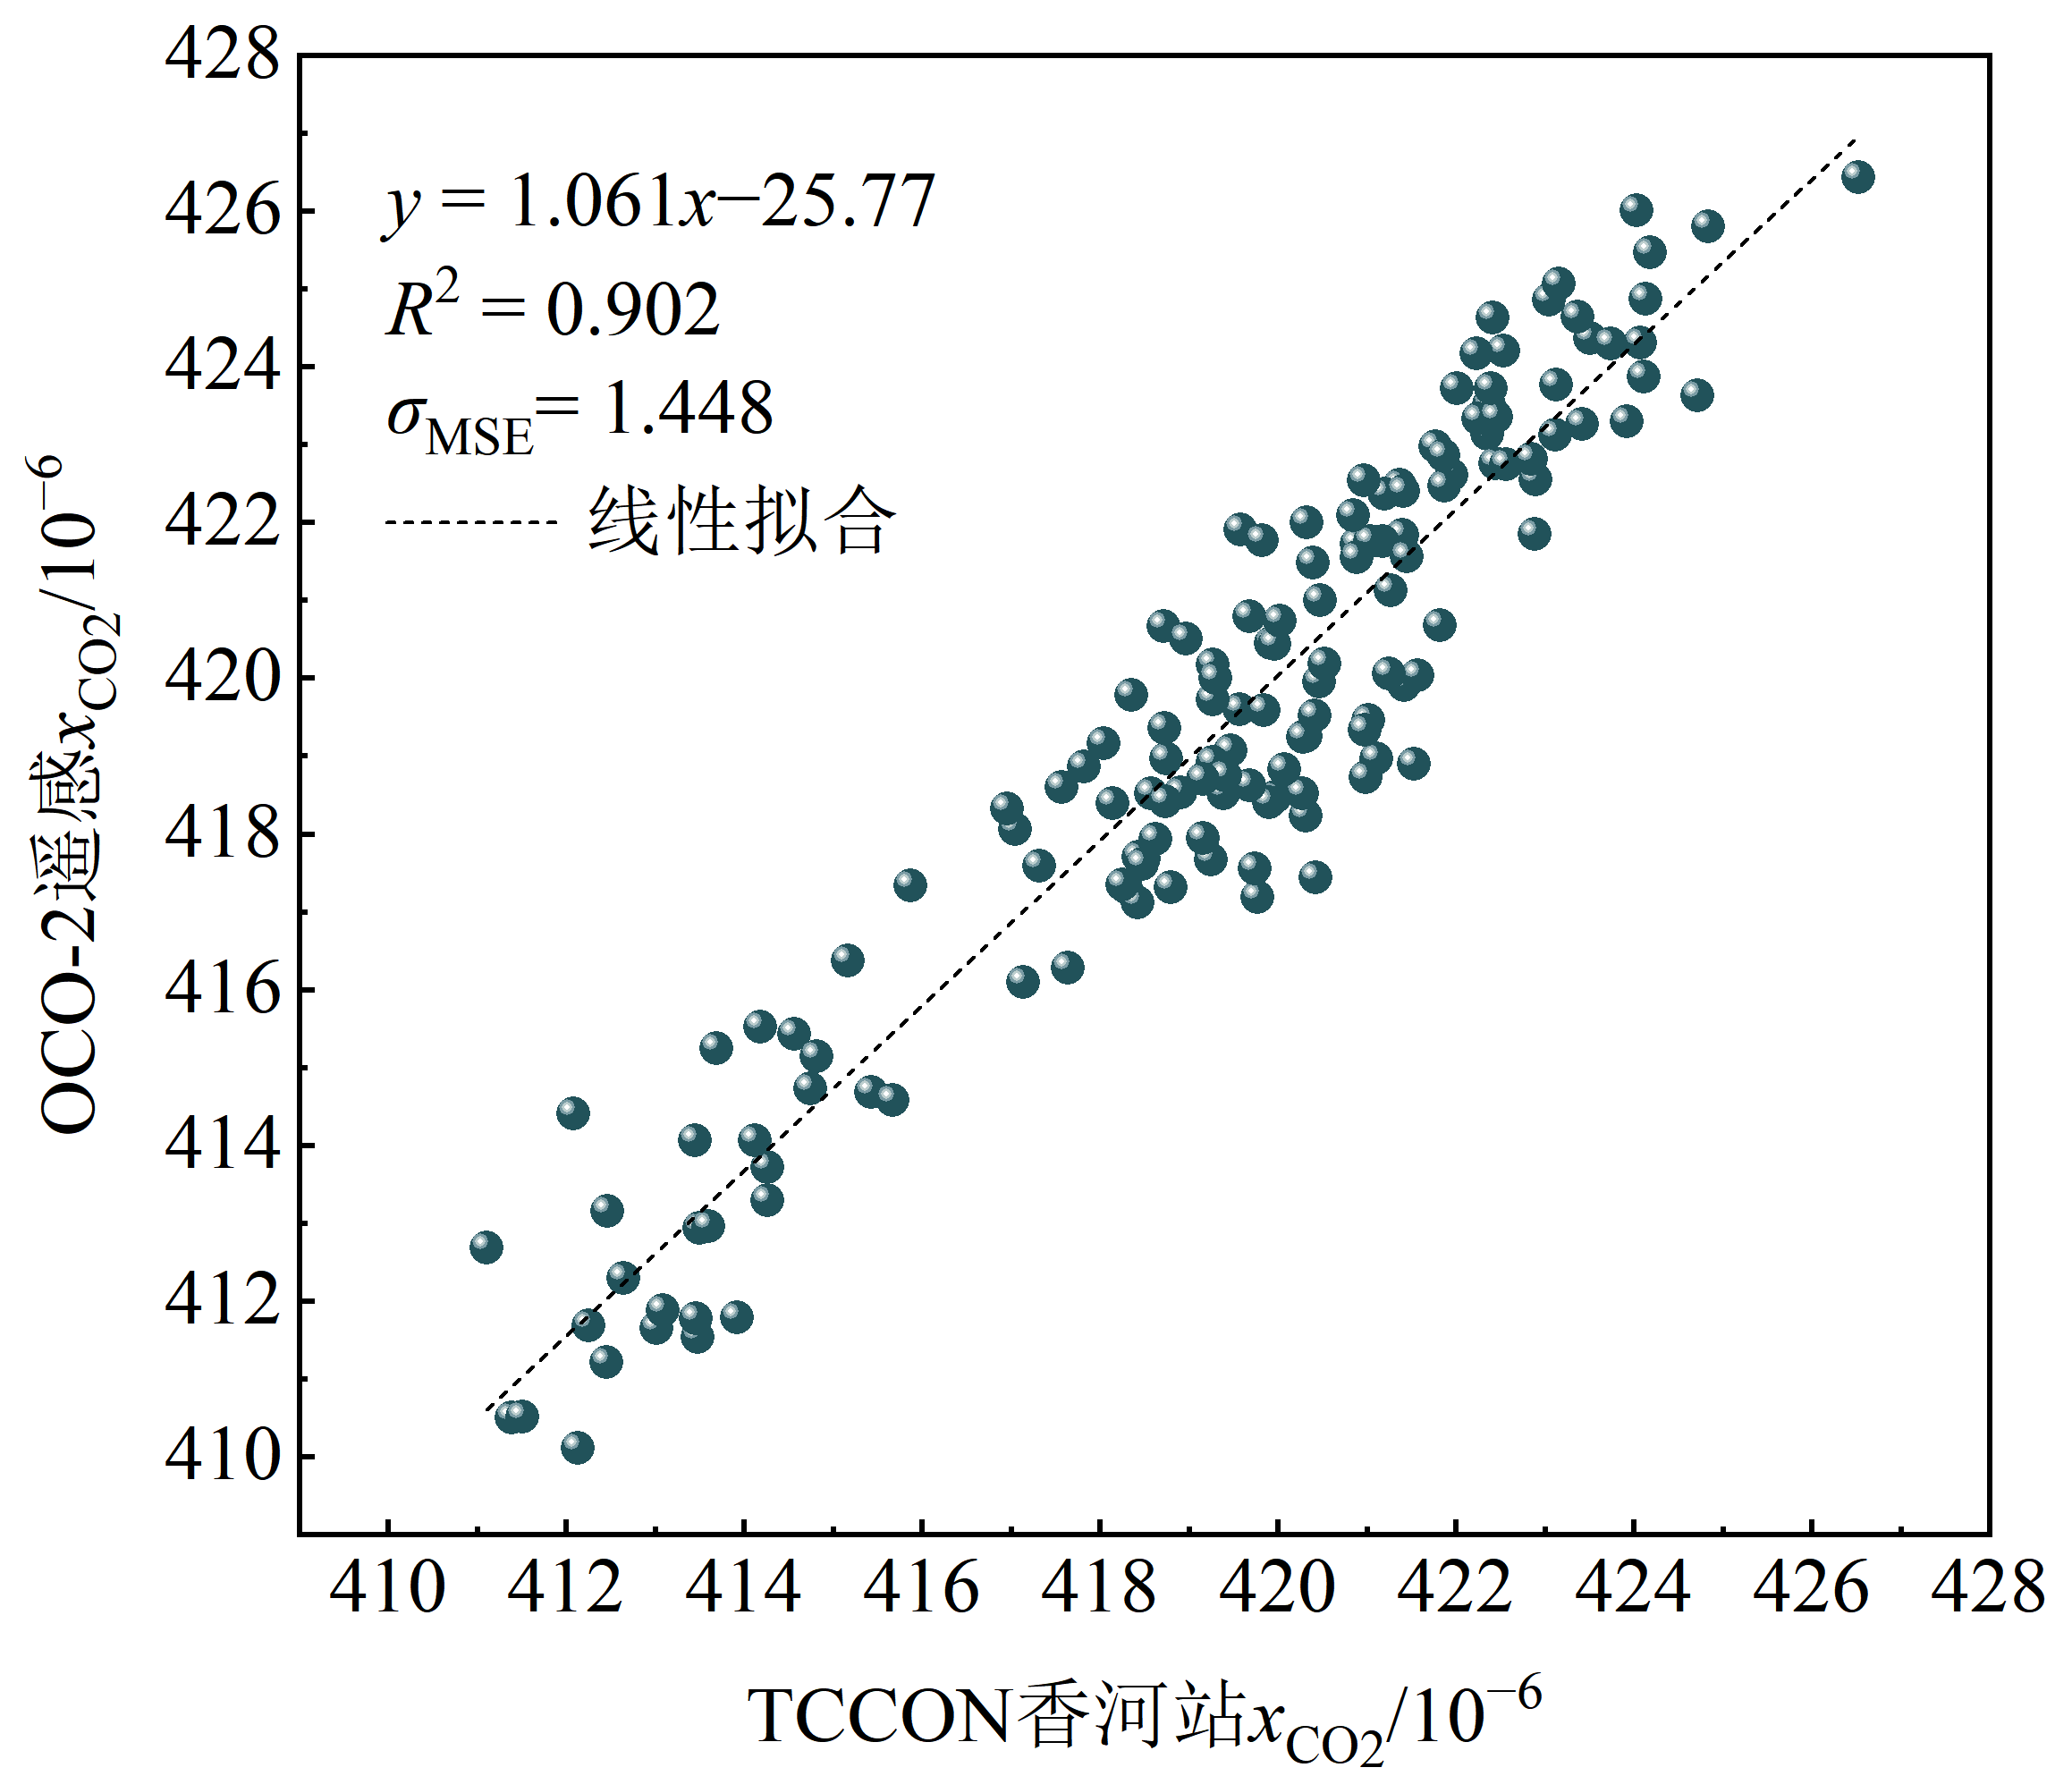
图2 2022年OCO-2 xCO2遥感数据与TCCON香河站xCO2观测数据相关性分析
Figure 2 Correlation analysis between OCO-2 xCO2 remote sensing data and TCCON Xianghe station xCO2 observation data

图3 2023年中国OCO-2 xCO2原始数据空间分布
Figure 3 Spatial distribution of raw data of OCO-2 xCO2 in China in 2023
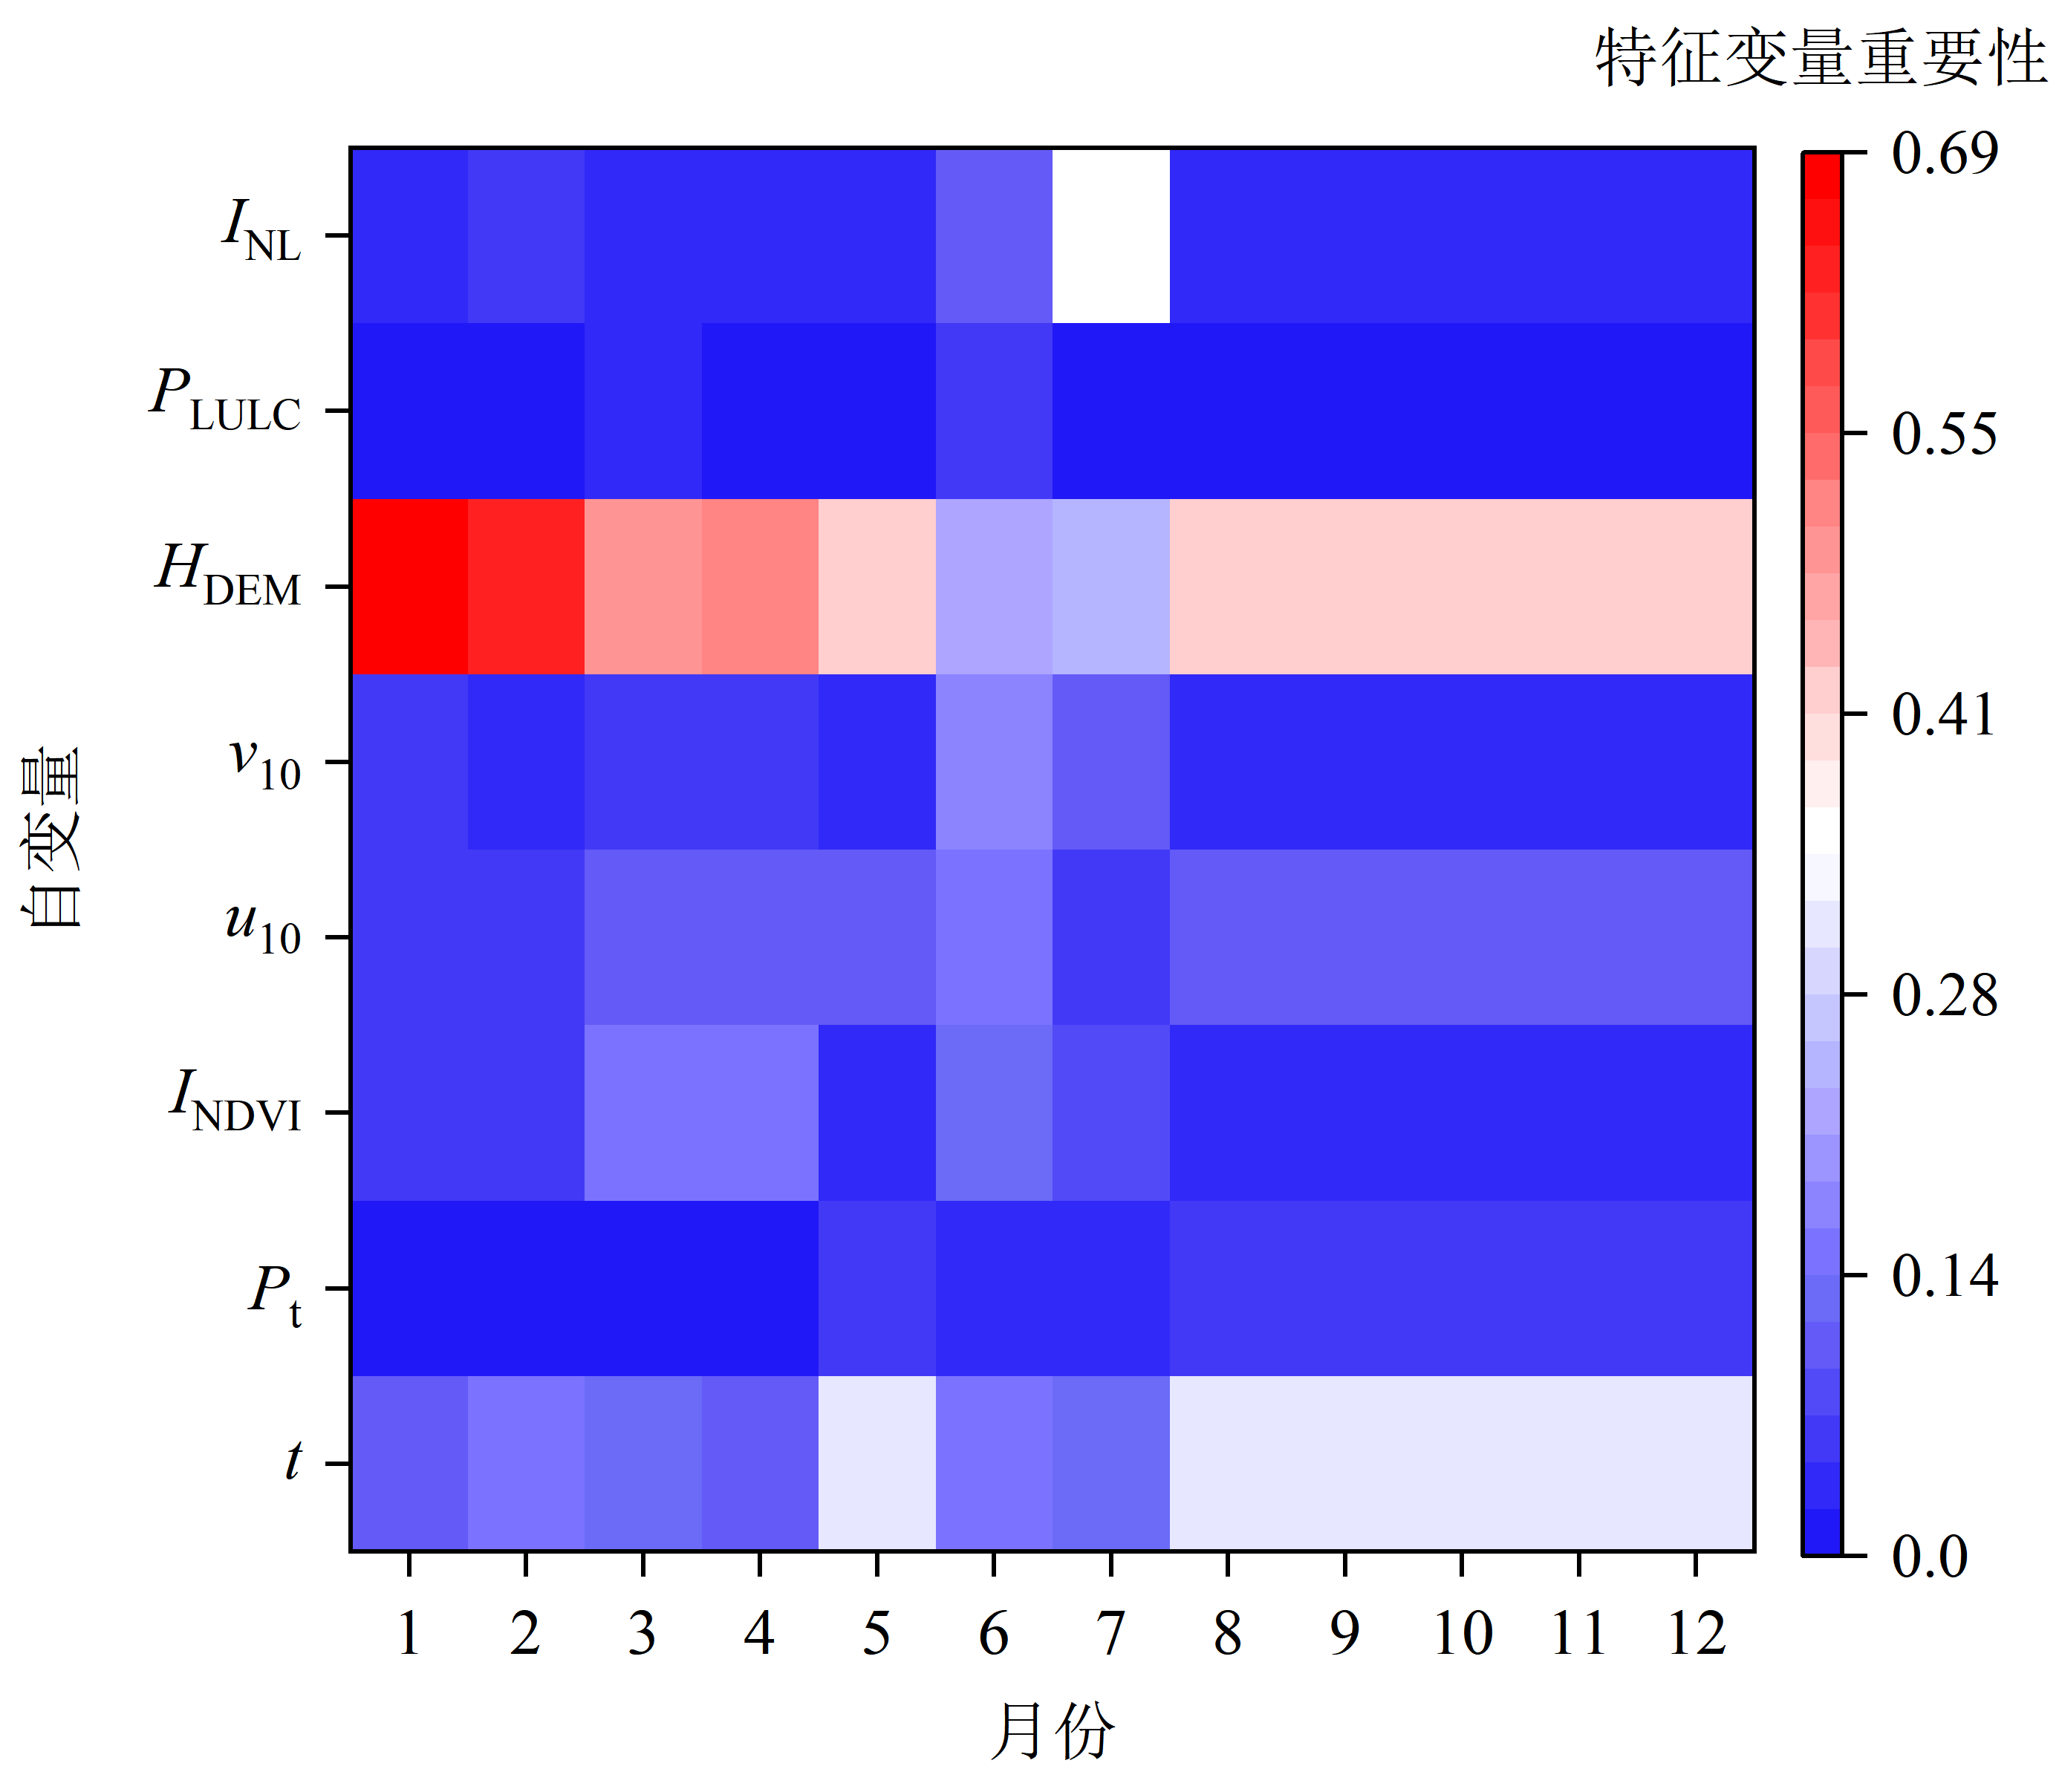
图4 各个变量在模型预测中的重要性
Figure 4 Importance of each independent variable in model prediction
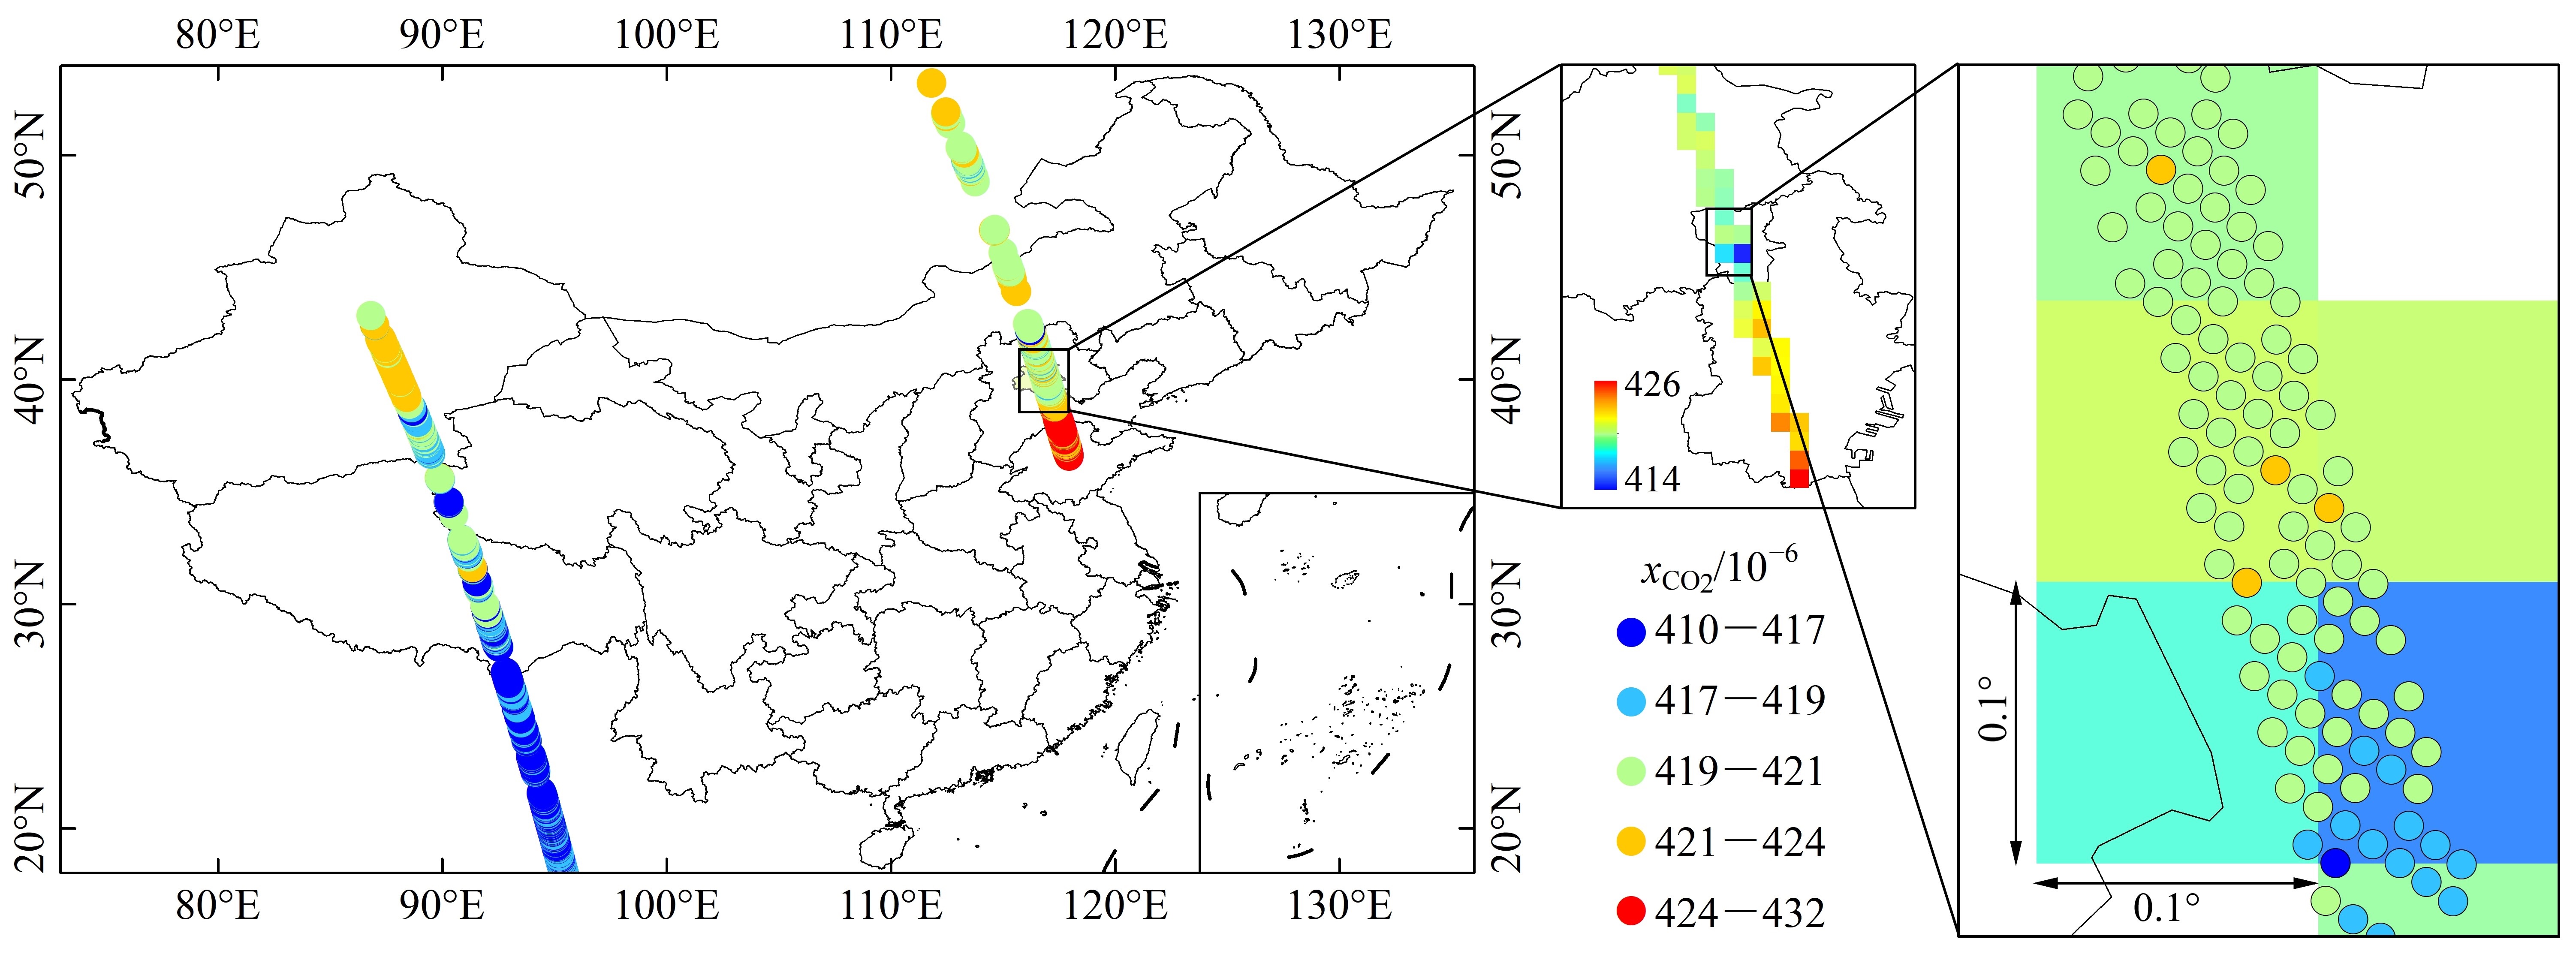
图5 2023年1月1日OCO-2观测数据xCO2分布情况
Figure 5 xCO2 distribution of OCO-2 observations on January 1, 2023

图6 RF模型预测值与OCO-2遥感观测站真实值结果比较
Figure 6 Comparison of RF model predictions with OCO-2 remote sensing observation results
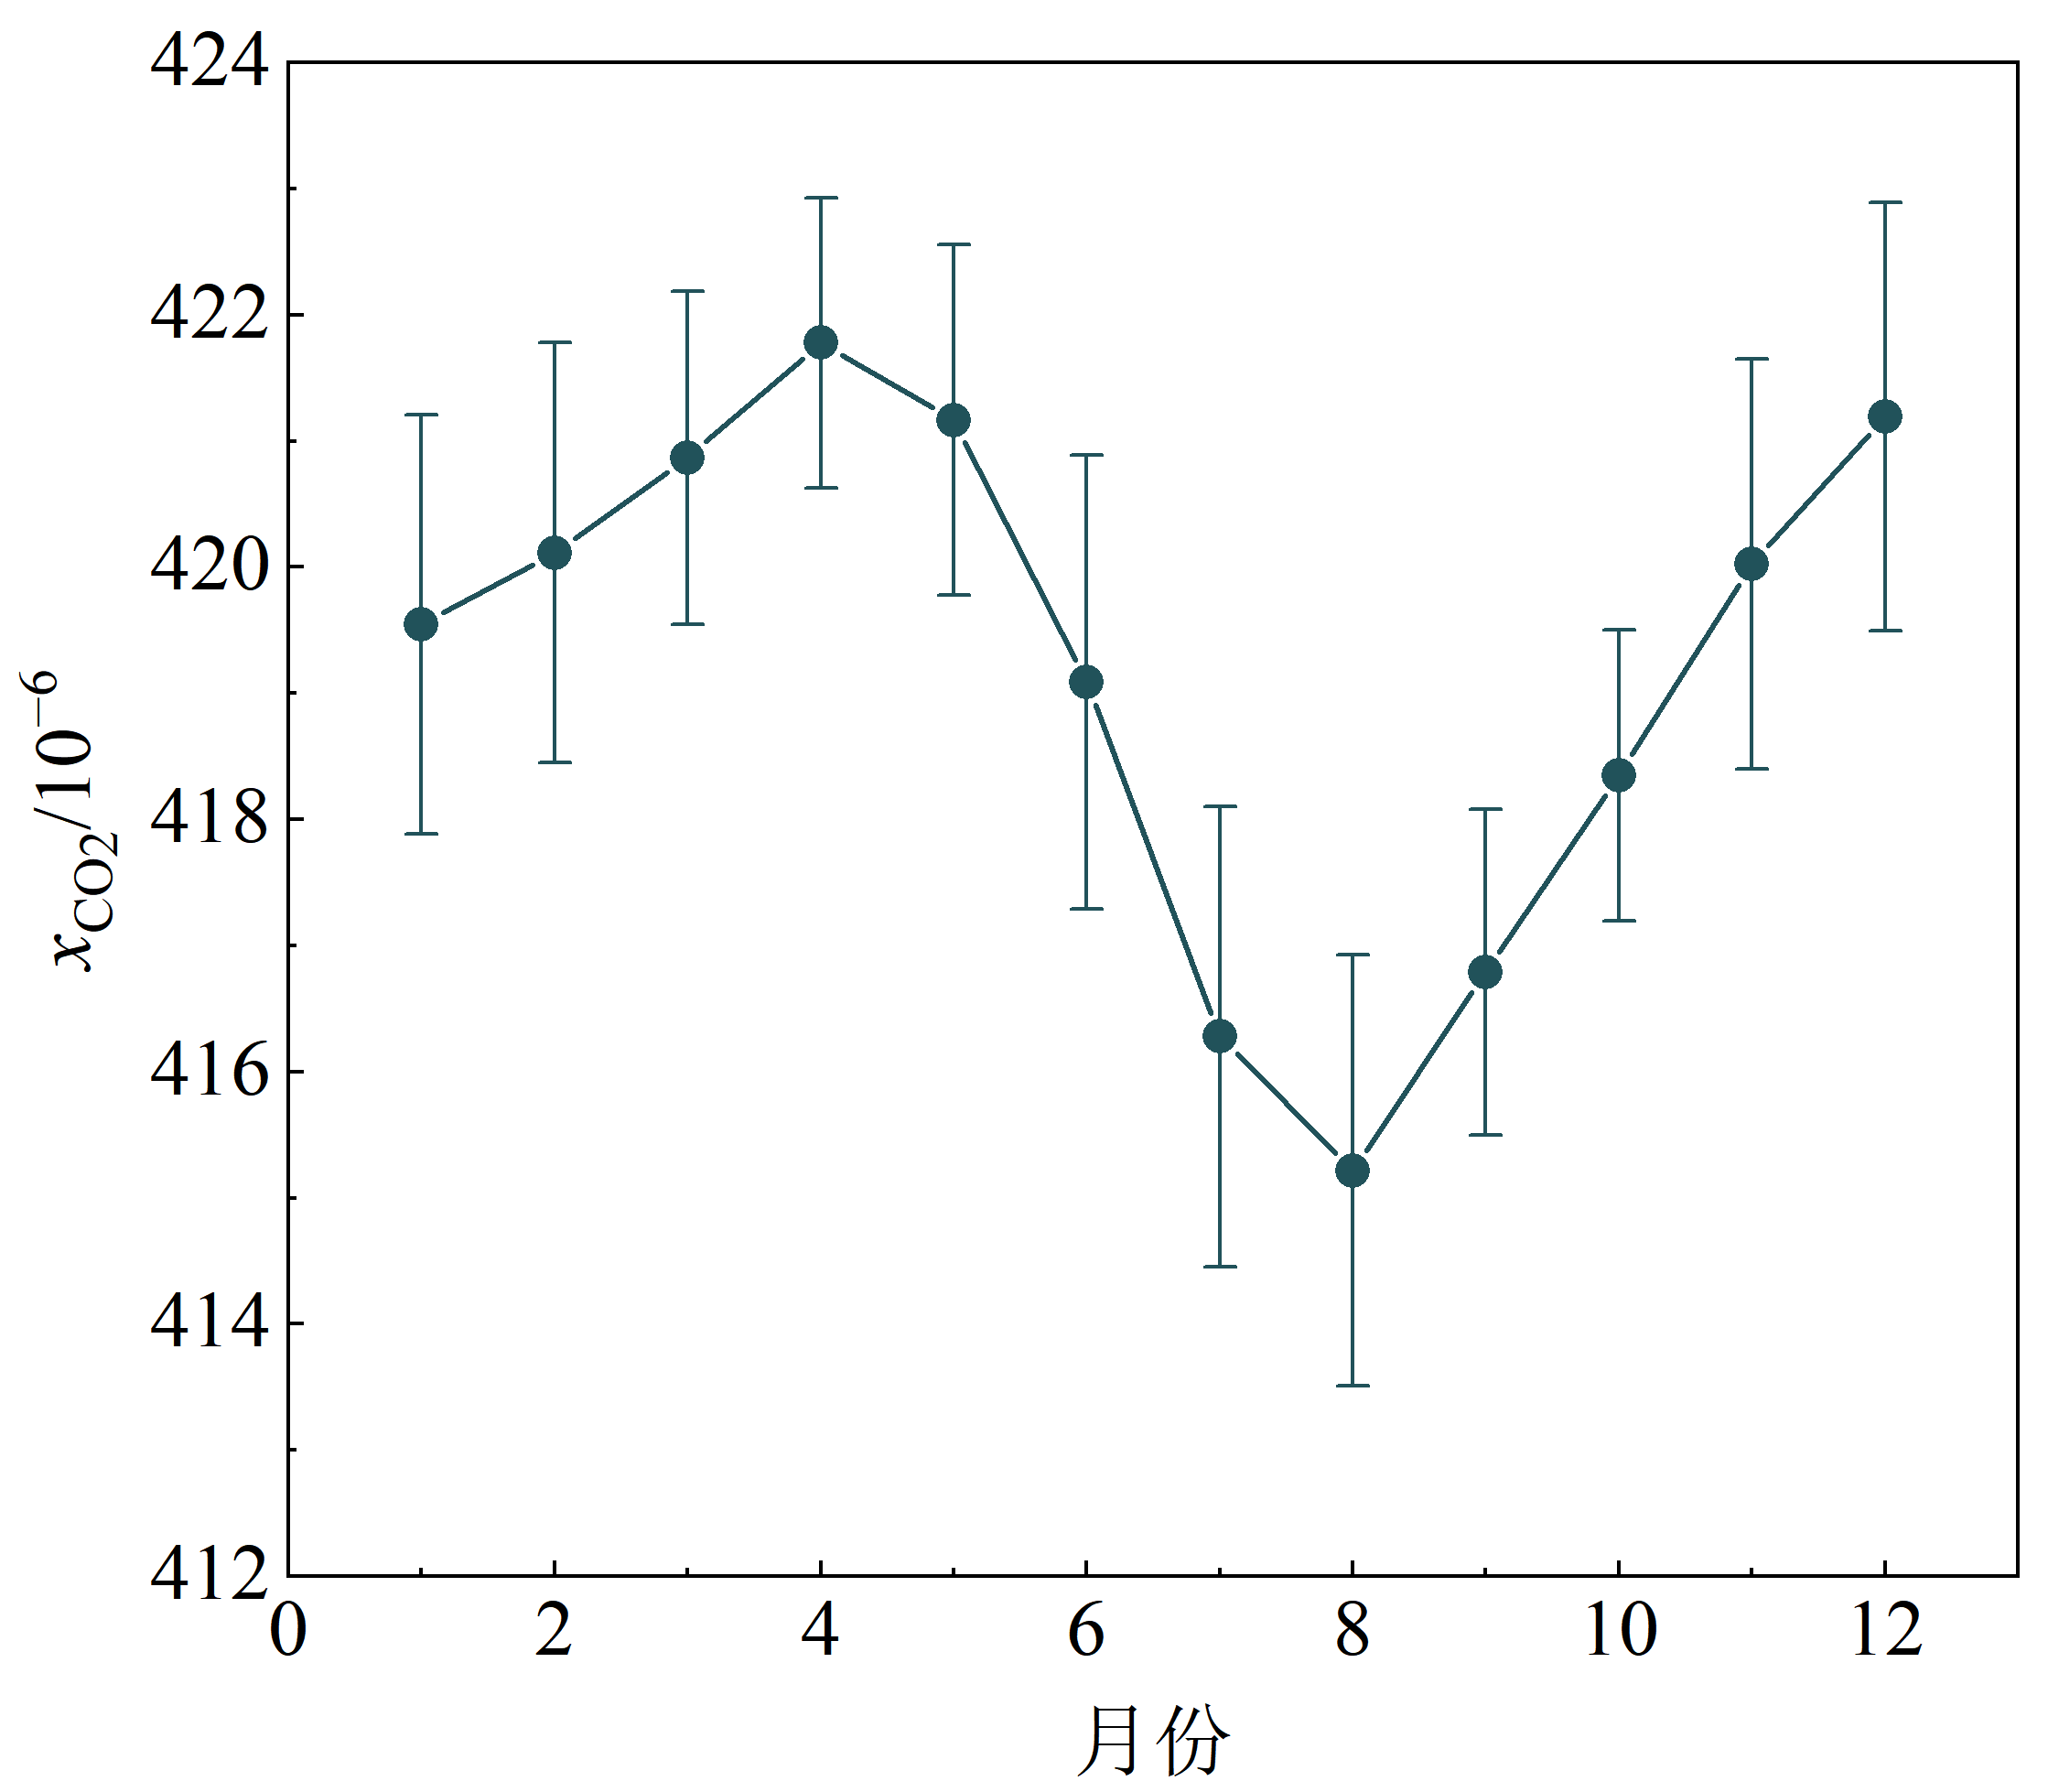
图7 2023年月均大气xCO2变化趋势
Figure 7 Trends in monthly average atmospheric xCO2 concentrations in 2023

图8 2023年月均大气xCO2空间分布
Figure 8 Spatial distribution of monthly average atmospheric xCO2 concentrations in 2023
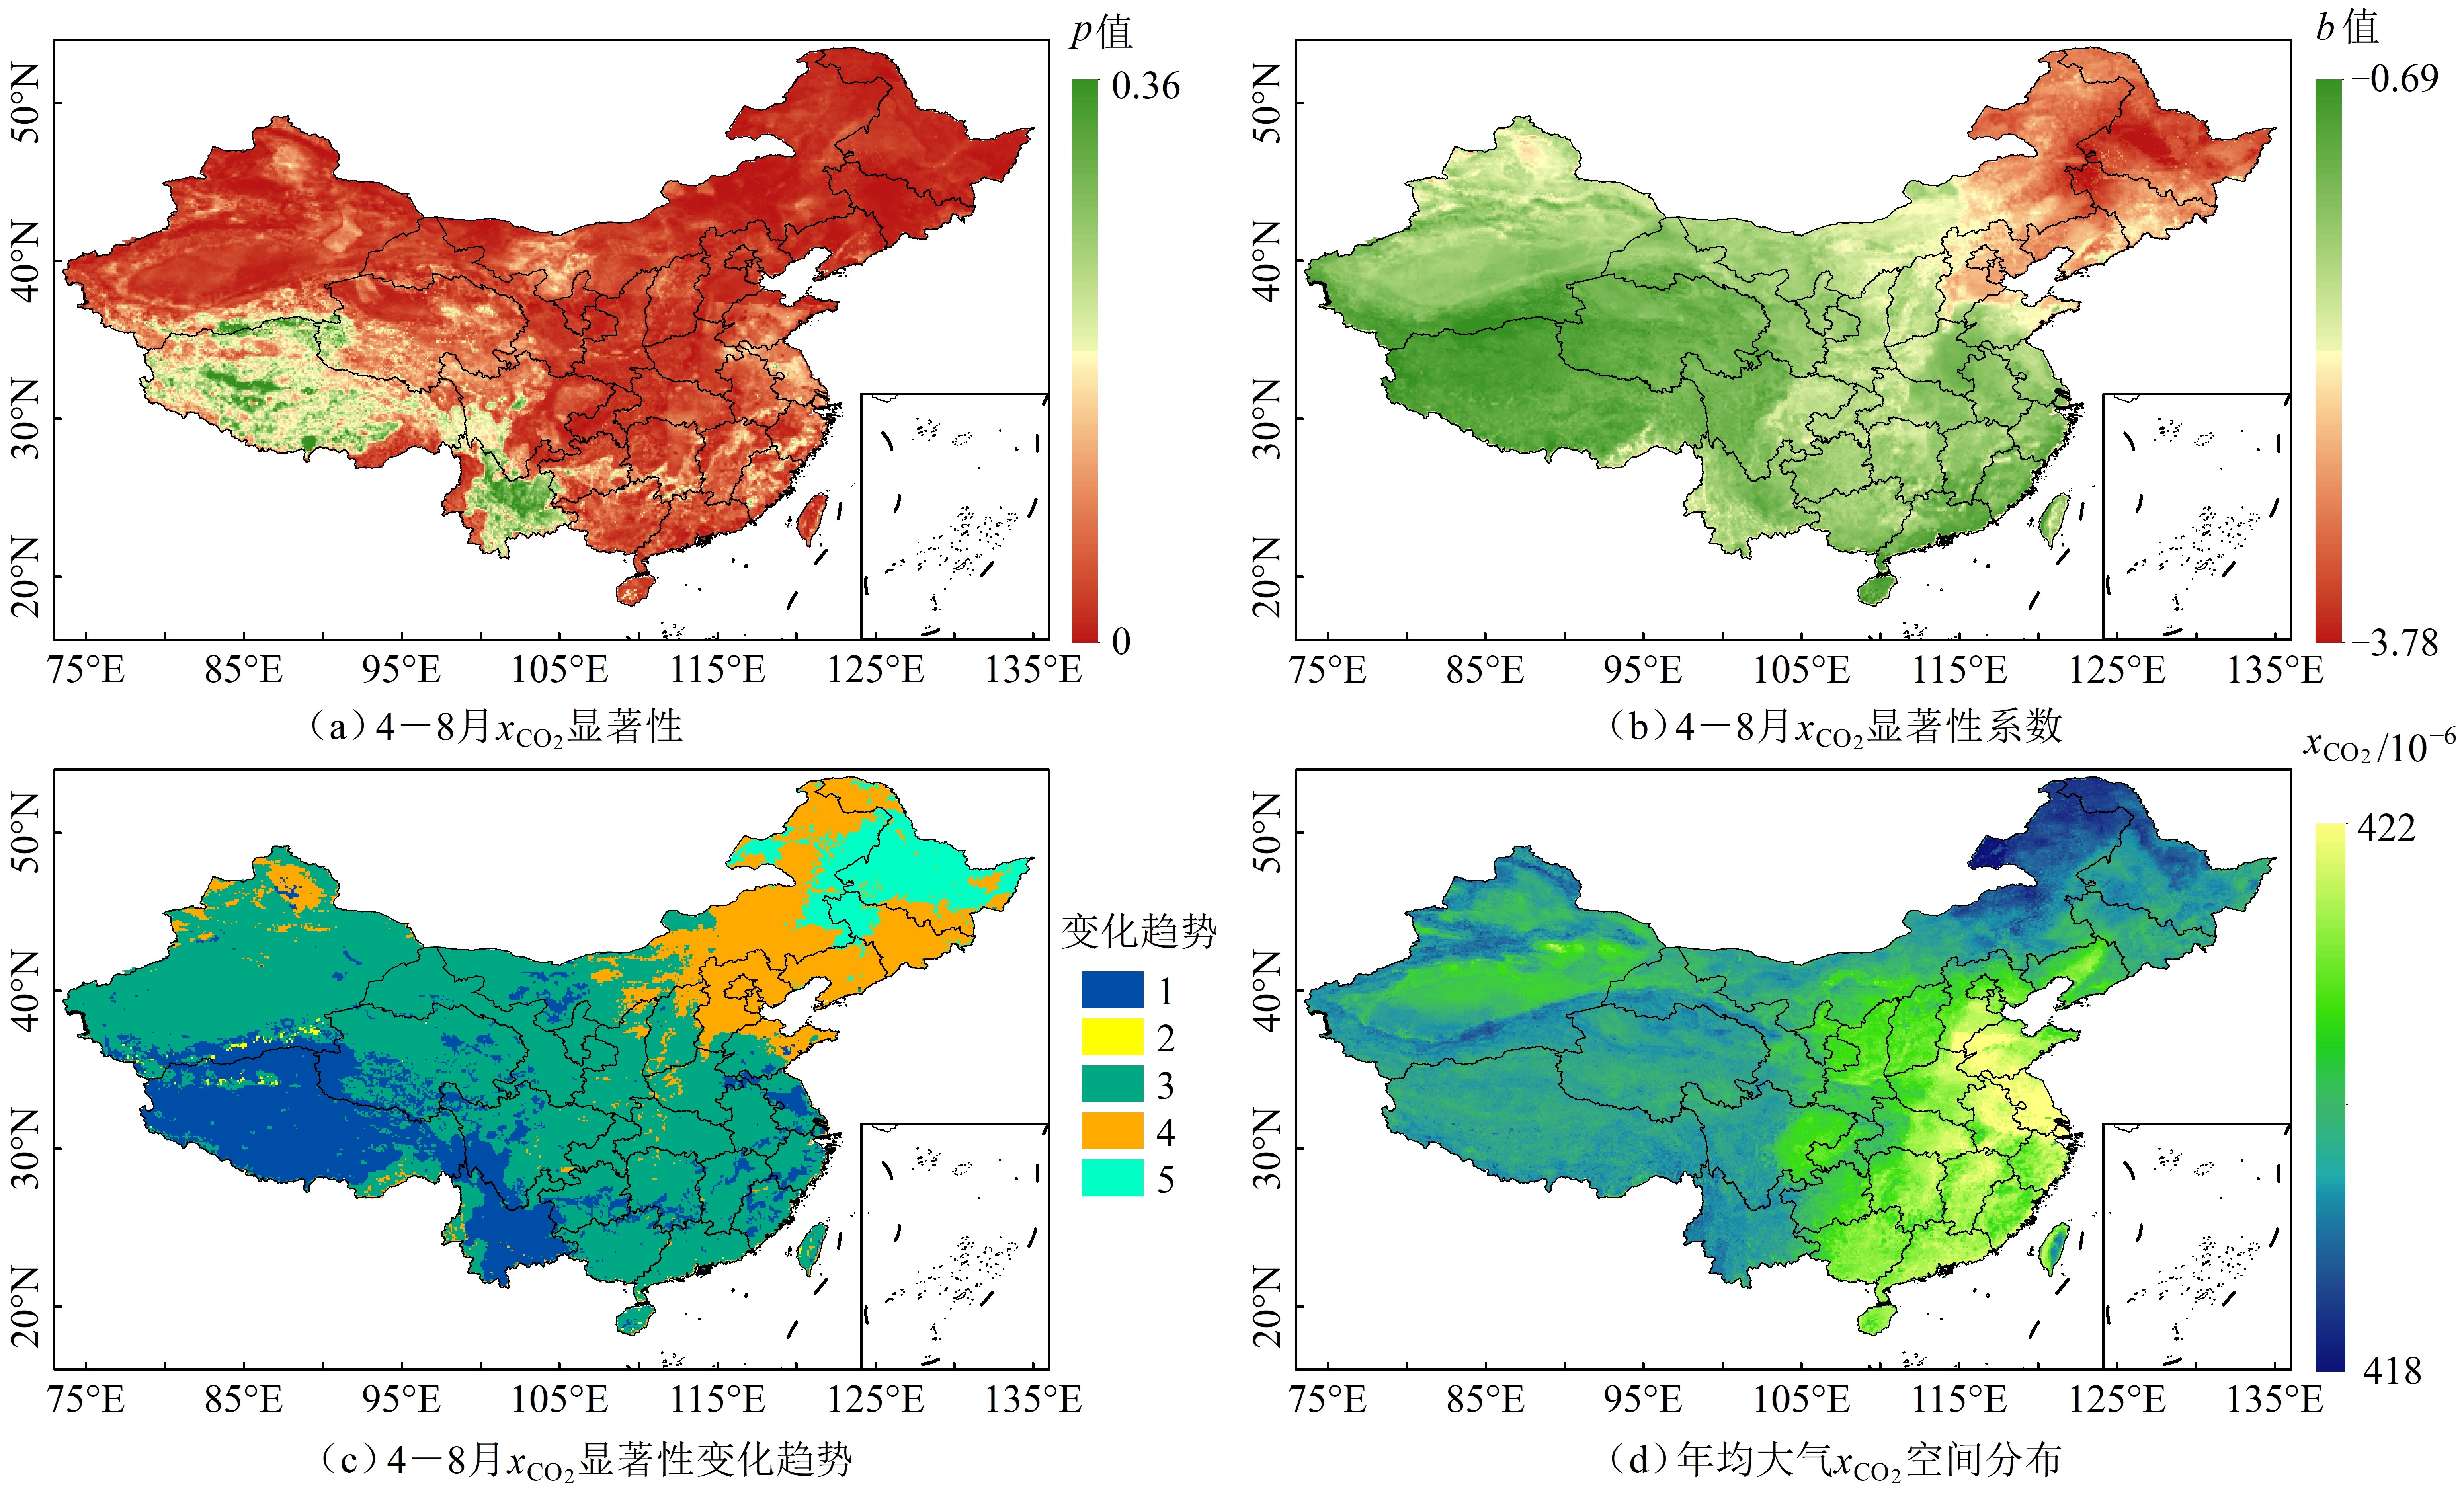
图9 2023年大气xCO2的变化趋势分析 利用相关关系显著性(p)和斜率(b)判断4-8月大气xCO2的变化趋势,当p≥0.05时,大气xCO2无显著性变化,用数值1表示;当p<0.05,b>?1时,用数值2表示;当p<0.05,b>?2时,用数值3表示;当p<0.05,b>?3时,用数值4表示;当p<0.05,b≤?3时,用数值5表示,显著性减少依次递增
Figure 9 Analysis of the Variations in Atmospheric xCO2 in 2023
| [1] | BA R, LOVALLO M, SONG W, et al., 2022. Multifractal analysis of MODIS Aqua and Terra satellite time series of normalized difference vegetation index and enhanced vegetation index of sites affected by wildfires[J]. Entropy, 24(12): 1748. |
| [2] | CRISP D, MILLER C E, DECOLA P L, 2008. NASA Orbiting Carbon Observatory: Measuring the column averaged carbon dioxide mole fraction from space[J]. Journal of Applied Remote Sensing, 2(1): 23508-23521. |
| [3] | CRISP D, POLLOCK H R, ROSENBERG P, et al., 2017. The on-orbit performance of the Orbiting Carbon Observatory-2 (OCO-2) instrument and its radiometrically calibrated products[J]. Atmospheric Measurement Technique, 10(1): 59-81. |
| [4] | ELDERING A, TAYLOR T E, O'DELL C W, et al., 2019. The OCO-3 mission: Measurement objectives and expected performance based on 1 year of simulated data[J]. Atmospheric Measurement Techniques, 12(4): 2341-2370. |
| [5] | ELVIDGE C D, ZHIZHIN M, GHOSH T, et al., 2021. Annual time series of global VIIRS Nighttime Lights derived from monthly averages: 2012 to 2019[J]. Remote Sensing, 13(5): 922. |
| [6] | FANG J J, CHEN B Z, ZHANG H F, et al., 2023. Global evaluation and intercomparison of XCO2 retrievals from GOSAT, OCO-2, and TANSAT with TCCON[J]. Remote Sensing, 15(20): 5073. |
| [7] | FRANKENBERG C, BUTZ A, TOON G C, 2011. Disentangling chlorophyll fluorescence from atmospheric scattering effects in O2 A-band spectra of reflected sun-light[J]. Geophysical Research Letters, 38(3): 1-5. |
| [8] | FRANKENBERG C, O'DELL C, GUANTER L, et al., 2012. Remote sensing of near-infrared chlorophyll fluorescence from space in scattering atmospheres: implications for its retrieval and interferences with atmospheric CO2 retrievals[J]. Atmospheric Measurement Techniques, 5(8): 2081-2094. |
| [9] | GUERLET S, BUTZ A, SCHEPERS D, et al., 2023. Aben impact of aerosol and thin cirrus on retrieving and validating XCO2 from GOSAT shortwave infrared measurements[J]. Journal of Geophysical Research: Atmospheres, 118(10): 4887-4905. |
| [10] | HAN F Q, KASIMU A, WEI B H, et al., 2023. Spatial and temporal patterns and risk assessment of carbon source and sink balance of land use in watersheds of arid zones in China - a case study of Bosten Lake basin[J]. Ecological Indicators, 157(15): 111308-111323. |
| [11] | HONG J M, KIM J, JUNG Y J, et al., 2023. Potential improvement of XCO2 retrieval of the OCO-2 by having aerosol information from the A-train satellites[J]. GIScience & Remote Sensing, 60(1): 2209968. |
| [12] | HUETE A, DIDAN K, MIURA T, et al., 2002. Overview of the radiometric and biophysical performance of the MODIS vegetation indices[J]. Remote Sensing of Environment, 83(1): 195-213. |
| [13] | HWANG J, CHA D H, YOON D, et al., 2024. Effects of initial and boundary conditions on heavy rainfall simulation over the yellow sea and the Korean Peninsula: Comparison of ECMWF and NCEP analysis data effects and verification with dropsonde observation[J]. Advances in Atmospheric Sciences, 41: 1787-1803. |
| [14] | HWANG Y, UM J S, 2016. Performance evaluation of OCO-2 XCO2 signatures in exploring casual relationship between CO2 emission and land cover[J]. Spatial Information Research, 24(4): 451-461. |
| [15] | JOSHUA L L, GEOFFREY C T, JOSEPH M, et al., 2023. The total carbon column observing network’s GGG2020 data version[J]. Earth System Science Data, 16(5): 2197-2260. |
| [16] | KIEL M, O'DELL C W, FISHER B, et al., 2019. How bias correction goes wrong: Measurement of XCO2 affected by erroneous surface pressure estimates[J]. Atmospheric Measurement Techniques, 12(4): 2241-2259. |
| [17] | LAUGHNER J L, TOON C C, MENDONCA J, et al., 2024. The total carbon column observing network's GGG2020 data version[J]. Earth System Science Data, 16(5): 2197-2260. |
| [18] | LI J, JIA K, WEI X Q, et al., 2022. High-spatiotemporal resolution mapping of spatiotemporally continuous atmospheric CO2 concentrations over the global continent[J]. International Journal of Applied Earth Observation and Geoinformation, 108: 102743-102756. |
| [19] | LIANG A, HAN G, GONG W, et al., 2017. Comparison of global XCO2concentrations from OCO-2 with TCCON data in terms of latitude zones[J]. IEEE Journal of Selected Topics in Applied Earth Observations and Remote Sensing, 10(6): 2491-2498. |
| [20] | LIU Z, OSTRENGA D, VOLLMER B, et al., 2017. Global precipitation measurement (GPM) mission products and services at the NASA goddard earth sciences (GES) data and information services center (DISC)[J]. Bulletin of the American Meteorological Society, 98(3): 437-444. |
| [21] | LYU X, LI X B, WANG K, et al., 2023. Strengthening grassland carbon source and sink management to enhance its contribution to regional carbon neutrality[J]. Ecological Indicators, 152: 110341-110352. |
| [22] | O'DELL C W, ELDERING A, WENNBERG P O, et al., 2018. Improved retrievals of carbon dioxide from Orbiting Carbon Observatory-2 with the version 8 ACOS algorithm[J]. Atmospheric Measurement Techniques, 11(12): 6539-6576. |
| [23] | SIABI Z, FALAHATKAR S, ALAVI J S, et al., 2019. Spatial distribution of XCO2 using OCO-2 data in growing seasons[J]. Journal of Environmental Management, 244: 110-118. |
| [24] | SUTO H, KATAOKA F, KIKUCHI N, et al., 2021. Thermal and near-infrared sensor for carbon observation Fourier transform spectrometer-2 (TANSO-FTS-2) on the Greenhouse gases Observing SATellite-2 (GOSAT-2) during its first year in orbit[J]. Atmospheric Measurement Techniques, 14(3): 2013-2039. |
| [25] | TAYLOR T E, O'DELL C W, CRISP D, et al., 2022. An 11-year record of XCO2 estimates derived from GOSAT measurements using the NASA ACOS version 9 retrieval algorithm[J]. Earth System Science Data, 14(1): 325-360. |
| [26] | TESTA S, SOUDANI K, BOSCHETTI L, et al., 2017. MODIS-derived EVI, NDVI and WDRVI time series to estimate phenological metrics in French deciduous forests[J]. International Journal of Applied Earth Observation and Geoinformation, 64: 132-144. |
| [27] | WORDEN J R, DORAN G, KULAWIK S, et al., 2017. Evaluation and attribution of OCO-2 XCO2 uncertainties[J]. Atmospheric Measurement Techniques, 10(7): 2759-2771. |
| [28] | WUNCH D, WENNBERG P O, OSTERMAN G, et al., 2017. Comparisons of the orbiting carbon observatory-2 (OCO-2) XCO2 measurements with TCCON[J]. Atmospheric Measurement Techniques, 10(6): 2209-2238. |
| [29] | YANG D X, JANNE H, YI L, et al., 2022. Detection of anthropogenic CO2 emission signatures with TanSat CO2 and with copernicus Sentinel-5 Precursor (S5P) NO2 measurements: First results[J]. Advances in atmospheric sciences, 40(1): 1-5. |
| [30] | ZHAO J, LI T J, SHI K F, et al., 2021. Evaluation of ERA-5 precipitable water vapor data in plateau areas: A case study of the Northern Qinghai-Tibet Plateau[J]. Atmosphere. 12(10): 1367. |
| [31] | 寇江泽, 刘温馨, 2024. 落实 “双碳” 行动建设美丽中国[N]. 人民日报, 2024-04-28(2). |
| KOU J Z, LIU W X, 2024. Implementing the “Dual Carbon” Initiative to Build a Beautiful China[N]. People’s Daily, 2024-04-28 (2). | |
| [32] |
刘佳雯, 贾若愚, 蒋玉颖, 等, 2023. 中国主要空气污染物浓度对土地利用类型的响应关系[J]. 资源科学, 45(9): 1869-1883.
DOI |
|
LIU J W, JIA R Y, JIANG Y Y, et al., 2023. The response of major air pollutants concentration to land use types in China[J]. Resources Science, 45(9): 1869-1883.
DOI |
|
| [33] | 罗澜, 2024. 世界气象组织: 2023年气候变化和极端天气重创亚洲[J]. 生命与灾害 (7): 12-13. |
| LUO L, 2024. World Meteorological Organisation: Climate change and extreme weather to hit Asia hard in 2023[J]. Life and Disasters (7): 12-13. | |
| [34] | 杨扬, 韩佳容, 2024. 重点产业政策与中国省际贸易隐含碳排放转移[J]. 中山大学学报(社会科学版), 64(5): 178-187. |
| YANG Y, HAN J L, 2024. Key industrial policies and implied carbon emission shift in China’s Interprovincial Trade[J]. Journal of Sun Yat-sen University (Social Science Edition), 64(5): 178-187. | |
| [35] |
元志辉, 包刚, 银山, 等, 2016. 2000-2014年浑善达克沙地植被覆盖变化研究[J]. 草业学报, 25(1): 33-46.
DOI |
| YUAN Z H, BAO G, YIN S, et al., 2016. Pegetation changes in Otindag sand country during 2000-2014[J]. Acta Prataculturae Sinica, 25(1): 33-46. | |
| [36] |
张杨, 徐永明, 卢响军, 等, 2024. 基于OCO-2遥感数据的新疆维吾尔自治区大气XCO2空间化研究[J]. 生态环境学报, 33(2): 231-241.
DOI |
| ZHANG Y, XU Y M, LU X J, et al., 2024. Spatialization of atmospheric XCO2 in Xinjiang Uygur Autonomous Region based on OCO-2 remote sensing data[J]. Journal of Ecological and Environmental Sciences, 33(2): 231-241. | |
| [37] | 钟惠, 2019. 卫星遥感大气CO2浓度变化与人为排放的关联分析研究[D]. 北京: 中国科学院大学: 22-65. |
| ZHONG H, 2019. Study on the correlation analysis of satellite remote sensing atmospheric CO2 concentration changes with anthropogenic emissions[D]. Beijing: University of Chinese Academy of Sciences: 22-65. |
| [1] | 张晟博, 吴作航, 党皓飞, 廖廓, 陆灯盛, 李登秋. 近20年武夷山地区不同遥感指标对极端气候事件的响应及差异[J]. 生态环境学报, 2025, 34(8): 1240-1254. |
| [2] | 丁馨, 刘健, 魏俐宏, 解德威, 郑昭佩. 基于GSMSR模型的山东省植被NEP时空格局及影响因素[J]. 生态环境学报, 2025, 34(7): 1079-1089. |
| [3] | 祁珣, 冯鑫鑫, 陈颖军, 冯艳丽, 陈田, 李军, 张干. 轻型汽油卡车尾气颗粒物中氨和有机胺的排放特征及影响因素[J]. 生态环境学报, 2025, 34(7): 997-1006. |
| [4] | 郭欣达, 付奔, 余思洁, 侯鹰, 陈卫平. 城市内涝和夏季高温风险评价与优先管控区识别方法研究[J]. 生态环境学报, 2025, 34(5): 731-742. |
| [5] | 张丹丹, 毋振海, 吴渴, 毕方, 李云凤, 安聪, 韩翼昕, 刘正阳, 朱玲, 王学中. 基于不同类型臭氧污染日的臭氧污染特征及影响因素分析:以亳州市为例[J]. 生态环境学报, 2025, 34(5): 720-730. |
| [6] | 蒋存征, 陈安强, 胡万里, 付斌, 朱林立, 刘云娥, 黎明琦, 王炽, 张丹. 异龙湖区浅层地下水NO3−-N浓度时空变化及其来源解析[J]. 生态环境学报, 2025, 34(4): 570-580. |
| [7] | 郭铭彬, 龚建周, 王丽娟, 王时宽. 2019-2023年粤港澳大湾区NO2浓度变化的自然主控因子解析[J]. 生态环境学报, 2025, 34(4): 534-547. |
| [8] | 陈鹏, 马育军, 张梦雅, 陈婉婷, 江晓鹏. 基于kNDVI的广东省植被动态变化分析[J]. 生态环境学报, 2025, 34(4): 499-510. |
| [9] | 郭昭, 师芸, 刘铁铭, 张雨欣, 闫永智. 2001-2020年秦岭北麓NPP时空格局及驱动因素分析[J]. 生态环境学报, 2025, 34(3): 401-410. |
| [10] | 赵乐鋆, 王诗瑶, 赵子渝, 洪星, 李夫星, 吴佳仪, 华婧妤. 2008-2022年华北平原七省市AOD时空变化特征及主要影响因素分析[J]. 生态环境学报, 2025, 34(2): 256-267. |
| [11] | 李建付, 黄志霖, 和成忠, 姜昕, 宋琳, 刘佳鑫, 陈利顶. 滇东喀斯特断陷盆地土壤有机碳空间分布特征及其关键影响因子[J]. 生态环境学报, 2024, 33(9): 1339-1352. |
| [12] | 侯金龙, 马志强, 杨澄, 葛双双, 何迪, 董璠. 京津冀地区植被碳源/汇的时空变化特征及影响因素分析[J]. 生态环境学报, 2024, 33(9): 1329-1338. |
| [13] | 王捷纯, 邓玉娇, 朱怀卫, 孔蕴淇. 广东省不同生态系统植被NPP时空变化及对气候因子的响应[J]. 生态环境学报, 2024, 33(6): 831-840. |
| [14] | 陈晓辉, 胡喜生. 耦合ER和GWR的福州市生态环境质量的驱动力分析[J]. 生态环境学报, 2024, 33(5): 812-823. |
| [15] | 张淼, 王桂霞, 王昌伟, 贺艳云, 许艳芳, 李琪, 许杨, 张俊骁, 张桂芹. 济南市区黑碳污染变化特征及来源解析[J]. 生态环境学报, 2024, 33(4): 560-572. |
| 阅读次数 | ||||||
|
全文 |
|
|||||
|
摘要 |
|
|||||