生态环境学报 ›› 2025, Vol. 34 ›› Issue (8): 1240-1254.DOI: 10.16258/j.cnki.1674-5906.2025.08.009
张晟博1( ), 吴作航2,3, 党皓飞2, 廖廓2, 陆灯盛1, 李登秋1,*()
收稿日期:2025-02-19
出版日期:2025-08-18
发布日期:2025-08-01
通讯作者:
*E-mail: 作者简介:张晟博(2002年生),男,硕士研究生,研究方向为极端气候、森林碳循环。E-mail: 572042526@qq.com
基金资助:
ZHANG Shengbo1(), WU Zuohang2,3, DANG Haofei2, LIAO Kuo2, LU Dengsheng1, LI Dengqiu1,*()
Received:2025-02-19
Online:2025-08-18
Published:2025-08-01
摘要:
在全球气候变化的背景下,极端气候事件的频率和强度不断增加,对区域生态系统的结构、功能和稳定性的影响愈加显著。武夷山作为中国东南部典型的亚热带生态区,地形复杂、生物多样性丰富,探究武夷山地区植被与极端气候的时空变化和响应特征对提升区域应对极端气候事件的能力具有重要意义。基于2001-2021年间的多种遥感数据,运用Sen’s趋势分析、MK趋势检验和随机森林等方法,分析了2001-2021年间武夷山地区的核归一化植被指数(kNDVI)、增强型植被指数(EVI)、净初级生产力(NPP)和森林压力指数(FSI)时空变化趋势及其对极端气候事件和环境因子的响应。研究结果表明武夷山地区kNDVI和EVI总体呈上升趋势,植被绿化明显;北部耕地区域NPP增长显著;FSI在中部武夷山国家公园周围呈上升趋势,植被生长状况良好,而西南部植被生长则受压。武夷山地区极端气温事件的频率增加,暖昼和暖夜事件分别以0.7%/(10a)和1.5%/(10a)的速率上升;极端降水事件有所增强,研究区干湿状况波动较大,但未表现出显著的干湿趋势。持续干旱日数、年最小日最低气温、暖夜日数和持续冷日指数分别是影响kNDVI、EVI、NPP和FSI的最关键变量;海拔和坡度变异系数对4种指标均表现出重要性。
中图分类号:
张晟博, 吴作航, 党皓飞, 廖廓, 陆灯盛, 李登秋. 近20年武夷山地区不同遥感指标对极端气候事件的响应及差异[J]. 生态环境学报, 2025, 34(8): 1240-1254.
ZHANG Shengbo, WU Zuohang, DANG Haofei, LIAO Kuo, LU Dengsheng, LI Dengqiu. The Response and Differences of Different Remote Sensing Vegetation Indices to Extreme Climate Events in the Wuyi Mountain Region over the Last 20 Years[J]. Ecology and Environmental Sciences, 2025, 34(8): 1240-1254.

图1 研究区地理位置、地形及气象站分布 该图基于国家地理信息公共服务平台下载的审图号为GS(2024)0650号的标准地图制作,底图无修改。下同
Figure 1 Geographical location, topography, and distribution of meteorological stations in the study area
| 类别 | 名称 | 数据 | 原始分辨率 | 本研究 | 来源 |
|---|---|---|---|---|---|
| 气象 数据 | 气象数据 | 逐日最高最低气温、降水量 | 基于站点,日尺度 | 基于站点,日尺度 | |
| 遥感 指标 | 核归一化植被指数(kNDVI) | MODIS/061/ MOD13Q1 | 250 m×250 m, 16 d | 250 m×250 m, 年尺度 | |
| 增强型植被指数(EVI) | |||||
| 净初级生产力(NPP) | MODIS/061/ MOD17A3HGF | 500 m×500 m, 年尺度 | 250 m×250 m, 年尺度 | | |
| 森林压力指数(FSI) | MODIS/006/ MOD11A1 | 1 km×1 km, 日尺度 | 250 m×250 m, 年尺度 | | |
| MODIS/006/ MOD16A2 | 500 m×500 m, 8 d | 250 m×250 m, 年尺度 | | ||
| 中国1 km分辨率逐月降水数据集 (1901-2021) | 0.0083°×0.0083°, 月尺度 | 250 m×250 m, 年尺度 | Peng et al., | ||
| 环境 变量 | 高程 | USGS/ SRTMGL1_003 | 30 m×30 m, 静态变量 | 30 m×30 m, 静态变量 | |
| 坡度 | |||||
| 坡向 | |||||
| 土壤类型 | 中国土壤类型空间分布数据集 | 1 km×1 km, 静态变量 | 1 km×1 km, 静态变量 | | |
| 土壤质地 (砂土、粉砂土、黏土) | 中国土壤质地空间分布数据集 | 1 km×1 km, 静态变量 | 1 km×1 km, 静态变量 | ||
| 冠层高度 | ETH Global Sentinel-2 | 10 m×10 m, 静态变量 | 10 m×10 m, 静态变量 | Lang et al., | |
| 土地覆盖类型 | GLC_FCS30 | 30 m×30 m,年尺度 | 30 m×30 m,年尺度 | Zhang et al., |
表1 数据来源
Table 1 Data source
| 类别 | 名称 | 数据 | 原始分辨率 | 本研究 | 来源 |
|---|---|---|---|---|---|
| 气象 数据 | 气象数据 | 逐日最高最低气温、降水量 | 基于站点,日尺度 | 基于站点,日尺度 | |
| 遥感 指标 | 核归一化植被指数(kNDVI) | MODIS/061/ MOD13Q1 | 250 m×250 m, 16 d | 250 m×250 m, 年尺度 | |
| 增强型植被指数(EVI) | |||||
| 净初级生产力(NPP) | MODIS/061/ MOD17A3HGF | 500 m×500 m, 年尺度 | 250 m×250 m, 年尺度 | | |
| 森林压力指数(FSI) | MODIS/006/ MOD11A1 | 1 km×1 km, 日尺度 | 250 m×250 m, 年尺度 | | |
| MODIS/006/ MOD16A2 | 500 m×500 m, 8 d | 250 m×250 m, 年尺度 | | ||
| 中国1 km分辨率逐月降水数据集 (1901-2021) | 0.0083°×0.0083°, 月尺度 | 250 m×250 m, 年尺度 | Peng et al., | ||
| 环境 变量 | 高程 | USGS/ SRTMGL1_003 | 30 m×30 m, 静态变量 | 30 m×30 m, 静态变量 | |
| 坡度 | |||||
| 坡向 | |||||
| 土壤类型 | 中国土壤类型空间分布数据集 | 1 km×1 km, 静态变量 | 1 km×1 km, 静态变量 | | |
| 土壤质地 (砂土、粉砂土、黏土) | 中国土壤质地空间分布数据集 | 1 km×1 km, 静态变量 | 1 km×1 km, 静态变量 | ||
| 冠层高度 | ETH Global Sentinel-2 | 10 m×10 m, 静态变量 | 10 m×10 m, 静态变量 | Lang et al., | |
| 土地覆盖类型 | GLC_FCS30 | 30 m×30 m,年尺度 | 30 m×30 m,年尺度 | Zhang et al., |
| 类别 | 指数代码 | 指数名称 | 定义 | 单位 |
|---|---|---|---|---|
| 极端气温指数 | TX90p | 暖昼日数 | 最高气温>90%分位值的日数比例 | % |
| TN90p | 暖夜日数 | 最低气温>90%分位值的日数比例 | % | |
| TX10p | 冷昼日数 | 最高气温<10%分位值的日数比例 | % | |
| TN10p | 冷夜日数 | 最低气温<10%分位值的日数比例 | % | |
| TXx | 年最大日最高气温 | 年内日最高气温的最大值 | ℃ | |
| TNx | 年最大日最低气温 | 年内日最低气温的最大值 | ℃ | |
| TXn | 年最小日最高气温 | 年内日最高气温的最小值 | ℃ | |
| TNn | 年最小日最低气温 | 年内日最低气温的最小值 | ℃ | |
| CSDI3 | 持续冷日指数 | 连续3 d最低气温<90%分位值日数 | d | |
| WSDI3 | 持续暖日指数 | 连续3 d最高气温>90%分位值日数 | d | |
| SU | 夏日日数 | 年内日最高气温>25 ℃的日数 | d | |
| TR | 热夜日数 | 年内日最低气温>20 ℃的日数 | d | |
| DTR | 气温日较差 | 年内日最高气温与最低气温的差值 | ℃ | |
| 极端干旱指数 | SPEI | 标准化降水蒸散发指数 | 使用降水和气温数据计算得到的表征干湿状态的指数 | 无 |
| 极端降水指数 | CDD | 持续干旱日数 | 日降水量<1 mm持续日数的最大值 | d |
| CWD | 持续降水日数 | 日降水量≥1 mm持续日数的最大值 | d | |
| Rx1-d | 最大1日降水量 | 年最大日降水量 | mm | |
| Rx5-d | 最大5日降水量 | 年最大连续5日的降水量 | mm | |
| R10-mm | 中雨日数 | 年日降水量>10 mm的总日数 | d | |
| R20-mm | 极端大雨日数 | 年日降水量>20 mm的总日数 | d | |
| R50-mm | 极端暴雨日数 | 年日降水量>50 mm的总日数 | d | |
| R95p | 强降水总量 | 日降水量>95%分位值的年累积降水量 | mm | |
| SDII | 年均雨日降水强度 | 日降水量≥1 mm的总量与总日数之比 | mm∙d−1 | |
| PRCPTOT | 总降水量 | 日降水量>1 mm的年累积降水量 | mm |
表2 极端气候指数的定义
Table 2 Definition of extreme climate indicators
| 类别 | 指数代码 | 指数名称 | 定义 | 单位 |
|---|---|---|---|---|
| 极端气温指数 | TX90p | 暖昼日数 | 最高气温>90%分位值的日数比例 | % |
| TN90p | 暖夜日数 | 最低气温>90%分位值的日数比例 | % | |
| TX10p | 冷昼日数 | 最高气温<10%分位值的日数比例 | % | |
| TN10p | 冷夜日数 | 最低气温<10%分位值的日数比例 | % | |
| TXx | 年最大日最高气温 | 年内日最高气温的最大值 | ℃ | |
| TNx | 年最大日最低气温 | 年内日最低气温的最大值 | ℃ | |
| TXn | 年最小日最高气温 | 年内日最高气温的最小值 | ℃ | |
| TNn | 年最小日最低气温 | 年内日最低气温的最小值 | ℃ | |
| CSDI3 | 持续冷日指数 | 连续3 d最低气温<90%分位值日数 | d | |
| WSDI3 | 持续暖日指数 | 连续3 d最高气温>90%分位值日数 | d | |
| SU | 夏日日数 | 年内日最高气温>25 ℃的日数 | d | |
| TR | 热夜日数 | 年内日最低气温>20 ℃的日数 | d | |
| DTR | 气温日较差 | 年内日最高气温与最低气温的差值 | ℃ | |
| 极端干旱指数 | SPEI | 标准化降水蒸散发指数 | 使用降水和气温数据计算得到的表征干湿状态的指数 | 无 |
| 极端降水指数 | CDD | 持续干旱日数 | 日降水量<1 mm持续日数的最大值 | d |
| CWD | 持续降水日数 | 日降水量≥1 mm持续日数的最大值 | d | |
| Rx1-d | 最大1日降水量 | 年最大日降水量 | mm | |
| Rx5-d | 最大5日降水量 | 年最大连续5日的降水量 | mm | |
| R10-mm | 中雨日数 | 年日降水量>10 mm的总日数 | d | |
| R20-mm | 极端大雨日数 | 年日降水量>20 mm的总日数 | d | |
| R50-mm | 极端暴雨日数 | 年日降水量>50 mm的总日数 | d | |
| R95p | 强降水总量 | 日降水量>95%分位值的年累积降水量 | mm | |
| SDII | 年均雨日降水强度 | 日降水量≥1 mm的总量与总日数之比 | mm∙d−1 | |
| PRCPTOT | 总降水量 | 日降水量>1 mm的年累积降水量 | mm |

图2 2001-2021年kNDVI、EVI、NPP和FSI变化趋势 图中展示了4种遥感指标的Theil-Sen中值斜率(a,c,e,g)与Mann-Kendall趋势检验结果(b,d,f,h),以及各指标的频率分布图。HSD:极显著下降(p<0.01)HSI:极显著上升(p<0.01)SD:显著下降(p<0.05)SI:显著上升(p<0.05)NSD:非显著下降(p>0.05)NSI:非显著上升(p>0.05)
Figure 2 Temporal trends of kNDVI, EVI, NPP, and FSI during 2001-2021
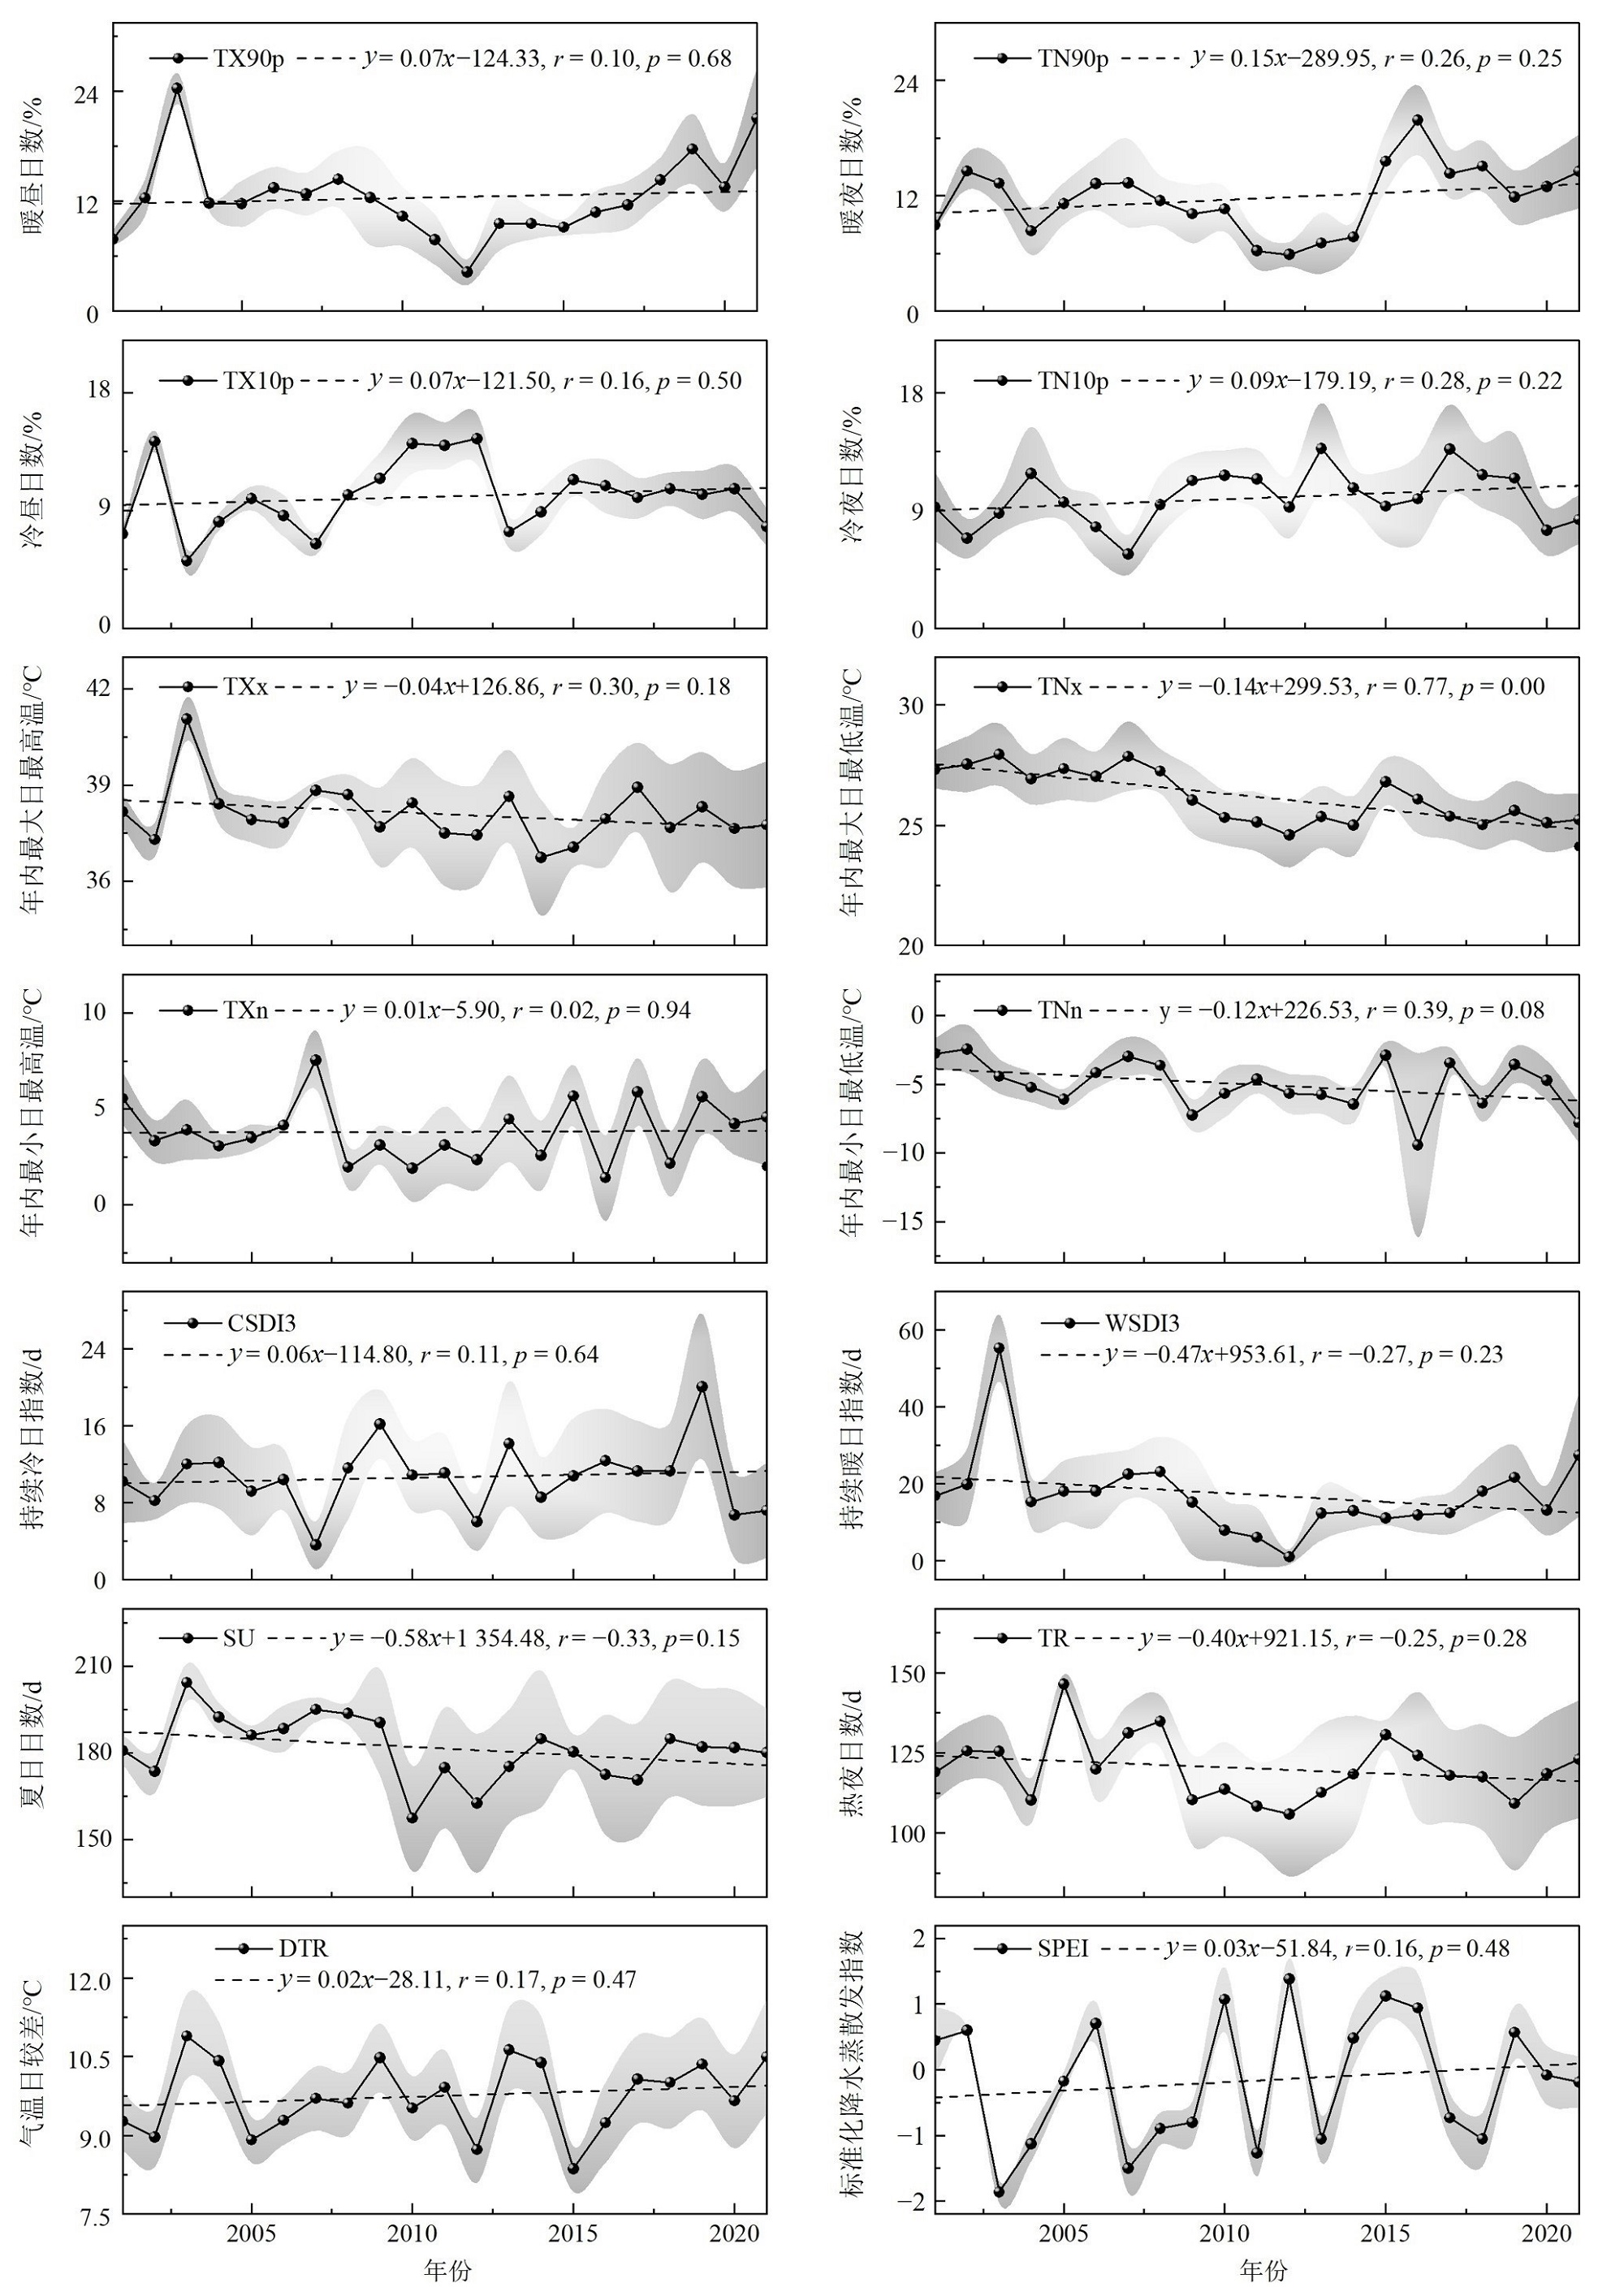
图3 2001-2021年极端气温和极端干旱指数的年际变化趋势 TX90p:暖昼日数;TN90p:暖夜日数;TX10p:冷昼日数;TN10p:冷夜日数;TXx:年最大日最高气温;TNx:年最大日最低气温;TXn:年最小日最高气温;TNn:年最小日最低气温;CSDI3:持续冷日指数;WSDI3:持续暖日指数;SU:夏日日数;TR:热夜日数;DTR:气温日较差;SPEI:标准化降水蒸散发指数;图中虚线表示线性回归趋势,阴影区域则代表不同站点之间的标准偏差
Figure 3 Interannual variation trend of extreme temperature and extreme drought indices from 2001 to 2021
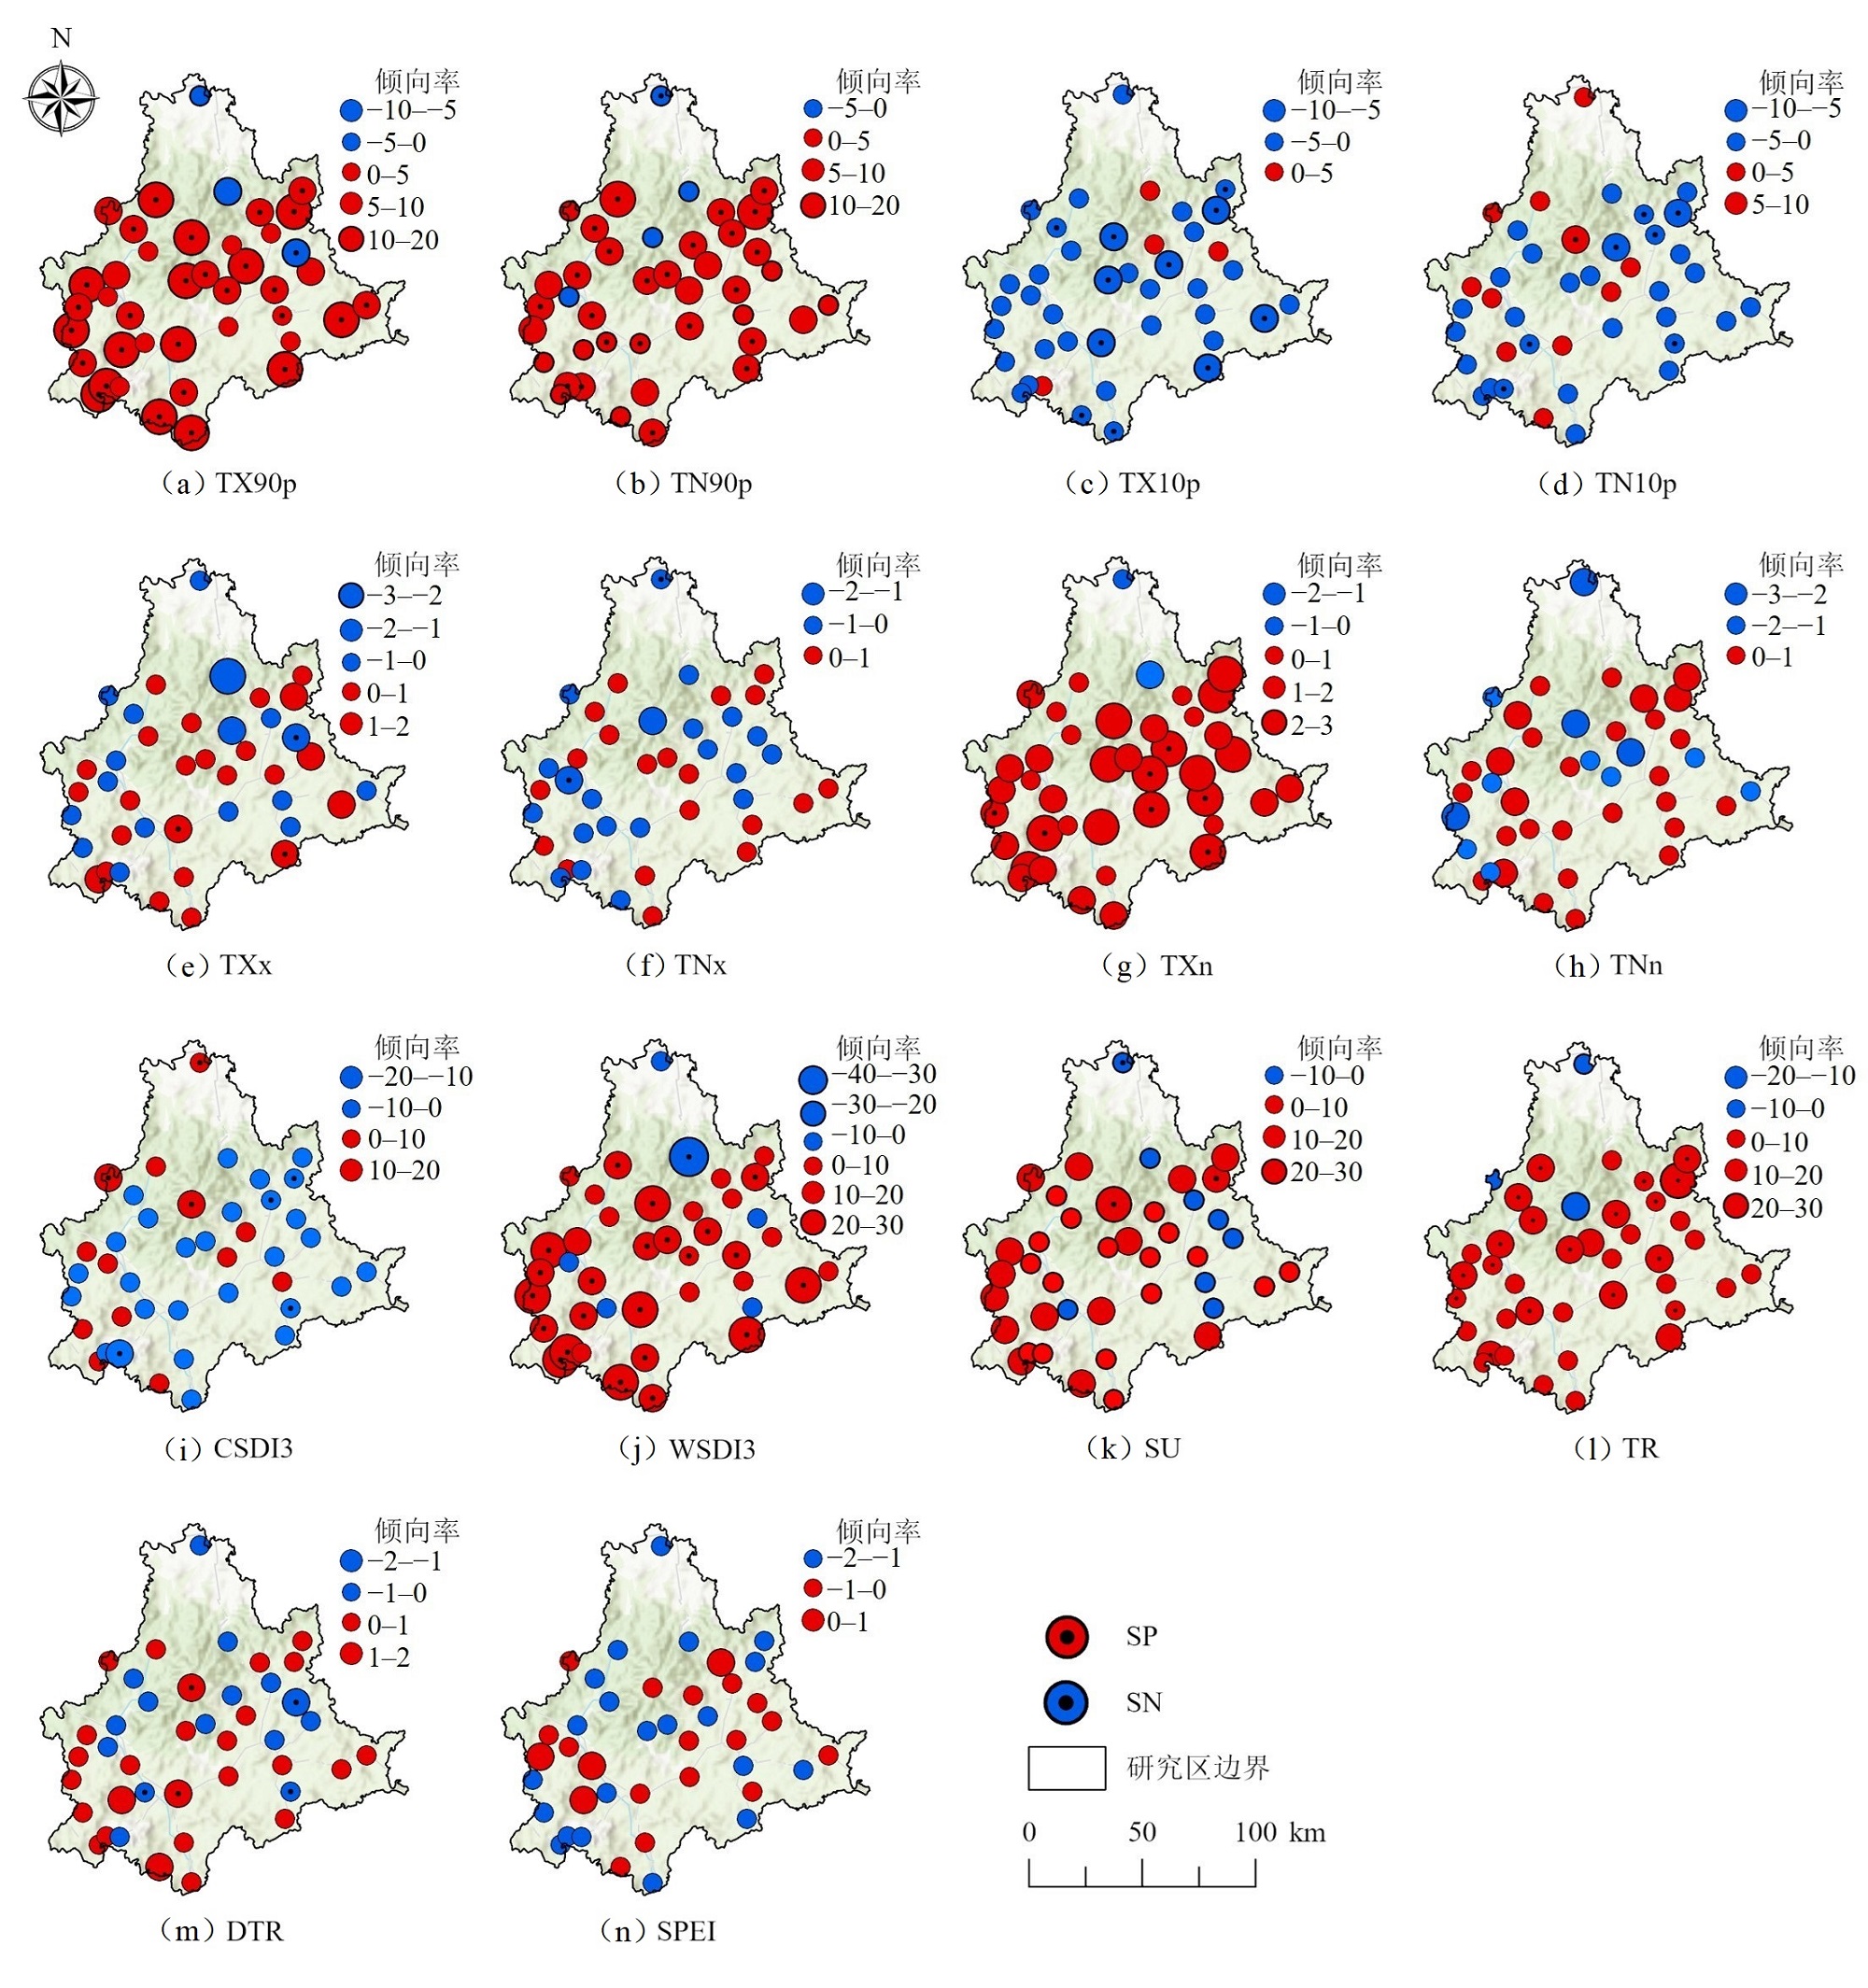
图4 2001-2021年研究区极端气温和干旱指数年际倾向率的空间分布 TX90p等极端气温及极端干旱指数的含义见图3注释。红色圆圈表示上升趋势,蓝色圆圈表示下降趋势。SN表示下降趋势(显著);SP表示上升趋势(显著)。显著性水平(p)设为0.05。圆圈大小表示变化程度
Figure 4 Spatial distribution of interannual trends of extreme temperature and drought indices in the study area from 2001 to 2021
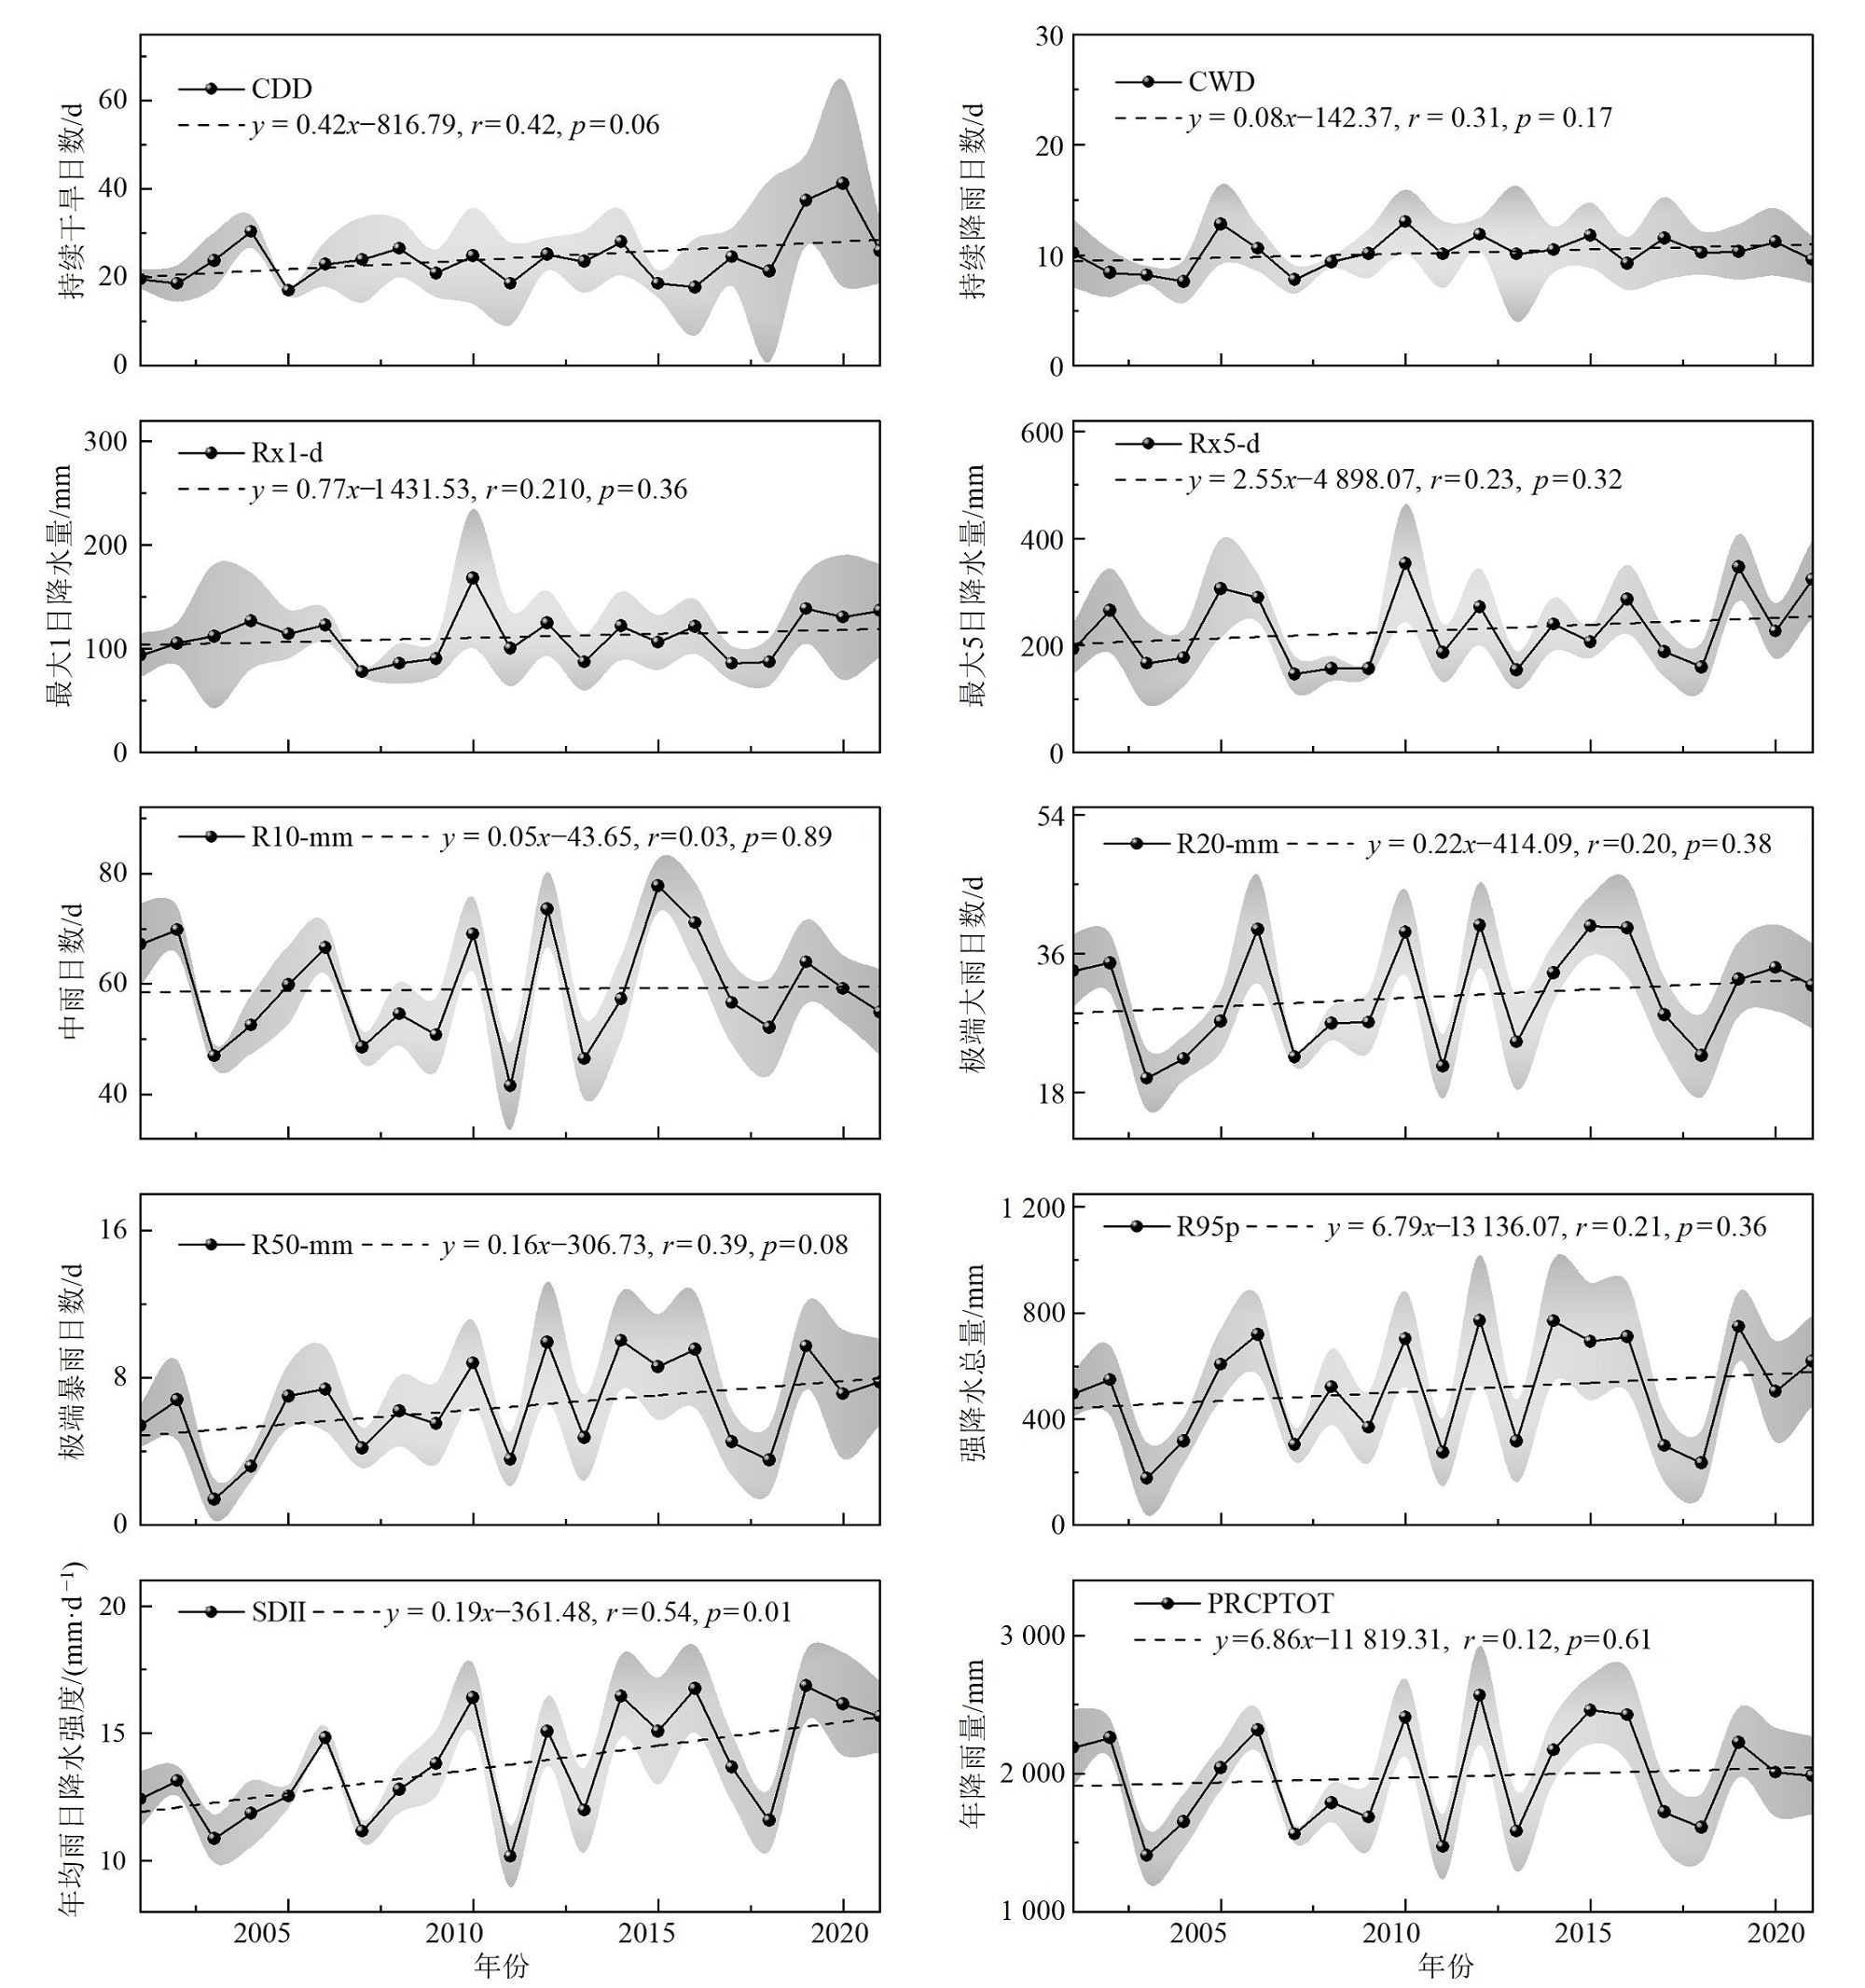
图5 2001-2021年极端降水指数的年际变化趋势 CDD:持续干旱日数;CWD:持续降水日数;Rx1-d:最大1日降水量;Rx5-d:最大5日降水量;R10-mm:中雨日数;R20-mm:极端大雨日数;R50-mm:极端暴雨日数;R95p:强降水总量;SDII:年均雨日降水强度;PRCPTOT:总降水量;图中虚线表示线性回归趋势,阴影区域则代表不同站点之间的标准偏差
Figure 5 Interannual variation trend of extreme precipitation indices from 2001 to 2021

图6 2001-2021年研究区极端降水指数年际倾向率的空间分布 CDD等极端降水指数的含义见图5注释。红色圆圈表示上升趋势,蓝色圆圈表示下降趋势。SN表示下降趋势(显著);SP表示上升趋势(显著)。显著性水平(p)设为0.05。圆圈大小表示变化程度
Figure 6 Spatial distribution of interannual trends of extreme precipitation indices in the studied area from 2001 to 2021
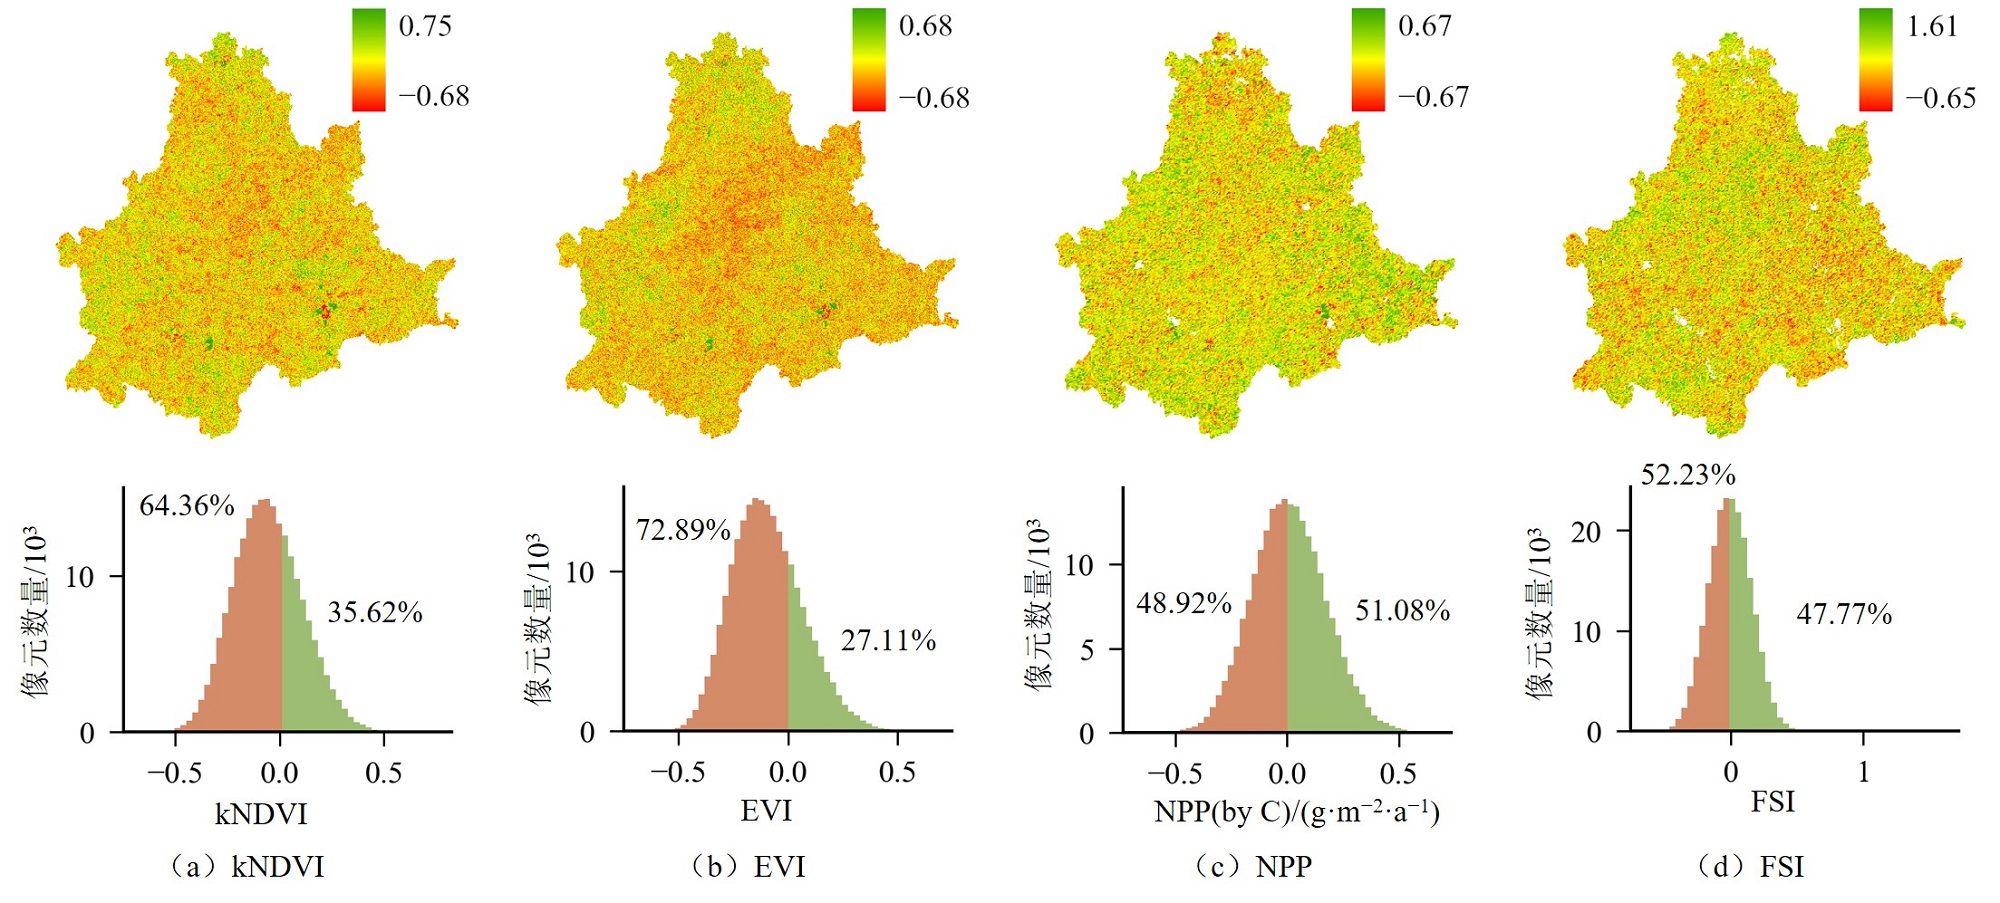
图7 2001-2021年期间kNDVI、EVI、NPP和FSI的标准化异常
Figure 7 Standardized anomalies of kNDVI, EVI, NPP, and FSI during 2001-2021
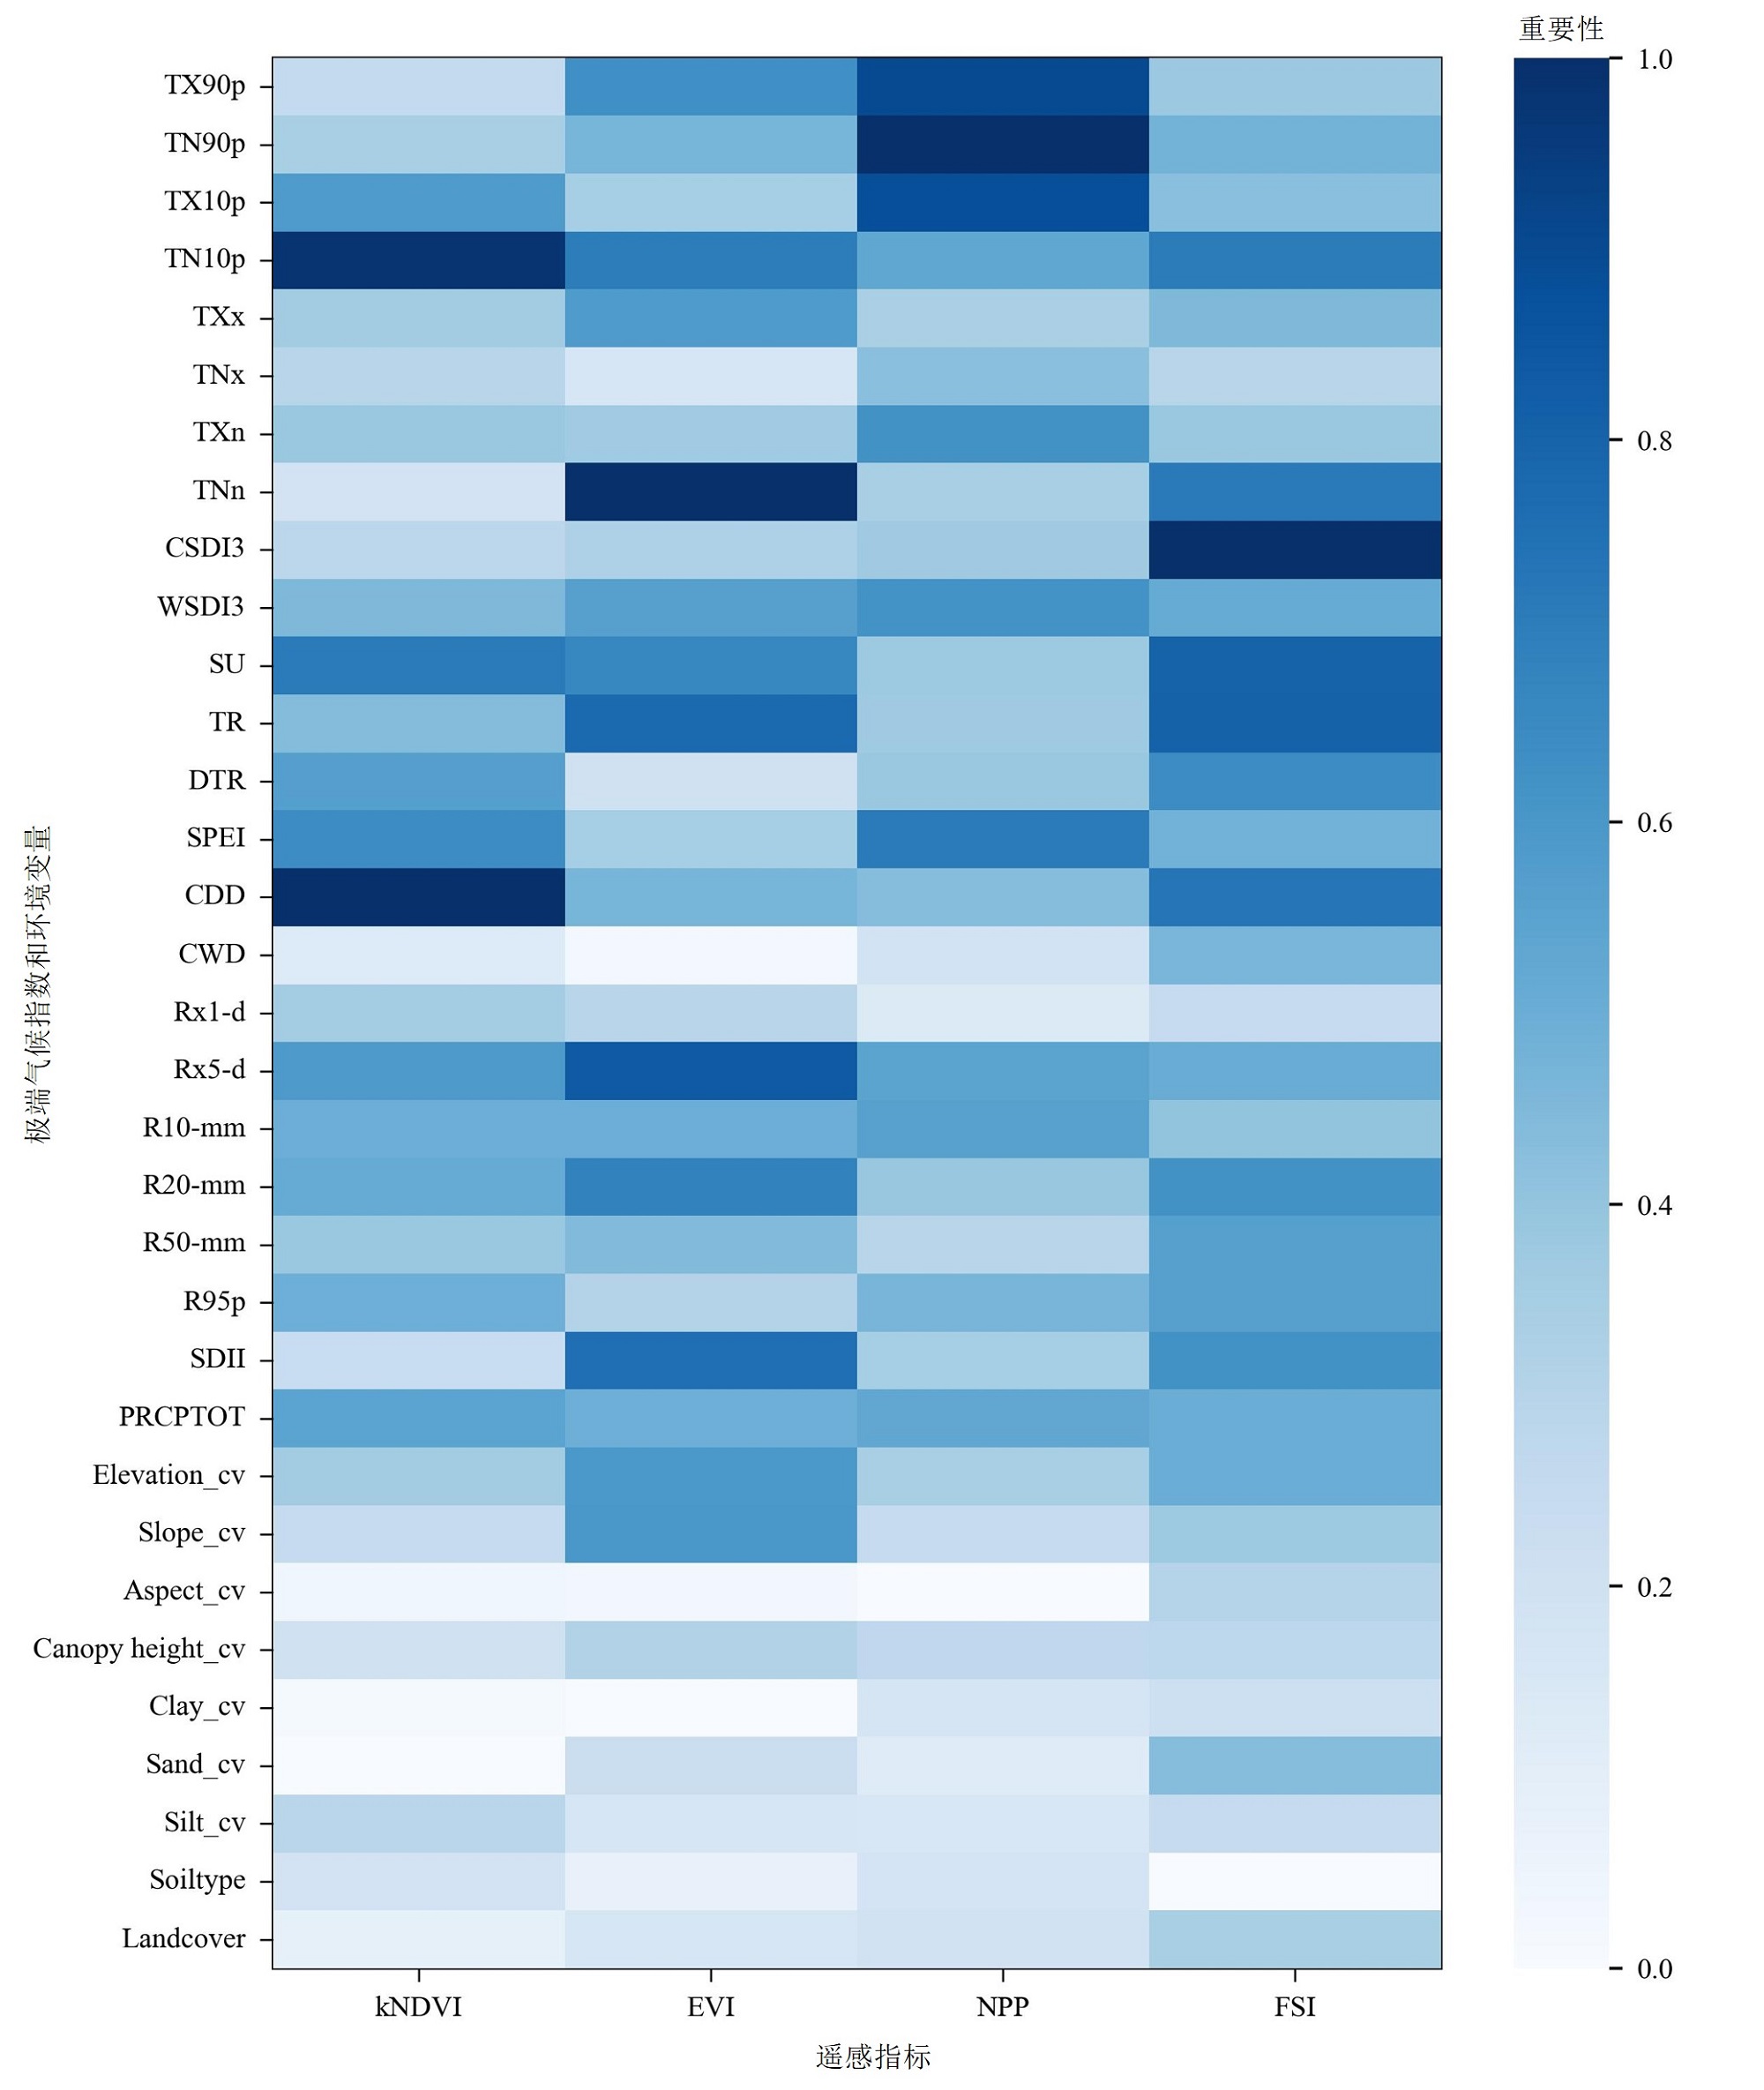
图8 基于随机森林模型的极端气候和环境变量重要性排序 TX90p等极端气候指数的含义见图3和图5注释。Elevation_cv;海拔变异性;Slope_cv:坡度变异性;Aspect_ev:坡向变异性;Canopy height_cv:冠层高度变异性;Clay_cv:黏土含量变异性;Sand_cv:砂土含量变异性;Silt_cv:粉砂土含量变异性;Soiltype:土壤类型;Landcover:土地覆盖类型。
Figure 8 Importance ranking of extreme climate and environmental variables based on the random forest model
| [1] | AFUYE G A, KALUMBA A M, ORIMOLOYE I R, 2021. Characterisation of vegetation response to climate change: A review[J]. Sustainability, 13(13): 7265. |
| [2] |
BARRIOPEDRO D, FISCHER E M, LUTERBACHER J, et al., 2011. The hot summer of 2010: Redrawing the temperature record map of Europe[J]. Science, 332(6026): 220-224.
DOI PMID |
| [3] | BI J, MYNENI R, LYAPUSTIN A, et al., 2016. Amazon forests’ response to droughts: A perspective from the MAIAC product[J]. Remote Sensing, 8(4): 356. |
| [4] | BREIMAN L, 2001. Random forests[J]. Machine Learning, 45: 5-32. |
| [5] | CEDDIA M B, VIEIRA S R, VILLELA A L O, et al., 2009. Topography and spatial variability of soil physical properties[J]. Scientia Agricola, 66(3): 338-352. |
| [6] | CHEN Y, LUO Y, MO W, et al., 2014. Differences between MODIS NDVI and MODIS EVI in response to climatic factors[J]. Journal of Natural Resources, 29(10): 1802-1812. |
| [7] | CHEN Y, WANG Y P, TANG X, et al., 2022. Temperature dependence of ecosystem carbon, nitrogen and phosphorus residence times differs between subtropical and temperate forests in China[J]. Agricultural and Forest Meteorology, 326: 109165. |
| [8] | CHRISTIDIS N, JONES G S, STOTT P A, 2015. Dramatically increasing chance of extremely hot summers since the 2003 European heatwave[J]. Nature Climate Change, 5(1): 46-50. |
| [9] | CHU H, VENEVSKY S, WU C, et al., 2018. NDVI-based vegetation dynamics and its response to climate changes at Amur-Heilongjiang River Basin from 1982 to 2015[J]. Science of the Total Environment, 650(P2): 2051-2062. |
| [10] | CIAIS P, REICHSTEIN M, VIOVY N, et al., 2005. Europe-wide reduction in primary productivity caused by the heat and drought in 2003[J]. Nature, 437(7058): 529-533. |
| [11] | CRAVE A, GASCUEL-ODOUX C, 1997. The influence of topography on time and space distribution of soil surface water content[J]. Hydrological Processes, 11(2): 203-210. |
| [12] | DE KAUWE M G, MEDLYN B E, PITMAN A J, et al., 2019. Examining the evidence for decoupling between photosynthesis and transpiration during heat extremes[J]. Biogeosciences, 16(4): 903-916. |
| [13] | DONAT M G, ALEXANDER L V, YANG H, et al., 2013a. Global land-based datasets for monitoring climatic extremes[J]. Bulletin of the American Meteorological Society, 94(7): 997-1006. |
| [14] | DONAT M G, ALEXANDER L V, YANG H, et al., 2013b. Updated analyses of temperature and precipitation extreme indices since the beginning of the twentieth century: The HadEX2 dataset[J]. Journal of Geophysical Research: Atmospheres, 118(5): 2098-2118. |
| [15] | GAO X, HUETE A R, NI W G, et al., 2000. Optical-biophysical relationships of vegetation spectra without background contamination[J]. Remote Sensing of Environment, 74(3): 609-620. |
| [16] | HAMERLYNCK E P, HUXMAN T E, LOIK M E, et al., 2000. Effects of extreme high temperature, drought and elevated CO2 on photosynthesis of the Mojave Desert evergreen shrub, Larrea tridentata[J]. Plant Ecology, 148: 183-193. |
| [17] | HE J, YANG M M, LIU J, et al., 2025. Impacts of vegetation greening and climate change on trend and interannual variability in vegetation productivity in the Wuyi Mountain region[J]. Geo-Spatial Information Science, 28(1): 224-245. |
| [18] | HUANG S, TANG L, HUPY J P, et al., 2021. A commentary review on the use of normalized difference vegetation index (NDVI) in the era of popular remote sensing[J]. Journal of Forestry Research, 32(1): 1-6. |
| [19] | IPCC, 2021. Climate change 2021: The physical science basis: Working group I contribution to the sixth assessment report of the intergovernmental panel on climate change[M]. Cambridge: Cambridge University Press. |
| [20] |
JUCKER T, HARDWICK S R, BOTH S, et al., 2018. Canopy structure and topography jointly constrain the microclimate of human-modified tropical landscapes[J]. Global Change Biology, 24(11): 5243-5258.
DOI PMID |
| [21] | KATZ R W, BROWN B G, 1992. Extreme events in a changing climate: variability is more important than averages[J]. Climatic Change, 21(3): 289-302. |
| [22] | KIM Y H, MIN S K, ZHANG X B, et al., 2016. Attribution of extreme temperature changes during 1951-2010[J]. Climate Dynamics, 46: 1769-1782. |
| [23] | LAMCHIN M, LEE W, JEON W S, et al., 2018. Long-term trend and correlation between vegetation greenness and climate variables in Asia based on satellite data[J]. Science of the Total Environment, 618: 1089-1095. |
| [24] | LANG N, JETZ W, SCHINDLER K, et al., 2023. A high-resolution canopy height model of the Earth[J]. Nature Ecology & Evolution, 7(11): 1778-1789. |
| [25] | LAVELL A, OPPENHEIMER M, DIOP C, et al., 2012. Managing the risks of extreme events and disasters to advance climate change adaptation[J]. A Special Report of Working Groups I and II of the Intergovernmental Panel on Climate Change (IPCC), 3: 25-64. |
| [26] | LI T Y, WANG S Q, CHEN B, et al., 2024. Widespread reduction in gross primary productivity caused by the compound heat and drought in Yangtze River Basin in 2022[J]. Environmental Research Letters, 19(3): 034048. |
| [27] | MILDREXLER D, YANG Z, COHEN W B, et al., 2016. A forest vulnerability index based on drought and high temperatures[J]. Remote Sensing of Environment, 173: 314-325. |
| [28] | PAPAGIANNOPOULOU C, MIRALLES D G, DECUBBER S, et al., 2017. A non-linear Granger-causality framework to investigate climate-vegetation dynamics[J]. Geoscientific Model Development, 10(5): 1945-1960. |
| [29] | PENG S Z, DING Y X, LIU W Z, LI Z, 2019. 1 km monthly temperature and precipitation dataset for China from 1901 to 2017[J]. Earth System Science Data, 11(4): 1931-1946. |
| [30] | PIAO S L, WANG X H, PARK T J, et al., 2020. Characteristics, drivers and feedbacks of global greening[J]. Nature Reviews Earth & Environment, 1(1): 14-27. |
| [31] | POTTER C S, KLOOSTER S, BROOKS V, 1999. Interannual variability in terrestrial net primary production: exploration of trends and controls on regional to global scales[J]. Ecosystems, 2: 36-48. |
| [32] | REN P X, LIU Z L, ZHOU X L, et al., 2021. Strong controls of daily minimum temperature on the autumn photosynthetic phenology of subtropical vegetation in China[J]. Forest Ecosystems, 8: 1-12. |
| [33] | SELLERS P J, 1985. Canopy reflectance, photosynthesis and transpiration[J]. International Journal of Remote Sensing, 6(8): 1335-1372. |
| [34] | SWENSON S, WAHR J, 2006. Estimating large-scale precipitation minus evapotranspiration from GRACE satellite gravity measurements[J]. Journal of Hydrometeorology, 7(2): 252-270. |
| [35] | WANG Q, MORENO-MARTÍNEZ Á, MUÑOZ-MARÍ J, et al., 2023. Estimation of vegetation traits with kernel NDVI[J]. ISPRS Journal of Photogrammetry and Remote Sensing, 195: 408-417. |
| [36] | XU X, JIANG H L, GUAN M X, et al., 2020. Vegetation responses to extreme climatic indices in coastal China from 1986 to 2015[J]. Science of the Total Environment, 744: 140784. |
| [37] | YUAN M S, ZHU Q, ZHANG J, et al., 2021. Global response of terrestrial gross primary productivity to climate extremes[J]. Science of the Total Environment, 750: 142337. |
| [38] | ZHANG K, KIMBALL J S, MU Q Z, et al., 2009. Satellite based analysis of northern ET trends and associated changes in the regional water balance from 1983 to 2005[J]. Journal of Hydrology, 379(1-2): 92-110. |
| [39] | ZHANG W J, WANG H M, YANG F T, et al., 2011. Underestimated effects of low temperature during early growing season on carbon sequestration of a subtropical coniferous plantation[J]. Biogeosciences, 8(6): 1667-1678. |
| [40] | ZHANG X, LIU L Y, CHEN X D, et al., 2020. GLC_FCS30: Global land-cover product with fine classification system at 30 m using time-series Landsat imagery[J]. Earth System Science Data Discussions, 13(6): 2753-2776. |
| [41] | 陈琦, 毛方杰, 杜华强, 等, 2022. 中国亚热带极端降水时空演变及其对潜在净初级生产力的影响[J]. 生态学杂志, 41(11): 2117-2127. |
|
CHEN Q, MAO F J, DU H Q, et al., 2022. Spatiotemporal variations of subtropical extreme precipitation and its influence on potential net primary productivity in China[J]. Chinese Journal of Ecology, 41(11): 2117-2127.
DOI |
|
| [42] |
陈文裕, 夏丽华, 徐国良, 等, 2022. 2000-2020年珠江流域NDVI动态变化及影响因素研究[J]. 生态环境学报, 31(7): 1306-1316.
DOI |
| CHEN W Y, XIA L H, XU G L, et al., 2022. Dynamic variation of NDVI and its influencing factors in the Pearl River Basin from 2000 to 2020[J]. Ecology and Environmental Sciences, 31(7): 1306-1316. | |
| [43] | 贾朝阳, 2023. 松花江流域NPP时空演变及其极端气候响应研究[D]. 哈尔滨: 东北农业大学. |
| JIA Z Y, 2023. Spatio-temporal evolution of net primary productivity and its response to extreme climate in Songhua River Basin[D]. Harbin: Northeast Agricultural University. | |
| [44] |
焦鹏华, 牛健植, 苗禹博, 等, 2024. 2001-2020 年全球植被对极端气候的响应[J]. 应用生态学报, 35(11): 2992-3004.
DOI |
|
JIAO P H, NIU J Z, MIAO Y B, et al., 2024. Global vegetation response to extreme climate from 2001 to 2020[J]. Chinese Journal of Applied Ecology, 35(11): 2992-3004.
DOI |
|
| [45] | 李韵婕, 2014. 中国西南地区区域性气象干旱事件的特征及成因诊断[D]. 南京: 南京信息工程大学. |
| LI Y J, 2014. Study on the Characteristics and causes of the southwest China regional meteorological drought events[D]. Nanjing: Nanjing University of Information Science & Technology. | |
| [46] | 廖廓, 曾瑾瑜, 王金萍, 等, 2014. 福建春季雷暴天气分析及灾害预测[J]. 闽江学院学报, 35(5): 119-125. |
| LIAO K, ZENG J Y, WANG J P, et al., 2014. Thunderstorm weather analysis and disaster warning in spring in Fujian[J]. Journal of Minjiang University, 35(5): 119-125. | |
| [47] | 马楠, 白涛, 蔡朝朝, 2024. 2000-2021年新疆植被覆盖度变化及驱动力[J]. 水土保持研究, 31(1): 385-394. |
| MA N, BAI T, CAI Z Z, 2024. Vegetation cover change and its response to climate and surface factors in Xinjiang based on different vegetation types[J]. Research of Soil and Water Conservation, 31(1): 385-394. | |
| [48] | 吴欣宇, 朱秀芳, 2023. 中国不同植被区对极端气候的响应差异[J]. 生态学报, 43(24): 10202-10215. |
| WU X Y, ZHU X F, 2023. Differential analysis of vegetation response to extreme climate in different vegetation regions of China[J]. Acta Ecologica Sinica, 43(24): 10202-10215. |
| [1] | 丁馨, 刘健, 魏俐宏, 解德威, 郑昭佩. 基于GSMSR模型的山东省植被NEP时空格局及影响因素[J]. 生态环境学报, 2025, 34(7): 1079-1089. |
| [2] | 祁珣, 冯鑫鑫, 陈颖军, 冯艳丽, 陈田, 李军, 张干. 轻型汽油卡车尾气颗粒物中氨和有机胺的排放特征及影响因素[J]. 生态环境学报, 2025, 34(7): 997-1006. |
| [3] | 张亚丽, 黄柱军, 田义超, 林俊良, 覃彩焕. 极端气候对西南地区植被覆盖度变化的时滞与累积效应[J]. 生态环境学报, 2025, 34(5): 665-677. |
| [4] | 张丹丹, 毋振海, 吴渴, 毕方, 李云凤, 安聪, 韩翼昕, 刘正阳, 朱玲, 王学中. 基于不同类型臭氧污染日的臭氧污染特征及影响因素分析:以亳州市为例[J]. 生态环境学报, 2025, 34(5): 720-730. |
| [5] | 郭欣达, 付奔, 余思洁, 侯鹰, 陈卫平. 城市内涝和夏季高温风险评价与优先管控区识别方法研究[J]. 生态环境学报, 2025, 34(5): 731-742. |
| [6] | 陈鹏, 马育军, 张梦雅, 陈婉婷, 江晓鹏. 基于kNDVI的广东省植被动态变化分析[J]. 生态环境学报, 2025, 34(4): 499-510. |
| [7] | 郭铭彬, 龚建周, 王丽娟, 王时宽. 2019-2023年粤港澳大湾区NO2浓度变化的自然主控因子解析[J]. 生态环境学报, 2025, 34(4): 534-547. |
| [8] | 蒋存征, 陈安强, 胡万里, 付斌, 朱林立, 刘云娥, 黎明琦, 王炽, 张丹. 异龙湖区浅层地下水NO3−-N浓度时空变化及其来源解析[J]. 生态环境学报, 2025, 34(4): 570-580. |
| [9] | 郭昭, 师芸, 刘铁铭, 张雨欣, 闫永智. 2001-2020年秦岭北麓NPP时空格局及驱动因素分析[J]. 生态环境学报, 2025, 34(3): 401-410. |
| [10] | 赵乐鋆, 王诗瑶, 赵子渝, 洪星, 李夫星, 吴佳仪, 华婧妤. 2008-2022年华北平原七省市AOD时空变化特征及主要影响因素分析[J]. 生态环境学报, 2025, 34(2): 256-267. |
| [11] | 侯金龙, 马志强, 杨澄, 葛双双, 何迪, 董璠. 京津冀地区植被碳源/汇的时空变化特征及影响因素分析[J]. 生态环境学报, 2024, 33(9): 1329-1338. |
| [12] | 李建付, 黄志霖, 和成忠, 姜昕, 宋琳, 刘佳鑫, 陈利顶. 滇东喀斯特断陷盆地土壤有机碳空间分布特征及其关键影响因子[J]. 生态环境学报, 2024, 33(9): 1339-1352. |
| [13] | 王捷纯, 邓玉娇, 朱怀卫, 孔蕴淇. 广东省不同生态系统植被NPP时空变化及对气候因子的响应[J]. 生态环境学报, 2024, 33(6): 831-840. |
| [14] | 陈晓辉, 胡喜生. 耦合ER和GWR的福州市生态环境质量的驱动力分析[J]. 生态环境学报, 2024, 33(5): 812-823. |
| [15] | 张淼, 王桂霞, 王昌伟, 贺艳云, 许艳芳, 李琪, 许杨, 张俊骁, 张桂芹. 济南市区黑碳污染变化特征及来源解析[J]. 生态环境学报, 2024, 33(4): 560-572. |
| 阅读次数 | ||||||
|
全文 |
|
|||||
|
摘要 |
|
|||||