生态环境学报 ›› 2021, Vol. 30 ›› Issue (12): 2351-2359.DOI: 10.16258/j.cnki.1674-5906.2021.12.010
马琼芳1( ), 燕红1, 李伟2, 赵欣胜2, 陈玲1, 张超凡1, 李杰玲1,*()
收稿日期:2021-02-21
出版日期:2021-12-18
发布日期:2022-01-04
通讯作者:
*E-mail: 157602108@qq.com作者简介:马琼芳(1984年),女,副研究员,博士,研究方向为湿地生态学。E-mail: youzi841128@163.com
基金资助:
MA Qiongfang1(), YAN Hong1, LI Wei2, ZHAO Xinsheng2, CHEN Ling1, ZHANG Chaofan1, LI Jieling1,*()
Received:2021-02-21
Online:2021-12-18
Published:2022-01-04
摘要:
固碳释氧是湿地最重要的生态系统服务之一。为了科学评估吉林省湿地生态系统固碳和释氧能力,以更好地保护湿地,采用实测生物量数据、湿地小班数据、TM遥感数据及相关统计数据,通过遥感反演、碳税价值法、市场价值法等方法进行估算,评估吉林省湿地生态系统固碳和释氧的服务功能。结果表明,吉林省湿地生态系统年固碳量为87.09×10⁴ t,年释氧量为35.97×10⁴ t,表现为较强的碳汇。各地区年固碳释氧能力以白城市和松原市较高,辽源市、通化市及四平市湿地年固碳释氧能力相对较低。在各湿地类型中,沼泽湿地年固碳量和年释氧量最高,分别为54.39×10⁴ t和20.15×10⁴ t;河流湿地年固碳量和年释氧量分别为17.62×10⁴ t和8.52×10⁴ t;人工湿地年固碳量和年释氧量分别为8.33×10⁴ t和4.48×10⁴ t,湖泊湿地年固碳量和年释氧量最小,分别为6.75×10⁴ t和2.82×10⁴ t。吉林省湿地年固碳释氧价值为105.5亿元,其中固碳价值为71.38亿元,释氧价值为34.12亿元。与第一次评估相比,吉林省湿地固碳释氧功能呈增加的趋势,西部地区湿地贡献率较大,其中季节性咸水沼泽和内陆盐沼固碳量和释氧量增加最为明显,湿地保护与恢复项目的建设和各大水利工程的实施可能是西部地区湿地固碳释氧能力增加的主要原因。继续加强对吉林省湿地的保护,有利于湿地生态系统充分发挥调节大气组分的能力。
中图分类号:
马琼芳, 燕红, 李伟, 赵欣胜, 陈玲, 张超凡, 李杰玲. 吉林省湿地生态系统固碳和释氧服务功能分析[J]. 生态环境学报, 2021, 30(12): 2351-2359.
MA Qiongfang, YAN Hong, LI Wei, ZHAO Xinsheng, CHEN Ling, ZHANG Chaofan, LI Jieling. Evaluation of Carbon Sequestration and Oxygen Release Function of Wetland Ecosystem in Jilin Province[J]. Ecology and Environment, 2021, 30(12): 2351-2359.
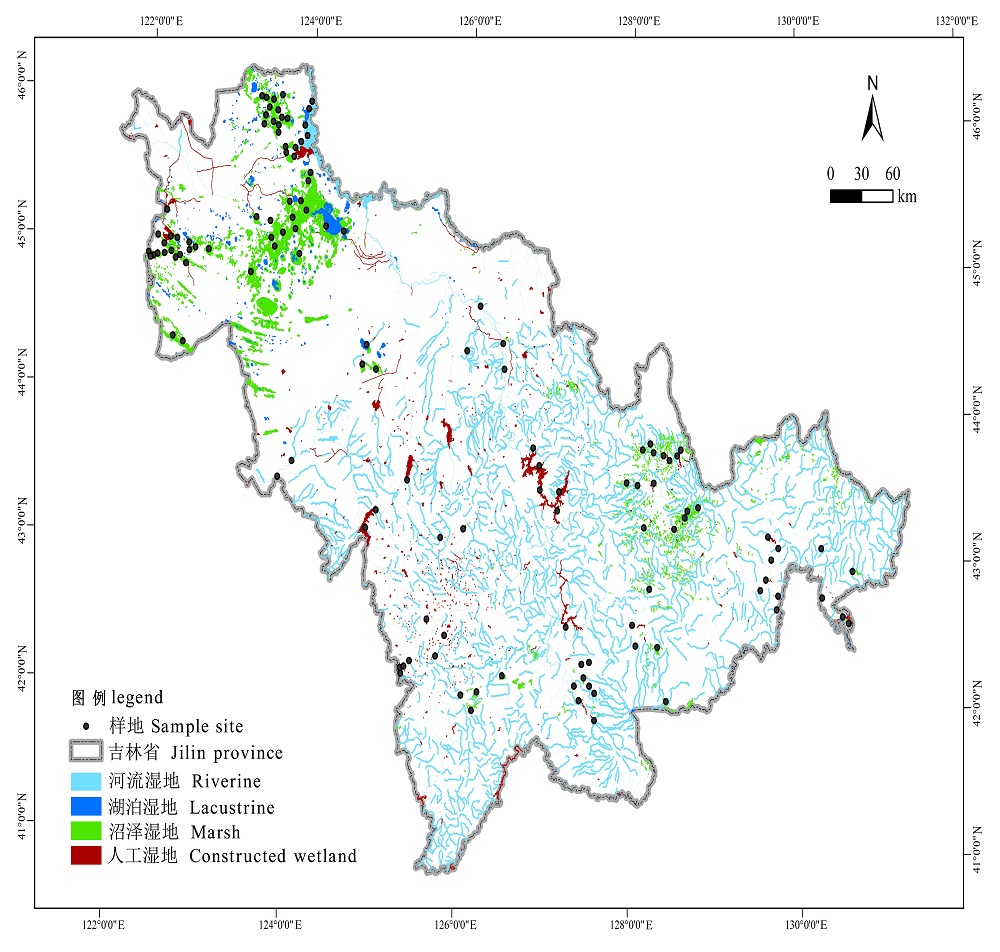
图1 研究区样地分布图
Fig. 1 Spatial distribution of sampling sites in study area
| 序号 Serial number | 模型 Model | 复相关系数R Multiple correlation coefficient | 显著性 Significance | 相对误差 Relative error/% |
|---|---|---|---|---|
| 1 | B=591.467+ 77.529lnNDVI | 0.162 | 0.067 | 19.15 |
| 2 | B=482.968- 3.852/NDVI | 0.096 | 0.281 | 34.26 |
| 3 | lnB=EXP(5.987- 0.01/NDVI) | 0.106 | 0.23 | 35.73 |
| 4 | ln(1/B)=0.282 NDVI+0.003S | 0.167 | 0.059 | 15.24 |
| 5 | B=314.635+ 744.716NDVI | 0.323 | 0.011 | 10.15 |
| 6 | B=531.916- 706890/b2 | 0.025 | 0.78 | 66.43 |
| 7 | B=0.013b3+ 338.545 | 0.05 | 0.573 | 34.29 |
| 8 | lnB=lnb3+61.038 | 0.034 | 0.706 | 50.36 |
| 9 | B=760.165NDVI+0.041b3-0.01b4+ 28.782 | 0.247 | 0.048 | 21.47 |
| 10 | B=612.231- 17.389lnb4 | 0.01 | 0.914 | 67.54 |
| 11 | lnB=322.601b4 | 0.032 | 0.72 | 58.31 |
表1 生物量回归模型及相关统计量
Table 1 Biomass estimation model and related statistics
| 序号 Serial number | 模型 Model | 复相关系数R Multiple correlation coefficient | 显著性 Significance | 相对误差 Relative error/% |
|---|---|---|---|---|
| 1 | B=591.467+ 77.529lnNDVI | 0.162 | 0.067 | 19.15 |
| 2 | B=482.968- 3.852/NDVI | 0.096 | 0.281 | 34.26 |
| 3 | lnB=EXP(5.987- 0.01/NDVI) | 0.106 | 0.23 | 35.73 |
| 4 | ln(1/B)=0.282 NDVI+0.003S | 0.167 | 0.059 | 15.24 |
| 5 | B=314.635+ 744.716NDVI | 0.323 | 0.011 | 10.15 |
| 6 | B=531.916- 706890/b2 | 0.025 | 0.78 | 66.43 |
| 7 | B=0.013b3+ 338.545 | 0.05 | 0.573 | 34.29 |
| 8 | lnB=lnb3+61.038 | 0.034 | 0.706 | 50.36 |
| 9 | B=760.165NDVI+0.041b3-0.01b4+ 28.782 | 0.247 | 0.048 | 21.47 |
| 10 | B=612.231- 17.389lnb4 | 0.01 | 0.914 | 67.54 |
| 11 | lnB=322.601b4 | 0.032 | 0.72 | 58.31 |
| 功能项 Function item | 河流 湿地 Riverine | 湖泊 湿地 Lacustrine | 沼泽 湿地 Marsh | 人工湿地 Constructed wetland | 总计 Total |
|---|---|---|---|---|---|
| 固碳量 Carbon sequestration/ (104 t) | 17.62 | 6.75 | 54.39 | 8.33 | 87.09 |
| 释氧量 Oxygen release/(104 t) | 8.52 | 2.82 | 20.15 | 4.48 | 35.97 |
表2 吉林省各湿地类型年固碳量和年释氧量
Table 2 Annual carbon sequestration and annual oxygen release of each wetland type in Jilin Province
| 功能项 Function item | 河流 湿地 Riverine | 湖泊 湿地 Lacustrine | 沼泽 湿地 Marsh | 人工湿地 Constructed wetland | 总计 Total |
|---|---|---|---|---|---|
| 固碳量 Carbon sequestration/ (104 t) | 17.62 | 6.75 | 54.39 | 8.33 | 87.09 |
| 释氧量 Oxygen release/(104 t) | 8.52 | 2.82 | 20.15 | 4.48 | 35.97 |
| 湿地类型 Wetland types | 固碳量 Carbon sequestration/ (104 t) | 单位面积固碳量 Carbon sequestration per unit area/(t·hm-2) | 释氧量 Oxygen release/ (104 t) | 单位面积释氧量 Oxygen release per unit area/ (t·hm-2) | 固碳释氧量 Carbon sequestration and oxygen release/(104 t) | 单位面积固碳释氧量 Carbon sequestration and oxygen release per unit area/(t·hm-2) | |
|---|---|---|---|---|---|---|---|
| 河流湿地 Riverine | 永久性河流 Permanent river | 13.42 | 0.80 | 6.48 | 0.39 | 19.90 | 1.19 |
| 季节性河流 Seasonal river | 0.56 | 0.97 | 0.24 | 0.42 | 0.80 | 1.39 | |
| 洪泛平原湿地 Flood plain wetland | 3.64 | 0.73 | 1.8 | 0.36 | 5.44 | 1.09 | |
| 湖泊湿地 Lacustrine | 永久性淡水湖 Permanent freshwater lake | 2.99 | 0.56 | 1.28 | 0.24 | 4.27 | 0.80 |
| 永久性咸水湖 Permanent saltwater lake | 3.33 | 0.65 | 1.36 | 0.27 | 4.69 | 0.92 | |
| 季节性咸水湖 Seasonal saltwater lake | 0.43 | 0.62 | 0.18 | 0.26 | 0.61 | 0.88 | |
| 沼泽湿地 Marsh | 草本沼泽 Marsh | 8.23 | 1.08 | 2.81 | 0.37 | 11.04 | 1.45 |
| 灌丛沼泽 Swamp | 2.26 | 1.12 | 0.78 | 0.39 | 3.04 | 1.51 | |
| 森林沼泽 Forest swamp | 3.41 | 1.18 | 1.34 | 0.46 | 4.75 | 1.64 | |
| 内陆盐沼 Inland salt marsh | 10.83 | 0.97 | 4.69 | 0.42 | 15.52 | 1.39 | |
| 季节性咸水沼泽 Seasonal saltwater swamp | 24.67 | 1.00 | 8.98 | 0.36 | 33.65 | 1.36 | |
| 沼泽化草甸 Swamp meadow | 4.99 | 1.17 | 1.55 | 0.36 | 6.54 | 1.53 | |
| 人工湿地 Constructed wetland | 库塘 Pond | 7.96 | 0.62 | 4.35 | 0.34 | 12.31 | 0.96 |
| 输水河 Water river | 0.29 | 0.72 | 0.09 | 0.22 | 0.38 | 0.94 | |
| 水产养殖场 Aquaculture farm | 0.08 | 0.51 | 0.04 | 0.26 | 0.12 | 0.77 | |
| 总计 Total | 87.09 | 35.97 | 123.06 | ||||
表3 吉林省各湿地类型年固碳量和年释氧量
Table 3 Annual carbon sequestration and annual oxygen release of each wetland type in Jilin Province
| 湿地类型 Wetland types | 固碳量 Carbon sequestration/ (104 t) | 单位面积固碳量 Carbon sequestration per unit area/(t·hm-2) | 释氧量 Oxygen release/ (104 t) | 单位面积释氧量 Oxygen release per unit area/ (t·hm-2) | 固碳释氧量 Carbon sequestration and oxygen release/(104 t) | 单位面积固碳释氧量 Carbon sequestration and oxygen release per unit area/(t·hm-2) | |
|---|---|---|---|---|---|---|---|
| 河流湿地 Riverine | 永久性河流 Permanent river | 13.42 | 0.80 | 6.48 | 0.39 | 19.90 | 1.19 |
| 季节性河流 Seasonal river | 0.56 | 0.97 | 0.24 | 0.42 | 0.80 | 1.39 | |
| 洪泛平原湿地 Flood plain wetland | 3.64 | 0.73 | 1.8 | 0.36 | 5.44 | 1.09 | |
| 湖泊湿地 Lacustrine | 永久性淡水湖 Permanent freshwater lake | 2.99 | 0.56 | 1.28 | 0.24 | 4.27 | 0.80 |
| 永久性咸水湖 Permanent saltwater lake | 3.33 | 0.65 | 1.36 | 0.27 | 4.69 | 0.92 | |
| 季节性咸水湖 Seasonal saltwater lake | 0.43 | 0.62 | 0.18 | 0.26 | 0.61 | 0.88 | |
| 沼泽湿地 Marsh | 草本沼泽 Marsh | 8.23 | 1.08 | 2.81 | 0.37 | 11.04 | 1.45 |
| 灌丛沼泽 Swamp | 2.26 | 1.12 | 0.78 | 0.39 | 3.04 | 1.51 | |
| 森林沼泽 Forest swamp | 3.41 | 1.18 | 1.34 | 0.46 | 4.75 | 1.64 | |
| 内陆盐沼 Inland salt marsh | 10.83 | 0.97 | 4.69 | 0.42 | 15.52 | 1.39 | |
| 季节性咸水沼泽 Seasonal saltwater swamp | 24.67 | 1.00 | 8.98 | 0.36 | 33.65 | 1.36 | |
| 沼泽化草甸 Swamp meadow | 4.99 | 1.17 | 1.55 | 0.36 | 6.54 | 1.53 | |
| 人工湿地 Constructed wetland | 库塘 Pond | 7.96 | 0.62 | 4.35 | 0.34 | 12.31 | 0.96 |
| 输水河 Water river | 0.29 | 0.72 | 0.09 | 0.22 | 0.38 | 0.94 | |
| 水产养殖场 Aquaculture farm | 0.08 | 0.51 | 0.04 | 0.26 | 0.12 | 0.77 | |
| 总计 Total | 87.09 | 35.97 | 123.06 | ||||
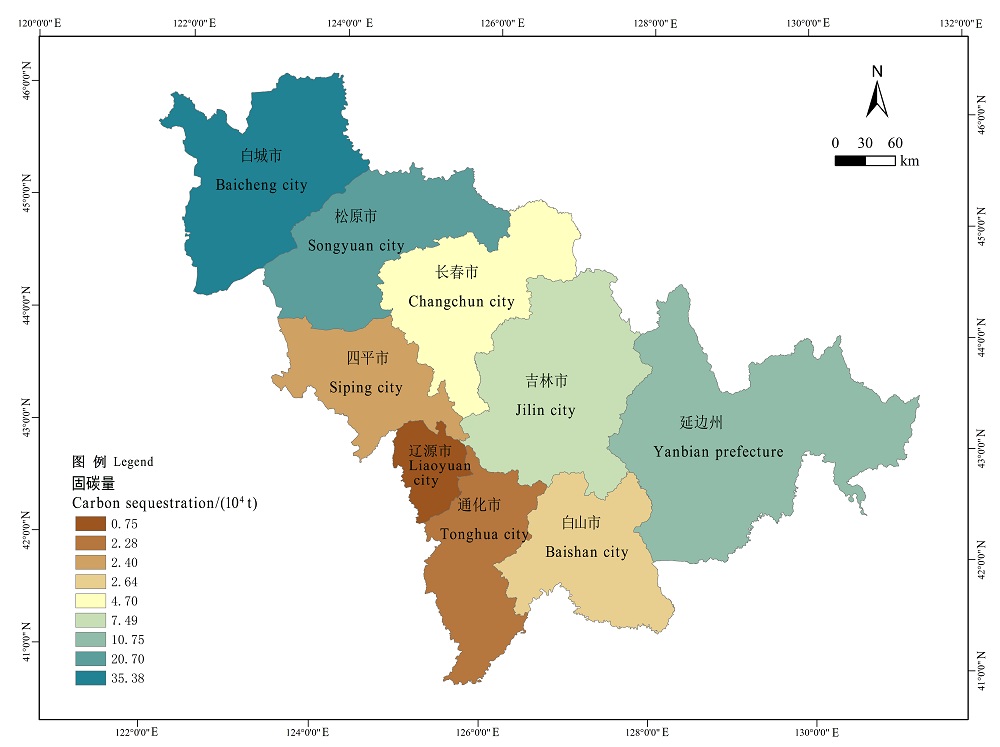
图2 吉林省各行政区湿地年固碳量
Fig. 2 Annual carbon sequestration of wetlands in each administrative district of Jilin Province
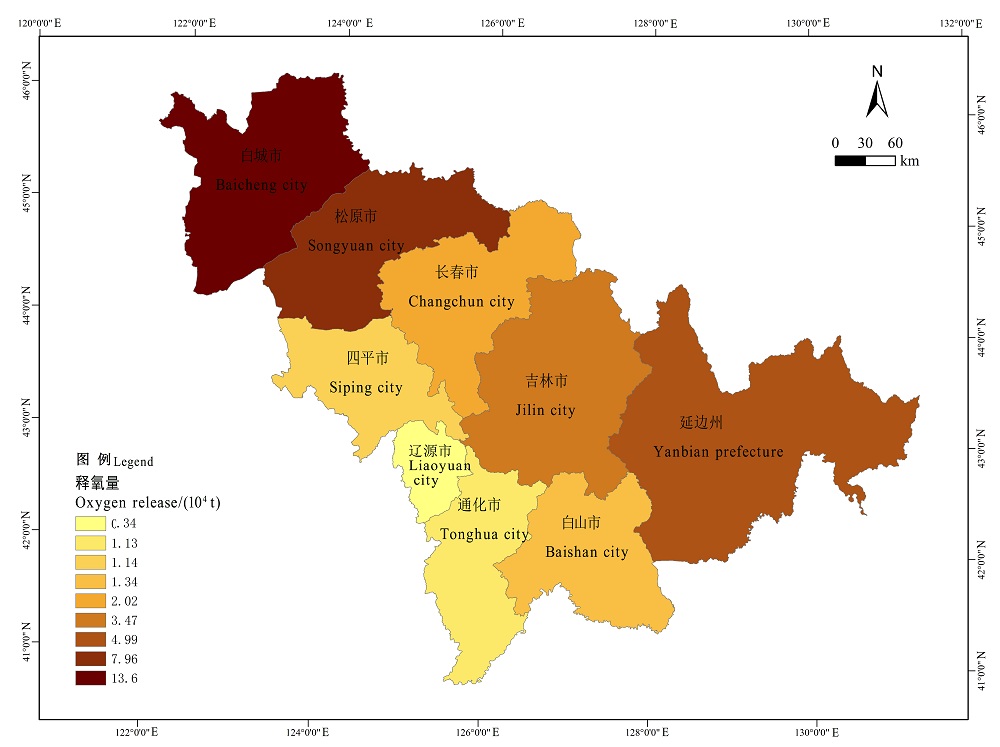
图3 吉林省各行政区湿地释氧量
Fig. 3 Amount of oxygen released from wetlands in each administrative district of Jilin Province
| 湿地类型 Wetland types | 固碳量 Carbon sequestration/(104 t) | 释氧量 Oxygen release/(104 t) | ||||||
|---|---|---|---|---|---|---|---|---|
| 第一次 First evaluation | 第二次 Second evaluation | 变化量 Amount of change | 第一次 First evaluation | 第二次 Second evaluation | 变化量 Amount of change | |||
| 河流湿地 Riverine | 永久性河流 Permanent river | 7.00 | 13.42 | 6.42 | 2.48 | 6.48 | 4.00 | |
| 季节性河流 Seasonal river | 0.24 | 0.56 | 0.32 | 0.10 | 0.24 | 0.14 | ||
| 洪泛平原湿地 Flood plain wetland | 1.31 | 3.64 | 2.33 | 0.54 | 1.80 | 1.26 | ||
| 湖泊湿地 Lacustrine | 永久性淡水湖 Permanent freshwater lake | 1.03 | 2.99 | 1.96 | 0.42 | 1.28 | 0.86 | |
| 永久性咸水湖 Permanent saltwater lake | 1.13 | 3.33 | 2.20 | 0.47 | 1.36 | 0.89 | ||
| 季节性咸水湖 Seasonal saltwater lake | 0.19 | 0.43 | 0.24 | 0.08 | 0.18 | 0.10 | ||
| 沼泽湿地 Marsh | 草本沼泽 Marsh | 2.45 | 8.23 | 5.78 | 1.76 | 2.81 | 1.05 | |
| 灌丛沼泽 Swamp | 0.74 | 2.26 | 1.52 | 0.30 | 0.78 | 0.48 | ||
| 森林沼泽 Forest swamp | 1.15 | 3.41 | 2.26 | 0.47 | 1.34 | 0.87 | ||
| 内陆盐沼 Inland salt marsh | 2.42 | 10.83 | 8.41 | 1.16 | 4.69 | 3.53 | ||
| 季节性咸水沼泽 Seasonal saltwater swamp | 7.21 | 24.67 | 17.46 | 2.48 | 8.98 | 6.50 | ||
| 沼泽化草甸 Swamp meadow | 1.58 | 4.99 | 3.41 | 0.65 | 1.55 | 0.90 | ||
| 人工湿地 Artificial wetland | 库塘 Pond | 2.98 | 7.96 | 4.98 | 1.23 | 4.35 | 3.12 | |
| 输水河 Water river | 0.13 | 0.29 | 0.16 | 0.06 | 0.09 | 0.03 | ||
| 水产养殖场 Aquaculture farm | 0.04 | 0.08 | 0.04 | 0.02 | 0.04 | 0.02 | ||
| 总计 Total | 29.59 | 87.09 | 57.50 | 12.22 | 35.97 | 23.75 | ||
表4 吉林省各湿地类型年固碳量和年释氧量变化
Table 4 Change in annual carbon sequestration and annual oxygen release of each wetland type in Jilin Province
| 湿地类型 Wetland types | 固碳量 Carbon sequestration/(104 t) | 释氧量 Oxygen release/(104 t) | ||||||
|---|---|---|---|---|---|---|---|---|
| 第一次 First evaluation | 第二次 Second evaluation | 变化量 Amount of change | 第一次 First evaluation | 第二次 Second evaluation | 变化量 Amount of change | |||
| 河流湿地 Riverine | 永久性河流 Permanent river | 7.00 | 13.42 | 6.42 | 2.48 | 6.48 | 4.00 | |
| 季节性河流 Seasonal river | 0.24 | 0.56 | 0.32 | 0.10 | 0.24 | 0.14 | ||
| 洪泛平原湿地 Flood plain wetland | 1.31 | 3.64 | 2.33 | 0.54 | 1.80 | 1.26 | ||
| 湖泊湿地 Lacustrine | 永久性淡水湖 Permanent freshwater lake | 1.03 | 2.99 | 1.96 | 0.42 | 1.28 | 0.86 | |
| 永久性咸水湖 Permanent saltwater lake | 1.13 | 3.33 | 2.20 | 0.47 | 1.36 | 0.89 | ||
| 季节性咸水湖 Seasonal saltwater lake | 0.19 | 0.43 | 0.24 | 0.08 | 0.18 | 0.10 | ||
| 沼泽湿地 Marsh | 草本沼泽 Marsh | 2.45 | 8.23 | 5.78 | 1.76 | 2.81 | 1.05 | |
| 灌丛沼泽 Swamp | 0.74 | 2.26 | 1.52 | 0.30 | 0.78 | 0.48 | ||
| 森林沼泽 Forest swamp | 1.15 | 3.41 | 2.26 | 0.47 | 1.34 | 0.87 | ||
| 内陆盐沼 Inland salt marsh | 2.42 | 10.83 | 8.41 | 1.16 | 4.69 | 3.53 | ||
| 季节性咸水沼泽 Seasonal saltwater swamp | 7.21 | 24.67 | 17.46 | 2.48 | 8.98 | 6.50 | ||
| 沼泽化草甸 Swamp meadow | 1.58 | 4.99 | 3.41 | 0.65 | 1.55 | 0.90 | ||
| 人工湿地 Artificial wetland | 库塘 Pond | 2.98 | 7.96 | 4.98 | 1.23 | 4.35 | 3.12 | |
| 输水河 Water river | 0.13 | 0.29 | 0.16 | 0.06 | 0.09 | 0.03 | ||
| 水产养殖场 Aquaculture farm | 0.04 | 0.08 | 0.04 | 0.02 | 0.04 | 0.02 | ||
| 总计 Total | 29.59 | 87.09 | 57.50 | 12.22 | 35.97 | 23.75 | ||
| 地区 Administrative region | 固碳量 Carbon sequestration/104 t | 释氧量 Oxygen release/104 t | |||||
|---|---|---|---|---|---|---|---|
| 第一次 First evaluation | 第二次 Second evaluation | 变化量 Amount of change | 第一次 First evaluation | 第二次 Second evaluation | 变化量 Amount of change | ||
| 白城市 Baicheng City | 12.02 | 35.38 | 23.36 | 4.62 | 13.60 | 8.98 | |
| 白山市 Baishan City | 0.90 | 2.64 | 1.74 | 0.45 | 1.34 | 0.88 | |
| 长春市 Changchun City | 1.60 | 4.70 | 3.10 | 0.69 | 2.02 | 1.33 | |
| 吉林市 Jilin City | 2.55 | 7.49 | 4.95 | 1.18 | 3.47 | 2.29 | |
| 辽源市 Liaoyuan City | 0.25 | 0.75 | 0.49 | 0.11 | 0.34 | 0.22 | |
| 四平市 Siping City | 0.82 | 2.40 | 1.58 | 0.39 | 1.14 | 0.75 | |
| 松原市 Songyuan City | 7.03 | 20.70 | 13.66 | 2.70 | 7.96 | 5.25 | |
| 通化市 Tonghua City | 0.78 | 2.28 | 1.51 | 0.38 | 1.13 | 0.74 | |
| 延边州 Yanbian Prefecture | 3.65 | 10.75 | 7.10 | 1.70 | 4.99 | 3.30 | |
表5 吉林省各行政区湿地年固碳量和年释氧量变化
Table 5 Change in annual carbon sequestration and annual oxygen release of wetlands in each administrative district of Jilin Province
| 地区 Administrative region | 固碳量 Carbon sequestration/104 t | 释氧量 Oxygen release/104 t | |||||
|---|---|---|---|---|---|---|---|
| 第一次 First evaluation | 第二次 Second evaluation | 变化量 Amount of change | 第一次 First evaluation | 第二次 Second evaluation | 变化量 Amount of change | ||
| 白城市 Baicheng City | 12.02 | 35.38 | 23.36 | 4.62 | 13.60 | 8.98 | |
| 白山市 Baishan City | 0.90 | 2.64 | 1.74 | 0.45 | 1.34 | 0.88 | |
| 长春市 Changchun City | 1.60 | 4.70 | 3.10 | 0.69 | 2.02 | 1.33 | |
| 吉林市 Jilin City | 2.55 | 7.49 | 4.95 | 1.18 | 3.47 | 2.29 | |
| 辽源市 Liaoyuan City | 0.25 | 0.75 | 0.49 | 0.11 | 0.34 | 0.22 | |
| 四平市 Siping City | 0.82 | 2.40 | 1.58 | 0.39 | 1.14 | 0.75 | |
| 松原市 Songyuan City | 7.03 | 20.70 | 13.66 | 2.70 | 7.96 | 5.25 | |
| 通化市 Tonghua City | 0.78 | 2.28 | 1.51 | 0.38 | 1.13 | 0.74 | |
| 延边州 Yanbian Prefecture | 3.65 | 10.75 | 7.10 | 1.70 | 4.99 | 3.30 | |
| [1] |
DAVIDSON E A, JANSSENS I A, 2006. Temperature sensitivity of soil carbon decomposition and feedbacks to climate change[J]. Nature, 440(7081): 165-173.
DOI URL |
| [2] |
GORHAM E, 1991. Northern peatlands: Role in the carbon cycle and probable responses to climatic warming[J]. Ecological Applications, 1(2): 182-195.
DOI URL |
| [3] |
HOOIJER A, PAGE S, CANADELL J G, et al., 2010. Current and future CO2 emissions from drained peatlands in Southeast Asia[J]. Biogeosciences, 7(5): 1505-1514.
DOI URL |
| [4] |
LAL R, 2004. Soil carbon sequestration to mitigate climate change[J]. Geoderma, 123(1-2): 1-22.
DOI URL |
| [5] | OECD, 1996. Guidelines for aid agencies for improved conservation and sustainable use of tropical and sub-tropical wetlands[M]. Paris: Organisation for Economic Co-operation and Development: 69. |
| [6] |
POST W M, EMANUELW R, ZINKE P J, et al., 1982. Soil carbon pools and world life zones[J]. Nature, 298(5870): 156-159.
DOI URL |
| [7] |
ZHANG X, JIANG H, 2013. Spatial variations in methane emissions from natural wetlands in China[J]. International Journal of Environmental Science and Technology, 11(1): 77-86.
DOI URL |
| [8] | 边境, 任胜章, 2020. 一水奔腾绿尽来--吉林省西部河湖连通工程引水为赢凸显生态效益[J]. 智慧中国 (10): 68-71. |
| BIAN J, RENG S Z, 2020. Water increases plant greenness-the water diversion project of the river-lake connection project in the west of Jilin Province successfully increases ecological benefits[J]. Wisdomchina (10): 68-71. | |
| [9] | 崔保山, 杨志峰, 2001. 吉林省典型湿地资源效益评价研究[J]. 资源科学, 23(3): 55-61. |
| CUI BS, YANG ZF, 2001. Benefit valuation of typical wetlands in Jilin province[J]. Resources Science, 23(3): 55-61. | |
| [10] | 冯晶红, 刘德富, 吴耕华, 等, 2020. 三峡库区消落带适生植物固碳释氧能力研究[J]. 水生态学杂志, 41(1): 1-8. |
| FENG J H, LIU D F, WU G H, et al., 2020. Carbon Fixation and Oxygen Release Capabilities of Common Plants in the Water-level- fluctuation Zone of Three Gorges Reservoir[J]. Journal of Hydroecology, 41(1): 1-8. | |
| [11] | 冯源, 田宇, 朱建华, 等, 2020. 森林固碳释氧服务价值与异养呼吸损失量评估[J]. 生态学报, 40(14): 5044-5054. |
| FEENG Y, TIAN Y, ZHU J H, et al., 2020. Evaluation of forest carbon fixation and oxygen release service value and heterotrophic respiration loss[J]. Acta Ecologica Sinica, 40(14): 5044-5054. | |
| [12] | 国家林业局, 2017. 湿地生态系统服务评估规范: LY/T 2899-2017 [S]. |
| National Forestry Administration, 2017. Specifications for assessment of wetland ecosystem services: LY/T 2899-2017 [S]. | |
| [13] | 郝运, 赵妍, 刘颖, 2004. 向海湿地自然保护区生态系统服务效益价值估算[J]. 吉林林业科技, 33(4): 25-26. |
| HAO Y, ZHAO Y, LIU Y, 2004. Estimating efficiency and functional value of Ecosystem of Xianghai Wetlands Nature Reserve[J]. Journal of Jilin Forestry Science and Technology, 33(4): 25-26. | |
| [14] | 李孟颖, 2010. 湿地的固碳作用初探: 以京津冀地区为例[J]. 南水北调与水利科技, 8(3): 60-64. |
| LI M Y, 2010. A Preliminary Study on the Carbon-sink Function of Wetlands with a case study for the Jingjinji Area[J]. South-to-North Water Transfers and Water Science & Technology, 8(3): 60-64. | |
| [15] | 马琼芳, 燕红, 李伟, 等, 2019. 吉林省湿地生态系统服务价值评估[J]. 水利经济, 37(3): 67-88. |
| MA Q F, YAN H, LI W, et al., 2019. Evaluation of wetland ecosystem services in Jilin Province[J]. Journal of Economics of Water Resources, 37(3): 67-88. | |
| [16] | 马霄华, 韩炜, 管文轲, 等, 2018. 不同盐度水对芦苇固碳释氧和增湿降温的影响[J]. 环境科学与技术, 41(8): 11-16. |
| MA X H, HAN W, GUAN W K, et al., 2018. Effects of Different Salinity on Carbon Fixation and Oxygen Release, Cooling and Humidification of Reeds[J]. Environmental Science & Technology, 41(8): 11-16. | |
| [17] | 孟祥久, 周文昌, 卢海, 2014. 排水造林对泥炭沼泽湿地碳循环的影响[J]. 吉林林业科技, 43(2): 15-18. |
| MENG X J, ZHOU W C, LU H, 2014. Effects of draining for forestation to carbon cycle of peat mire[J]. Journal of Jilin Forestry Science and Technology, 43(2): 15-18. | |
| [18] | 乔恒, 2012. 吉林湿地[M]. 北京: 北京科学技术出版社. |
| QIAO H, 2012. Jilin Wetland[M]. Beijing: Beijing Science and Technology Press. | |
| [19] | 王晶, 李海波, 2006. 吉林省湿地资源现状评价及保护对策[C]//吉林省科学技术协会. 吉林省第四届科学技术学术年会论文集(下册). 长春: 吉林大学出版社. |
| WANG J, LI H B, 2006. Evaluation and protection countermeasures of wetland resources in Jilin Province[C]//Jilin Province Science and Technology Association. Proceedings of the Fourth Annual Conference of Science and Technology of Jilin Province (Volume 2). Changchun: Jilin University Press: 1300-1307. | |
| [20] | 臧正, 郑德凤, 2013. 吉林省西部湿地生态系统服务功能价值评价[J]. 大庆师范学院学报, 33(6): 97-101. |
| ZHANG Z, ZHENG D F, 2013. Value Evaluation on Service Function to Wetland Ecosystem in West of Jinlin[J]. Journal of Daqing Normal University, 33(6): 97-101. | |
| [21] | 赵述华, 叶有华, 罗飞, 等, 2019. 深圳近岸海域固碳量核算初步研究[J]. 环境科学与技术 (S2): 140-147. |
| ZHAO S H, YE Y H, LUO F, et al., 2019. Preliminary Study on Carbon Sequestration Accounting in Shenzhen Offshore Area[J]. Environmental Science & Technology (S2): 140-147. | |
| [22] | 中国绿色时报, 2020. 吉林45%自然湿地得到有效保护[EB/OL]. [2020-07-20]. http://lyt.jl.gov.cn/xxfb/xwdt/yw/yw/202007/t20200717_7808766.html . |
| China Green Times, 2020. 45% of Jilin's natural wetlands are effectively protected[EB/OL]. [2020-07-20]. http://lyt.jl.gov.cn/xxfb/xwdt/yw/yw/202007/t20200717_7808766.html . | |
| [23] | 周文昌, 索郎夺尔基, 崔丽娟, 等, 2016. 排水对若尔盖高原泥炭地土壤有机碳储量的影响[J]. 生态学报, 36(8): 2123-2132. |
| ZHOU W C, SUO L, CUI L J, et al., 2016. Effects of drainage on soil organic carbon stock in the Zoige peatlands, eastern Qinghai-Tibetan Plateau[J]. Acta Ecologica Sinica, 36(8): 2123-2132. | |
| [24] | 周颖, 周夏飞, 马国霞, 等, 2017. 基于2015年遥感数据的中国生态系统固碳释氧价值评估[C]//中国环境科学学会. 2017中国环境科学学会科学与技术年会论文集(第4卷). 厦门:793-802. |
| ZHOU Y, ZHOU X F, MA G X, et al., 2017. Evaluation of the value of carbon fixation and oxygen release in Chinese ecosystems based on remote sensing data in 2015 [C]//Chinese Society of Environmental Sciences. 2017 Chinese Society of Environmental Sciences Science and Technology Annual Conference Proceedings (Volume 4). Xiamen:793-802. | |
| [25] | 周勇, 杨柳, 2018. 自然保护区森林生态系统固碳释氧价值评估--以陕西长青自然保护区为例[J]. 安徽林业科技, 44(1): 18-23. |
| ZHOU Y, YANG L, 2018. Value Assessment on the Carbon Fixation and Oxygen Release of the Nature Reserve Forest Ecosystem: A Case Study of Shaanxi Changqing Nature Reserve[J]. Anhui Forestry Science and Technology, 44(1): 18-23. | |
| [26] | 周云凯, 白秀玲, 宁立新, 2017. 鄱阳湖湿地灰化苔草固碳能力及固碳量研究[J]. 生态环境学报, 26(12): 2030-2035. |
| ZHOU Y K, BAI X L, NING L X, 2017. Carbon Sequestration Capacity and Carbon Storage of Carex cinerascens in Poyang Lake Wetland[J]. Ecology and Environmental Sciences, 26(12): 2030-2035. |
| [1] | 王雪梅, 杨雪峰, 赵枫, 安柏耸, 黄晓宇. 基于机器学习算法的干旱区绿洲地上生物量估算[J]. 生态环境学报, 2023, 32(6): 1007-1015. |
| [2] | 陈科屹, 林田苗, 王建军, 何友均, 张立文. 天保工程20年对黑龙江大兴安岭国有林区森林碳库的影响[J]. 生态环境学报, 2023, 32(6): 1016-1025. |
| [3] | 董洁芳, 邓椿, 张仲伍. 渭河流域PM2.5时空演化及人口暴露风险[J]. 生态环境学报, 2023, 32(6): 1078-1088. |
| [4] | 巫晨煜, 许帆帆, 魏士博, 樊晶晶, 刘观鹏, 王坤. 渭河流域地表植被覆盖对气候变化的响应研究[J]. 生态环境学报, 2023, 32(5): 835-844. |
| [5] | 杨耀东, 陈玉梅, 涂鹏飞, 曾清如. 经济作物轮作模式下镉污染农田修复潜力[J]. 生态环境学报, 2023, 32(3): 627-634. |
| [6] | 宋志斌, 周佳诚, 谭路, 唐涛. 高原河流着生藻类群落沿海拔梯度的变化特征--以西藏黑曲、雪曲为例[J]. 生态环境学报, 2023, 32(2): 274-282. |
| [7] | 李威闻, 黄金权, 齐瑜洁, 刘小岚, 刘纪根, 毛治超, 高绣纺. 土壤侵蚀条件下土壤微生物生物量碳含量变化及其影响因素的Meta分析[J]. 生态环境学报, 2023, 32(1): 47-55. |
| [8] | 黄伟佳, 刘春, 刘岳, 黄斌, 李定强, 袁再健. 南岭山地不同海拔土壤生态化学计量特征及影响因素[J]. 生态环境学报, 2023, 32(1): 80-89. |
| [9] | 陈科屹, 王建军, 何友均, 张立文. 黑龙江大兴安岭重点国有林区森林碳储量及固碳潜力评估[J]. 生态环境学报, 2022, 31(9): 1725-1734. |
| [10] | 刘桢迪, 宋艳宇, 王宪伟, 谭稳稳, 张豪, 高晋丽, 高思齐, 杜宇. 冻土区泥炭地植物生长及碳氮特征对模拟增温的响应[J]. 生态环境学报, 2022, 31(9): 1765-1772. |
| [11] | 崔乔, 李宗省, 张百娟, 赵越, 南富森. 冻融作用对土壤可溶性碳氮和微生物量碳氮含量影响的荟萃分析[J]. 生态环境学报, 2022, 31(8): 1700-1712. |
| [12] | 王磊, 温远光, 周晓果, 朱宏光, 孙冬婧. 尾巨桉与红锥混交对林下植被和土壤性质的影响[J]. 生态环境学报, 2022, 31(7): 1340-1349. |
| [13] | 喻阳华, 吴银菇, 宋燕平, 李一彤. 不同林龄顶坛花椒林地土壤微生物浓度与生物量化学计量特征[J]. 生态环境学报, 2022, 31(6): 1160-1168. |
| [14] | 孙建波, 畅文军, 李文彬, 张世清, 李春强, 彭明. 香蕉不同生育期根际微生物生物量及土壤酶活的变化研究[J]. 生态环境学报, 2022, 31(6): 1169-1174. |
| [15] | 魏小锋, 韩红, 闫学军, 王在峰, 李圣增, 田勇, 梁第, 马明亮, 张桂芹. 基于卫星遥感与CMB模型的济南市冬季重污染过程PM2.5溯源分析[J]. 生态环境学报, 2022, 31(6): 1175-1183. |
| 阅读次数 | ||||||
|
全文 |
|
|||||
|
摘要 |
|
|||||