生态环境学报 ›› 2022, Vol. 31 ›› Issue (6): 1160-1168.DOI: 10.16258/j.cnki.1674-5906.2022.06.011
喻阳华1,*( ), 吴银菇2, 宋燕平1, 李一彤1
收稿日期:2022-04-06
出版日期:2022-06-18
发布日期:2022-07-29
通讯作者:
*作者简介:喻阳华(1984年生),男,副教授,博士,研究方向为喀斯特环境保护与治理。E-mail: yuyanghua2003@163.com
基金资助:
YU Yanghua1,*(), WU Yingu2, SONG Yanping1, LI Yitong1
Received:2022-04-06
Online:2022-06-18
Published:2022-07-29
摘要:
阐明顶坛花椒人工林土壤微生物化学计量随林龄的变化特征,以及对土壤化学特性的响应规律,可揭示喀斯特区土壤养分与质量状况,有助于制订林分管理措施。以贵州喀斯特区4个林龄级(5—7、10—12、20—22、28—32 a)的顶坛花椒人工林土壤为对象,通过测定微生物浓度、生物量,阐明不同林龄土壤微生物化学计量特征及其互作关系,探讨土壤理化性质的变化。结果表明,(1)土壤细菌、真菌、放线菌浓度依次为3.3×10⁵—7.9×10⁵、2.10×10³—4.15×10³、2.20×10⁵—3.95×10⁵ CFU∙g-1,表现为细菌>放线菌>真菌,随林龄增加优势菌群未发生改变。(2)随顶坛花椒生长年限增加,土壤微生物生物量碳(MBC)差异不显著,微生物生物量氮(MBN)先升高后降低,微生物生物量磷(MBP)以28—32 a的林分最低;土壤MBC/MBP和MBN/MBP以28—32 a林分最高,MBC/MBN在4个龄级之间差异显著。(3)土壤微生物浓度、生物量之间的相关性较其计量比相对偏低。(4)冗余分析表明,土壤微生物生物量对土壤养分的依赖程度强于其计量比,其中土壤pH值、全钾和速效钾等是土壤微生物化学计量变化的主要影响因子,土壤微生物化学计量与部分化学因子具有趋同效应。综上表明,喀斯特区土壤微生物化学计量对林龄的响应存在差异,顶坛花椒人工林经营管理过程中应适当施加K肥与调控pH值。
中图分类号:
喻阳华, 吴银菇, 宋燕平, 李一彤. 不同林龄顶坛花椒林地土壤微生物浓度与生物量化学计量特征[J]. 生态环境学报, 2022, 31(6): 1160-1168.
YU Yanghua, WU Yingu, SONG Yanping, LI Yitong. Stoichiometric Characteristics of Soil Microbial Concentration and Biomass in Zanthoxylum planispinum var. Dintanensis Plantations of Different Ages[J]. Ecology and Environment, 2022, 31(6): 1160-1168.
| 样地 Plot | 林龄 Age/ a | 海拔 Altitude/ m | 坡位 Positions | 坡向 Aspect | 坡度 Slope/ (°) | 密度 Density/ (plant∙hm-2) | 植被覆盖率 Vgetation coverage/ % | 平均树高 Height/ m | 平均冠幅 Average crown width/ m | 产量 Yield/ (plant∙kg-1) |
|---|---|---|---|---|---|---|---|---|---|---|
| YD1 | 5-7 | 615 | 中下 | 阳坡 | 5 | 1150 | 100 | 2.7 | 2.5×3 | 6-7 |
| YD2 | 10-12 | 621 | 中下 | 阳坡 | 10 | 1150 | 100 | 2.7 | 2.5×3 | 7-8 |
| YD3 | 20-22 | 630 | 中下 | 阳坡 | 5 | 1000 | 90 | 3.5 | 3.5×3 | 4-5 |
| YD4 | 28-32 | 628 | 中下 | 阳坡 | 5 | 650 | 75 | 4 | 4×5 | 1-1.5 |
表1 样地基本情况
Table 1 Basic information of sampling plots
| 样地 Plot | 林龄 Age/ a | 海拔 Altitude/ m | 坡位 Positions | 坡向 Aspect | 坡度 Slope/ (°) | 密度 Density/ (plant∙hm-2) | 植被覆盖率 Vgetation coverage/ % | 平均树高 Height/ m | 平均冠幅 Average crown width/ m | 产量 Yield/ (plant∙kg-1) |
|---|---|---|---|---|---|---|---|---|---|---|
| YD1 | 5-7 | 615 | 中下 | 阳坡 | 5 | 1150 | 100 | 2.7 | 2.5×3 | 6-7 |
| YD2 | 10-12 | 621 | 中下 | 阳坡 | 10 | 1150 | 100 | 2.7 | 2.5×3 | 7-8 |
| YD3 | 20-22 | 630 | 中下 | 阳坡 | 5 | 1000 | 90 | 3.5 | 3.5×3 | 4-5 |
| YD4 | 28-32 | 628 | 中下 | 阳坡 | 5 | 650 | 75 | 4 | 4×5 | 1-1.5 |
| 样地Plot | pH | w(SOC)/(g∙kg-1) | w(TN)/(g∙kg-1) | w(TP)/(g∙kg-1) | w(TK)/(g∙kg-1) | w(AN)/(mg∙kg-1) | w(AP)/(mg∙kg-1) | w(AK)/(mg∙kg-1) |
|---|---|---|---|---|---|---|---|---|
| YD1 | 7.97±0.25a | 23.65±4.31a | 2.62±0.34a | 0.43±0.11a | 14.65±0.50a | 175±14.14a | 32.7±5.80a | 253±72.12a |
| YD2 | 7.57±0.25ab | 15.3±0.85a | 2.50±0.30a | 0.80±0.20a | 14.35±0.21a | 162±5.66a | 20.2±5.37a | 245±4.24a |
| YD3 | 6.53±0.33b | 15.05±2.47a | 2.00±0.52a | 1.11±0.24a | 10.55±0.07a | 222.5±109.01a | 36.65±9.55a | 222±24.04a |
| YD4 | 7.32±0.25ab | 16.5±2.26a | 2.12±0.43a | 0.77±0.18a | 14.8±0.14a | 145±29.70a | 33.65±7.28a | 149.5±64.35a |
表2 不同林龄顶坛花椒的土壤化学性质
Table 2 Soil chemical properties in Zanthoxylum planispinum var. dintanensis of different forest ages
| 样地Plot | pH | w(SOC)/(g∙kg-1) | w(TN)/(g∙kg-1) | w(TP)/(g∙kg-1) | w(TK)/(g∙kg-1) | w(AN)/(mg∙kg-1) | w(AP)/(mg∙kg-1) | w(AK)/(mg∙kg-1) |
|---|---|---|---|---|---|---|---|---|
| YD1 | 7.97±0.25a | 23.65±4.31a | 2.62±0.34a | 0.43±0.11a | 14.65±0.50a | 175±14.14a | 32.7±5.80a | 253±72.12a |
| YD2 | 7.57±0.25ab | 15.3±0.85a | 2.50±0.30a | 0.80±0.20a | 14.35±0.21a | 162±5.66a | 20.2±5.37a | 245±4.24a |
| YD3 | 6.53±0.33b | 15.05±2.47a | 2.00±0.52a | 1.11±0.24a | 10.55±0.07a | 222.5±109.01a | 36.65±9.55a | 222±24.04a |
| YD4 | 7.32±0.25ab | 16.5±2.26a | 2.12±0.43a | 0.77±0.18a | 14.8±0.14a | 145±29.70a | 33.65±7.28a | 149.5±64.35a |
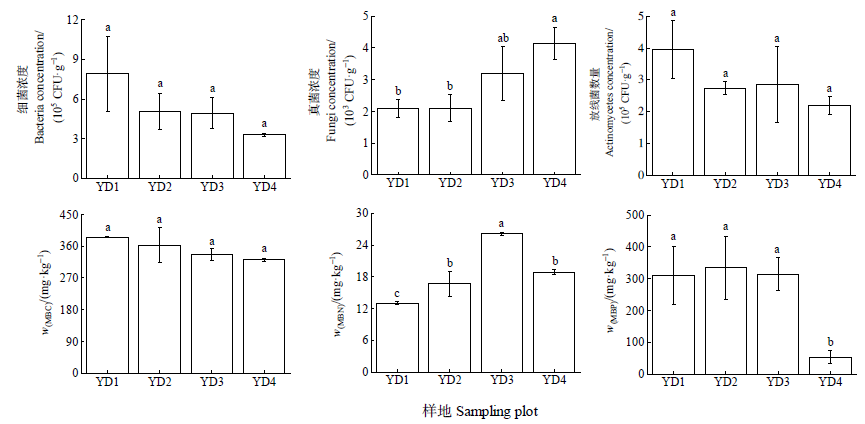
图1 不同林龄土壤微生物浓度、生物量
Figure 1 The soil microbial concentration and biomass of different forest ages
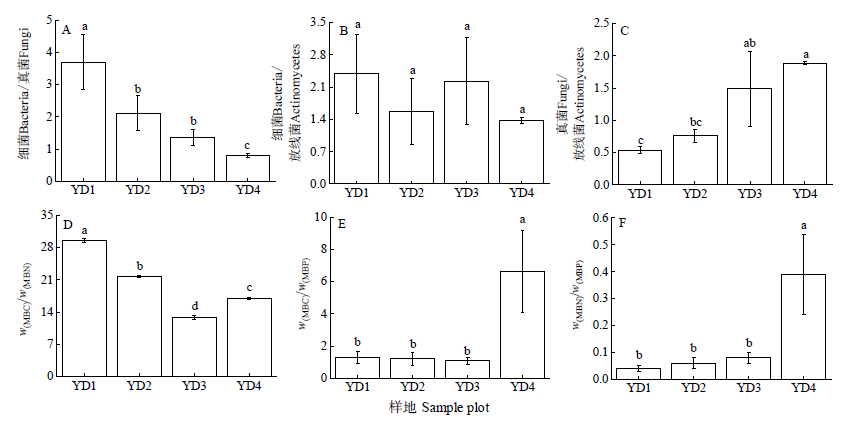
图2 不同林龄土壤微生物浓度、生物量计量特征
Figure 2 The measurement ratio of soil microbial concentration and biomass of different forest ages
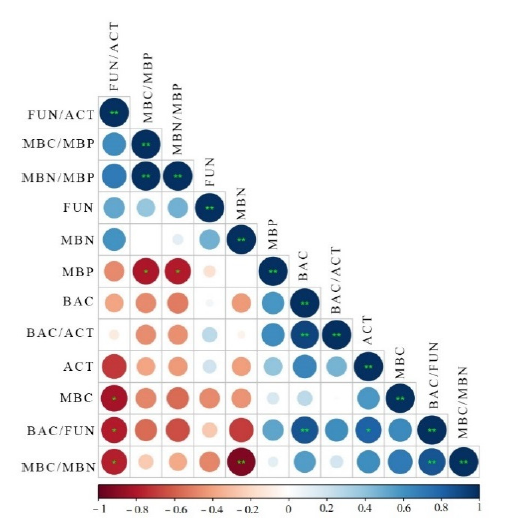
图3 土壤微生物浓度、生物量及其化学计量比之间的相关热图 圆圈大小表示相关性的强弱,蓝色越深表示正相关越大,棕色越深表示负相关越大
Figure 3 Correlation heat map among concentration, biomass and stoichiometric ratio of soil microorganisms The circle size indicates the strength of the correlation, the darker the blue, the greater the positive correlation, and the daker the brown, the greater the negative correlation
| 指标 Index | BAC | FUN | ACT | MBC | MBN | MBP | BAC/FUN | BAC/ACT | FUN/ACT | MBC/MBN | MNC/MBP |
|---|---|---|---|---|---|---|---|---|---|---|---|
| FUN | 0.054 | 1 | |||||||||
| ACT | 0.651 | 0.208 | 1 | ||||||||
| MBC | 0.265 | -0.480 | 0.570 | 1 | |||||||
| MBN | -0.426 | 0.474 | -0.415 | -0.448 | 1 | ||||||
| MBP | 0.583 | -0.157 | 0.396 | 0.165 | 0.02 | 1 | |||||
| BAC/FUN | 0.858** | -0.261 | 0.801* | 0.633 | -0.693 | 0.520 | 1 | ||||
| BAC/ACT | 0.919** | 0.261 | 0.463 | -0.010 | -0.060 | 0.621 | 0.613 | 1 | |||
| FUN/ACT | -0.394 | 0.518 | -0.704 | -0.828* | 0.592 | -0.473 | -0.787* | -0.104 | 1 | ||
| MBC/MBN | 0.551 | -0.484 | 0.612 | 0.705 | -0.927** | 0.112 | 0.857** | 0.188 | -0.780* | 1 | |
| MBC/MBP | -0.475 | 0.388 | -0.391 | -0.489 | -0.004 | -0.810* | -0.569 | -0.461 | 0.630 | -0.253 | 1 |
| MBN/MBP | -0.512 | 0.471 | -0.422 | -0.561 | 0.119 | -0.787* | -0.645 | -0.451 | 0.703 | -0.372 | 0.991** |
表3 土壤微生物浓度、生物量及其化学计量比之间相关系数
Table 3 Pearson's correlation coefficients of soil microbial concentration, biomass and their stochiometric ratios
| 指标 Index | BAC | FUN | ACT | MBC | MBN | MBP | BAC/FUN | BAC/ACT | FUN/ACT | MBC/MBN | MNC/MBP |
|---|---|---|---|---|---|---|---|---|---|---|---|
| FUN | 0.054 | 1 | |||||||||
| ACT | 0.651 | 0.208 | 1 | ||||||||
| MBC | 0.265 | -0.480 | 0.570 | 1 | |||||||
| MBN | -0.426 | 0.474 | -0.415 | -0.448 | 1 | ||||||
| MBP | 0.583 | -0.157 | 0.396 | 0.165 | 0.02 | 1 | |||||
| BAC/FUN | 0.858** | -0.261 | 0.801* | 0.633 | -0.693 | 0.520 | 1 | ||||
| BAC/ACT | 0.919** | 0.261 | 0.463 | -0.010 | -0.060 | 0.621 | 0.613 | 1 | |||
| FUN/ACT | -0.394 | 0.518 | -0.704 | -0.828* | 0.592 | -0.473 | -0.787* | -0.104 | 1 | ||
| MBC/MBN | 0.551 | -0.484 | 0.612 | 0.705 | -0.927** | 0.112 | 0.857** | 0.188 | -0.780* | 1 | |
| MBC/MBP | -0.475 | 0.388 | -0.391 | -0.489 | -0.004 | -0.810* | -0.569 | -0.461 | 0.630 | -0.253 | 1 |
| MBN/MBP | -0.512 | 0.471 | -0.422 | -0.561 | 0.119 | -0.787* | -0.645 | -0.451 | 0.703 | -0.372 | 0.991** |
| 指标 Index | RDA1 | RDA2 | RDA3 | RDA4 |
|---|---|---|---|---|
| 特征值 Eigenvalue | 22.59 | 1.07 | 43.87 | 4.08 |
| 贡献率 Proportion Explained/% | 95.29 | 4.49 | 0.002 | 0.00002 |
| 累计贡献率Cumulative Proportion/% | 95.29 | 9.98 | 0.99 | 0.99 |
表4 RDA分析的特征值、方差贡献率及累计方差贡献率
Table 4 Eigenvalues, and their contribution to the variance of RDA
| 指标 Index | RDA1 | RDA2 | RDA3 | RDA4 |
|---|---|---|---|---|
| 特征值 Eigenvalue | 22.59 | 1.07 | 43.87 | 4.08 |
| 贡献率 Proportion Explained/% | 95.29 | 4.49 | 0.002 | 0.00002 |
| 累计贡献率Cumulative Proportion/% | 95.29 | 9.98 | 0.99 | 0.99 |
| 指标 Index | 贡献率 Contribution/% | Pseudo-F | P |
|---|---|---|---|
| AK | 63.4 | 10.4 | 0.01 |
| pH | 7.1 | 2.6 | 0.19 |
| TK | 9.2 | 2.2 | 0.22 |
| SOC | 9.7 | 1.8 | 0.23 |
| AP | 5.0 | 0.9 | 0.38 |
表5 部分土壤化学性质重要性测序和显著性检验
Table 5 Sequencing and remarkable test of portion soil chemical factors
| 指标 Index | 贡献率 Contribution/% | Pseudo-F | P |
|---|---|---|---|
| AK | 63.4 | 10.4 | 0.01 |
| pH | 7.1 | 2.6 | 0.19 |
| TK | 9.2 | 2.2 | 0.22 |
| SOC | 9.7 | 1.8 | 0.23 |
| AP | 5.0 | 0.9 | 0.38 |
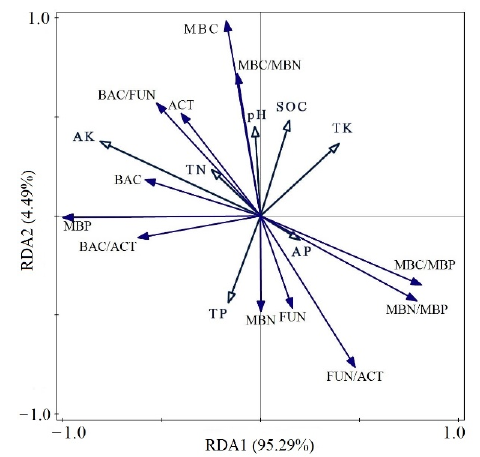
图4 土壤微生物化学计量与土壤化学性质的冗余分析
Figure 4 Redundancy analysis of soil microbial stoichiometry and soil chemical properties
| [1] | ADAIR K L, WRATTEN S, LEAR G, 2013. Soil phosphorus depletion and shifts in plant communities changes bacterial community structure in a long-term grassland management trial[J]. Environmental Microbiology Reports, 5(3): 404-413. |
| [2] | BASSETT A, RICHARDSN A E, BAKER G, et al., 2011. Long-term land use effects on soil microbial community structure and function[J]. Applied Soil Ecology, 51(1): 66-78. |
| [3] | BOYLE S A, YARWOOD R R, BOTTOMLEY P J, et al., 2008. Bacterial and fungal contributions to soil nitrogen cycling under Douglas fir and red alder at two sites in Oregon[J]. Soil Biology and Biochemistry, 40(2): 443-451. |
| [4] | BUCHKOWSKI R W, SCHMITZ O J, BRADFORD M A, 2015. Microbial stoichiometry overrides biomass as a regulator of soil carbon and nitrogen cycling[J]. Ecology, 96(4): 1139-1149. |
| [5] | CAO Y S, FU S L, ZOU X M, et al., 2010. Soil microbial community composition under Eucalyptus plantations of different age in subtropical China[J]. European Journal of Soil Biology, 46(2): 128-135. |
| [6] | CLEVELAND C C, DANIEL L, 2007. C:N:Pstoichiometry in soil: is there a “Redfield ratio” for the microbial biomass?[J]. Biogeochemitry, 85: 235-252. |
| [7] | DEVI N B, YADAVA P S, 2006. Seasonal dynamics in soil microbial C, N and P in a mixed-oxk forest ecosystem of Manipur, North-east India[J]. Applied soil ecology, 31(3): 220-227. |
| [8] | FENÁNDEZ-CALVINO D, BAATH E, 2010. Growth response of the bacterial community to pH in soils differing in pH[J]. FEMS Microbiology Ecology, 73(1): 149-156. |
| [9] | HE K Q, DU R L, JIANG W F, 2009. Contrastive analysis of karst collapses and the distribution rules in northern and southern China[J]. Environmental Earth Sciences, 59(6): 1309-1318. |
| [10] | HE Z L, YANG X E, BALIGAR V C, et al., 2003. Microbiological and biochemical indexing systems for assessing quality of acid soils[J]. Advances in Agronomy, 78(2): 89-138. |
| [11] | HEUCK C, WEIG A, SPOHN M, 2015. Soil microbial biomass C:N:P stoichiometry and microbial use of organic phosphorus[J]. Soil Biology&Biochemistry, 85: 119-129. |
| [12] | HǑGBERG M N, HUGBERG P, MYROLD D D, 2007. Is microbial community composition in boreal forest soils determined by pH, C-to-N ratio, the trees, or all three?[J]. Oecologia, 105(4): 590-601. |
| [13] | IMBERGER K T, CHUI C Y, 2001. Spatial changes of soil fungal and bacterial biomass from a sub-alpine coniferous forest to grassland in a humid, sub-tropical region[J]. Bioligy and Forest of Soils, 33(2): 105-110. |
| [14] | KRAJICK K, 2006. Living the high life: the mountaintop environment of the Andes harbors a Noah's ark of previously undocumented species[J]. Natural History, 115(7): 44-55. |
| [15] | LEFF J W, JONES S E, PROBER S M, et al., 2015. Consistent responses of soil microbial communities to elevated nutrient inputs in grasslands across the globe[J]. Proceedings of the National Academy of Sciences of the United States of America, 112(35): 10967-10972. |
| [16] | LI Y, WU J S, LIU S L, et al., 2012. Is the C:N:P stoichiometry in soil and soil microbial biomass related to the landscape and land use in southern subtropical China?[J]. Global Biogeochemical Cycles, 26(4): GB4002. |
| [17] | MITCHELL R J, HESTER A J, CAMPMAN S J, et al., 2013. Explaining the variation in the soil microbial community: do vegetation composition and soil chemistry explain the same or different parts of the microbial variation?[J]. Plant and Soil, 351(1-2): 355-362. |
| [18] | PAUL E A, CLARK F E, 1996. Soil microbiology, ecology and biochemistry[J]. Sun Diego: Academic Press. |
| [19] | RAMOS B, LUCAS GARCIA J A, PROBANZA A, et al., 2003. Influence of an indigenous European alder (Alnus glutinosa L·Gaerth) rhizobacterium (Bacillus pumilus) on the growth of alder and its rhizosphere microbial community structure in two soils[J]. New Forests, 25(2): 149-159. |
| [20] | SONG M, PENG W X, DU H, et al., 2019. Responses of soil and Microbial C:N:P stoichiometry to vegetation succession in a karst region of southwest China[J]. Forests, 10(9): 755. |
| [21] | TAYLOR A R, WANGJ R, CHEN H Y H, 2007. Carbon storage in a chronosequence of red spruce (Picea rubens) forests in central Nova Scotia, Canada[J]. Canada Journal of Forest Research, 37(11): 2260-2269. |
| [22] | WANG M, QU L Y, MA K M, et al., 2013. Soil microbial properties under different vegetation types on Mountain Han[J]. Science China Life Sciences, 56(6): 561-570. |
| [23] | WANG S J, LIU Q M, ZHANG D F, 2004. Karst rocky desertification in southwestern China: Geomorphology, land use, impact and rehabilitation[J]. Land Degradation & Development, 15(2): 115-121. |
| [24] | WU Z Y, HAACK S E L, LIN W, 2015. Soil microbical community structure and metabolic activity of Pinus elliottii plantations across different stand ages in a subtropical area[J]. Plos One, 8: 2115-2121. |
| [25] |
XIAO L, BI Y L, DU S Z, et al., 2021. Response of ecological stoichiometry and stoichiometric homeostasis in the plant-litter-soil system to re-vegetation type in arid mining subsidence areas[J]. Journal of Arid Environment, DOI: 10.1016/j.jaridenv.2020.104298.
DOI URL |
| [26] | XU Z F, HU R, XIONG P, et al., 2010. Initial soil responses to experimental warning in two contrasting forest ecosystems, Eastern Tibetan Platean China: nutrient availabilities, microbial properties and enzyme activities[J]. Applied Soil Ecology, 46(2): 291-299. |
| [27] |
ZHANG J Y, YANGX M, SONG Y H, et al., 2020. Revealing the nutrient limitation and cycling for microbes under forest management practices in the Loess Plateau-Ecological stoichiometry[J]. Geoderma, DOI: 10.1016/j.jaridenv.2020.104298.
DOI URL |
| [28] | ZHANG W, QIAO W J, GAO D X, et al., 2018. Relationship between soil nutrient properties and biological activities along a restoration chronosequence of Pinus tabulaeformis plantation forests in the Ziwuling Mountains, China[J]. Catena, 161: 85-95. |
| [29] | ZHONG Z K, ZHANG X Y, WANG X, et al., 2020. Soil bacteria and fungi respond differently to plant diversity and plant family composition during the secondary succession of abandoned farmland on the Loess Plateau, China[J]. Plant and Soil, 448(1): 183-200. |
| [30] | ZHOU Z H, WANG C K, 2015. Reviews and syntheses: Soil resources and climate jointly drive variations in microbial biomass carbon and nitrogen in China's forest ecosystems[J]. Biogeosciences Discussions, 12(22): 6751-6760. |
| [31] | ZHUW K, XU Y X, WANG Z C, et al., 2021. Soil-microbial stoichiometry of Eucalyptus urophylla×E. grandis plantation at different growth stages[J]. Journal of Zhejiang A & F University, 38(4): 692-702. |
| [32] | ZOU J, YU L F, HUANG Z S, 2019. Variation of leaf carbon isotope in plants in different lithological habitats in a karst area[J]. Forest, 10(4): 356. |
| [33] | 鲍士旦, 2000. 土壤农化分析[M]. 第3版. 北京: 中国农业出版社. |
| BAO S D, 2000. Soil agricultural analysis[M]. The third edition. Beijing: China Agricultural Publishing House. | |
| [34] | 范媛媛, 李懿, 李启迪, 2019. 不同林龄油松土壤微生物、酶活性和养分特征[J]. 水土保持研究, 26(6): 58-64. |
| FAN Y Y, LI Y, LI Q D, 2019. Microbe enzymatic activity and nutrient contents of soils in different stand ages of Pinus tabuliformus[J]. Research of Soil and Water Conservation, 26(6): 58-64. | |
| [35] | 洪丕征, 刘世荣, 王晖, 等, 2016. 南亚热带红椎和格木人工幼龄林土壤微生物群落结构特征[J]. 生态学报, 36(14): 4496-4508. |
| HONG P Z, LIU S R, WANG H, et al., 2016. Characteristics of soil microbial community structure in two young plantations of Castanopsis hystrix and Erythrophleun fordii in subtropical China[J]. Acta Ecologica Sinica, 36(14): 4496-4508. | |
| [36] | 胡宗达, 刘世荣, 刘兴良, 等, 2021. 川西亚高山天然次生林不同演替阶段土壤微生物生物量及其化学计量特征[J]. 生态学报, 41(12): 4900-4921. |
| HU Z D, LIU S R, LIU X L, et al., 2021. Soil and soil microbial bimass contents and C:N:P stoichiometry at different succession stages of natural secondary forest in sub-alpine area of western Sichuan, China[J]. Acta Ecologica Sinica, 41(12): 4900-4921. | |
| [37] | 李万年, 黄则月, 赵春梅, 等, 2020. 望天树人工幼林土壤微生物量碳氮及养分特征[J]. 北京林业大学学报, 562(15): 145-154. |
| LI W N, HUANG Z Y, ZHAO C M, et al., 2020. Characteristics of soil microbial biomass C, N and nutrients in young plantations of Parashorea chinesis[J]. Journal of Beijing Forestry University, 42(12): 51-62. | |
| [38] | 李雪萍, 李建宏, 漆永红, 等, 2017. 青稞根腐病对根际土壤微生物及酶活性的影响[J]. 生态学报, 37(17): 5640-5649. |
| LI X P, LI H J, QI Y H, et al., 2017. Effects of naked barley root rot on rhizosphere soil microorganisms and enzyme activity[J]. Acta ecoligica sinica, 37(17): 5640-5649. | |
| [39] | 林先贵, 2010. 土壤微生物研究原理与方法[M]. 北京: 高等教育出版社. |
| LIN X G, 2010. Principles and methods of soil microbial research[M]. Beijing: Higher Education Press. | |
| [40] |
刘宝, 吴文峰, 林思祖, 等, 2019. 中亚热带4种林分类型土壤微生物生物量碳氮特征及季节变化[J]. 应用生态学报, 30(6): 1901-1910.
DOI |
|
LIU B, WU W F, LIN S Z, et al., 2019. Characteristics of soil microbial biomass carbon and nitrogen and its seasonal dynamics in four mid-subtropical forests[J]. Chinese Journal of Applied Ecology, 30(6): 1901-1910.
DOI |
|
| [41] | 刘方, 王世杰, 刘元生, 等, 2005. 喀斯特石漠化过程土壤质量变化及生态环境影响评价[J]. 生态学报, 25(3): 639-644. |
| LIU F, WANG S J, LIU Y S, et al., 2005. Changes of soil quality in the process of karst rocky desertification and evaluation of impact on ecological environmentt[J]. Acta ecologica sinica, 25(3): 639-644. | |
| [42] | 龙健, 廖洪凯, 李娟, 等, 2012. 基于冗余分析的典型喀斯特山区土壤-石漠化关系研究[J]. 环境科学, 33(6): 2131-2138. |
| LONG J, LIAO H K, LI J, et al., 2012. Relationships between soil and rocky desertification in typical karst mountain area based on redundancy analysis[J]. Environmental Science, 33(6): 2131-2138. | |
| [43] | 牛小云, 孙晓梅, 陈东升, 等, 2015. 辽东山区不同林龄日本落叶松人工林土壤微生物、养分及酶活性[J]. 应用生态学报, 26(9): 2663-2672. |
| NIU X Y, SUN X M, CHEN D S, 2015. Soil microorganisms, nutrients and enzyme activity of Larix kaempferi plantation under different ages in mountainous region of eastern Liaoning Province, China[J]. Chinese Journal of Applied Ecology, 26(9): 2663-2673. | |
| [44] |
万军, 2003. 贵州省喀斯特地区土地退化与生态重建研究进展[J]. 地球科学进展, 18(3): 447-453.
DOI |
| WAN J, 2003. Land degradation and ecological rehabilitation in karst areas of Guizhou province southwestern China[J]. Advance in earth sciences, 18(3): 447-453. | |
| [45] | 王传杰, 王齐齐, 徐虎, 等, 2018. 长期施肥下农田土壤-有机质-微生物的碳氮磷化学计量学特征[J]. 生态学报, 38(11): 3848-3858. |
| WANG C J, WANG Q Q, XU H, et al., 2018. Carbon nitrogen, and phosphorus stoichiometry characteristics of bulk soil, organic matter, and soil microbial biomass under long-term fertilization in cropland[J]. Acta Ecologica Sinica, 38(11): 3848-3858. | |
| [46] | 王理德, 姚拓, 王方琳, 等, 2016. 石羊河下游退耕地土壤微生物变化及土壤酶活性[J]. 生态学报, 36(15): 4769-4779. |
| WANG L D, YAO T, WANG F L, et al., 2016. Soil microbial and soil enzyme activity in a discontinued farmland by the Lower Shiyang River[J]. Acta Ecologica Sinica, 36(15): 4769-4779. | |
| [47] |
王雪梅, 闫帮国, 赵广, 等, 2017. 云南元谋不同海拔土壤微生物对车桑子碳、氮、磷化学计量特征及土壤特性的影响[J]. 植物生态学报, 41(3): 311-324.
DOI |
| WANG X M, YAN B G, ZHAO G, et al., 2017. Effects of microorganism on carbon, carbon and phosphorus of Dodonaea visxosa and the soils from different elevations in Yuanmou, Yunnan, China[J]. Chinese Journal of Plant Ecology, 41(3): 311-324. | |
| [48] |
王薪琪, 韩轶, 王传宽, 2017. 帽儿山不同林龄落叶阔叶林土壤微生物生物量及其季节动态[J]. 植物生态学报, 41(6): 597-609.
DOI |
| WANG X Q, HAN Y, WANG C K, 2017. Soil microbial biomass and its seasonality in deciduous broadleaved forests with different stand ages in the Mao'ershan region, Northeast China[J]. Chinese Journal of Plant Ecology, 41(6): 597-609. | |
| [49] | 杨凯, 朱教君, 张金鑫, 2009. 不同林龄落叶松人工林土壤微生物生物量碳氮的季节变化[J]. 生态学报, 29(10): 5500-5507. |
| YANG K, ZHU J J, ZHANG J X, 2009. Seasonal dynamics of soil microbial biomass C and N in two larch plantation forest with different ages in Northeastern China[J]. Acta Ecologica Sinica, 29(10): 5500-5507. | |
| [50] | 赵辉, 周运超, 任启飞, 2020. 不同林龄马尾松人工林土壤微生物群落结构和功能多样性演变[J]. 土壤学报, 57(1): 227-238. |
| ZHAO H, ZHOU Y C, REN Q F, 2020. Evolution of soil microbial community structure and functional diversity in Pinus Massoniana plantations with age of stand[J]. Acta Pedologica Sinica, 57(1): 227-238. |
| [1] | 陈俊芳, 吴宪, 刘啸林, 刘娟, 杨佳绒, 刘宇. 不同土壤水分下元素化学计量对微生物多样性的塑造特征[J]. 生态环境学报, 2023, 32(5): 898-909. |
| [2] | 张立进, 杜虎, 曾馥平, 黄国勤, 宋敏, 宋同清. 喀斯特峰丛洼地植被恢复过程中生产力与多样性关系探讨[J]. 生态环境学报, 2023, 32(1): 26-35. |
| [3] | 李威闻, 黄金权, 齐瑜洁, 刘小岚, 刘纪根, 毛治超, 高绣纺. 土壤侵蚀条件下土壤微生物生物量碳含量变化及其影响因素的Meta分析[J]. 生态环境学报, 2023, 32(1): 47-55. |
| [4] | 黄伟佳, 刘春, 刘岳, 黄斌, 李定强, 袁再健. 南岭山地不同海拔土壤生态化学计量特征及影响因素[J]. 生态环境学报, 2023, 32(1): 80-89. |
| [5] | 刘展航, 张树岩, 侯玉平, 朱书玉, 王立冬, 施欣悦, 李培广, 韩广轩, 谢宝华. 互花米草入侵对黄河口湿地土壤碳氮磷及其生态化学计量特征的影响[J]. 生态环境学报, 2022, 31(7): 1360-1369. |
| [6] | 孙建波, 畅文军, 李文彬, 张世清, 李春强, 彭明. 香蕉不同生育期根际微生物生物量及土壤酶活的变化研究[J]. 生态环境学报, 2022, 31(6): 1169-1174. |
| [7] | 符裕红, 张代杰, 项蛟, 周焱, 黄宗胜, 喻理飞. 喀斯特不同地下生境剖面植物根系拓扑结构特征[J]. 生态环境学报, 2022, 31(5): 865-874. |
| [8] | 冯凌, 喻理飞, 王阳, 张丽敏, 赵庆, 李方兵. 喀斯特地区植被不同恢复阶段功能冗余和功能多样性对群落稳定性的影响[J]. 生态环境学报, 2022, 31(4): 670-678. |
| [9] | 梁嘉伟, 余炜敏, 姚钰玲, 胡绮琪, 陆丹绵, 王荣萍, 廖新荣, 黄赛花. 生物有机肥对土壤质量及蔬菜产量的影响[J]. 生态环境学报, 2022, 31(3): 497-503. |
| [10] | 张淑兰, 韩勇, 杨盼, 闫育盈, 刘昭雪, 李卓瑶. 汉江上游不同林龄麻栎林枯落物的水文功能评价[J]. 生态环境学报, 2022, 31(1): 44-51. |
| [11] | 孙雪娇, 李吉玫, 张毓涛, 李翔, 芦建江, 佘飞. 天山北坡山地森林林地产流产沙特征及其影响因素分析[J]. 生态环境学报, 2021, 30(9): 1821-1830. |
| [12] | 刘进, 龙健, 李娟, 李红. 典型喀斯特山区优势树种钙吸收能力的海拔分异特征研究[J]. 生态环境学报, 2021, 30(8): 1589-1598. |
| [13] | 胡瑞, 房焕英, 肖胜生, 段剑, 张杰, 刘洪光, 汤崇军. 南方红壤典型花岗岩侵蚀区主要治理模式的土壤碳汇效应[J]. 生态环境学报, 2021, 30(8): 1617-1626. |
| [14] | 郑智恒, 熊康宁, 容丽, 池永宽. 两种等级喀斯特石漠化地区生物结皮对土壤养分恢复的影响[J]. 生态环境学报, 2021, 30(6): 1202-1212. |
| [15] | 张乃木, 宋娅丽, 王克勤, 张雨鉴, 潘禹, 郑兴蕊. 模拟氮沉降下滇中亚高山森林凋落物养分元素释放特征[J]. 生态环境学报, 2021, 30(5): 920-928. |
| 阅读次数 | ||||||
|
全文 |
|
|||||
|
摘要 |
|
|||||