生态环境学报 ›› 2021, Vol. 30 ›› Issue (12): 2275-2284.DOI: 10.16258/j.cnki.1674-5906.2021.12.001
• 研究论文 •
下一篇
黄栋1,2( ), 李鹏1,2, 董南3,*()
收稿日期:2021-03-19
出版日期:2021-12-18
发布日期:2022-01-04
通讯作者:
*董南(1984年生),男,副研究员,注册测绘师,博士,主要从事智慧城市、遥感与GIS应用研究。E-mail: dongnan67@126.com作者简介:黄栋(1989年生),女,讲师,博士,研究方向为资源环境数据分析与应用。E-mail: imdon@126.com
基金资助:
HUANG Dong1,2(), LI Peng1,2, DONG Nan3,*()
Received:2021-03-19
Online:2021-12-18
Published:2022-01-04
摘要:
植被是全球或区域生态环境变化监测的“指示器”,利用NDVI(Normal Difference Vegetation Index,归一化植被指数)作为表征植被生长状况的指示因子,监测其动态变化并探讨其与相关因素间的关系,对区域生态环境可持续发展具有重要意义。选取2000—2018年环渤海地区SPOT/VEGETATION NDVI数据集,采用相关分析、稳定性评价和变化趋势分析等方法,从区域和像元尺度获取GS_NDVI(Growing Season NDVI,植被生长季NDVI)动态变化和空间分异及其对气候和LUCC的响应。得到以下主要结论:从区域尺度来看,近20 a以来环渤海地区植被覆盖状况有较为明显的改善,区域平均GS_NDVI由0.6267提升至0.6755;从像元尺度来看,62.23%的像元GS_NDVI呈改善趋势,24.63%的像元NDVI呈退化趋势,环渤海“C”型带北部城市改善趋势最为明显且稳定性较高;华北地区(天津市、唐山市)、临海区和城镇扩张区域植被退化严重且稳定性差,并且越邻近岸线,GS_NDVI随时间变化的稳定性越差;气候因素对GS_NDVI变化的影响十分有限(显著相关的像元数量不超过10%),其中GS_NDVI变化与降水的相关关系相较于气温更为密切;区域土地利用基本格局决定了环渤海地区GS_NDVI的空间格局,建设用地的扩张是导致区域植被退化的关键因素;人类活动驱动下土地利用变化是主导GS_NDVI退化以及不稳定变化的关键因素。
中图分类号:
黄栋, 李鹏, 董南. 近20 a环渤海地区GS_NDVI时空分异及其对气候变化和LUCC的响应[J]. 生态环境学报, 2021, 30(12): 2275-2284.
HUANG Dong, LI Peng, DONG Nan. Spatial-temporal Differentiation of GS_NDVI in Recent 20 Years and Its Responses to Climate Change and LUCC in the Bohai Coastal Region[J]. Ecology and Environment, 2021, 30(12): 2275-2284.
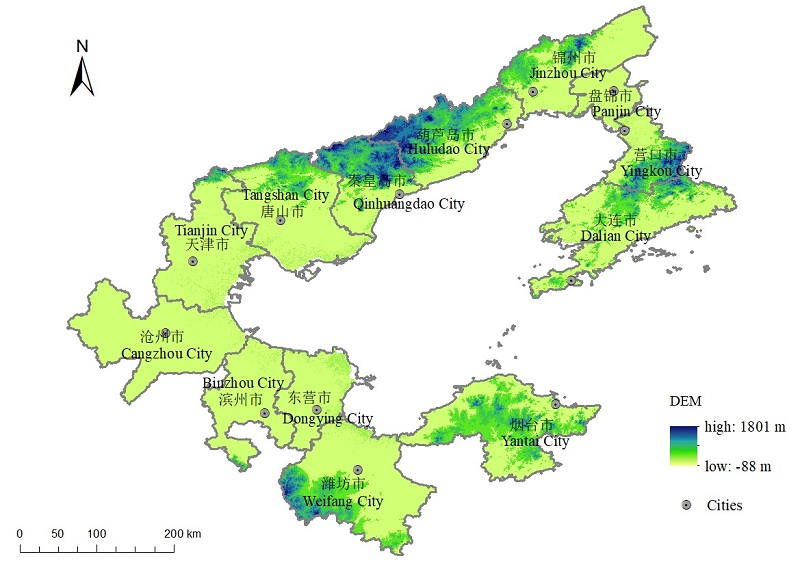
图1 研究区概况
Fig. 1 Overview of the study area
| 数据名称 Name of the data | 数据格式 Data type | 数据时相 Data time | 空间分辨率与比例尺 Resolution and Scale | 数据来源 Data sources |
|---|---|---|---|---|
| 市行政边界 Boundary of the cities | 矢量 Vector | 2015 | 1:100000 | RESDC |
| 土地利用数据 Land use | 栅格 Grid | 2000/2010/2018 | 1 km | RESDC |
| DEM | 栅格 Grid | 2000 | 30m | RESDC |
| 气象站点 Meteorological stations | 矢量 Vector | 2010 | — | CMDSC |
| 降水、气温数据 Precipitation and temperature data | 文本 Text | 2000—2018 | — | CMDSC |
| 中国季度植被指数空间分布数据 Spatial distribution dataset of quarterly NDVI of China | 栅格 Grid | 2000—2018 | 1 km | RESDC |
表1 数据来源
Table 1 Data sources
| 数据名称 Name of the data | 数据格式 Data type | 数据时相 Data time | 空间分辨率与比例尺 Resolution and Scale | 数据来源 Data sources |
|---|---|---|---|---|
| 市行政边界 Boundary of the cities | 矢量 Vector | 2015 | 1:100000 | RESDC |
| 土地利用数据 Land use | 栅格 Grid | 2000/2010/2018 | 1 km | RESDC |
| DEM | 栅格 Grid | 2000 | 30m | RESDC |
| 气象站点 Meteorological stations | 矢量 Vector | 2010 | — | CMDSC |
| 降水、气温数据 Precipitation and temperature data | 文本 Text | 2000—2018 | — | CMDSC |
| 中国季度植被指数空间分布数据 Spatial distribution dataset of quarterly NDVI of China | 栅格 Grid | 2000—2018 | 1 km | RESDC |
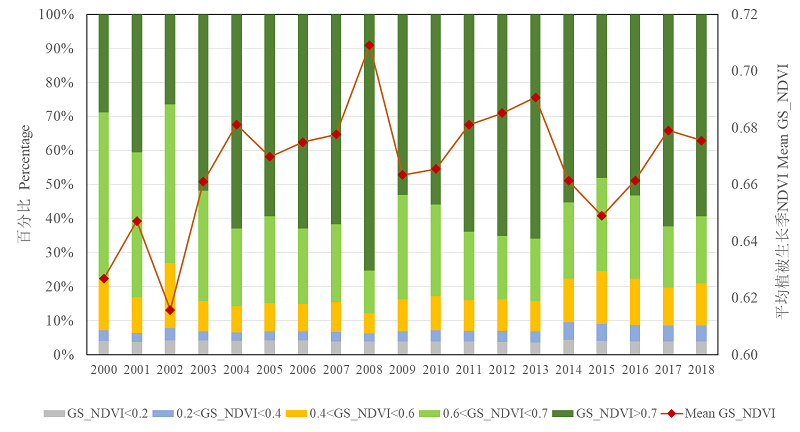
图2 2000—2018年环渤海地区不同年份不同等级GS_NDVI占比及平均值
Fig. 2 Interannual variation of percentage and regional average GS_NDVI during 2000—2018

图3 1 km格网尺度下2000—2018年平均GS_NDVI和GS_NDVI变化
Fig. 3 The mean GS_NDVI during the period of 2000 to 2018 and the changing value of GS_NDVI from 2000 to 2018 at 1 km pixel scale
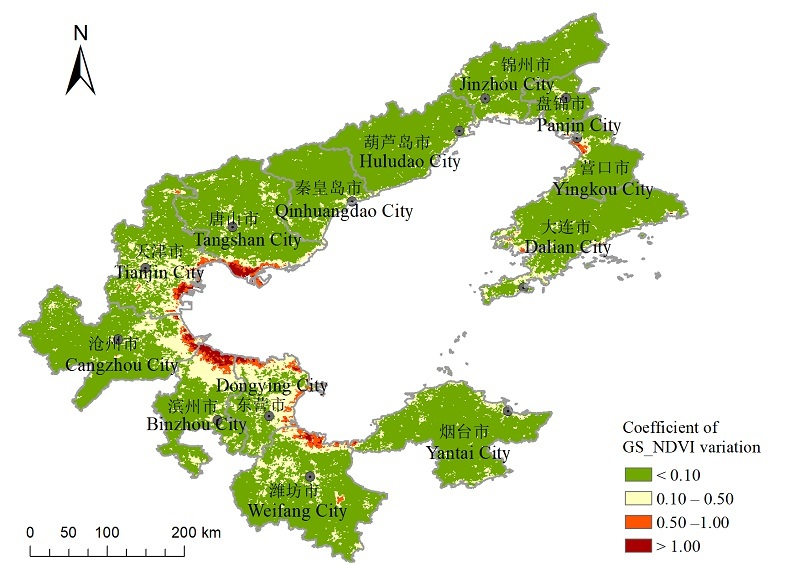
图4 像元尺度下GS_NDVI随时间变化的变异系数
Fig. 4 Coefficient of GS_NDVI variation at pixel scale
| 变异系数 Cvariation | 分类 Classification | 面积占比/% Area ratio/% |
|---|---|---|
| Cvariation<0.10 | 弱变异 Weak variation | 82.04 |
| 0.10<Cvariation<0.50 | 中等变异 Medium variation | 15.07 |
| 0.50<Cvariation<1.00 | 较强变异 Strong variation | 1.98 |
| Cvariation>1.00 | 强变异 Very strong variation | 0.91 |
表2 不同类别变异系数对应的面积占比
Table 2 The area ratios of different kind of CV
| 变异系数 Cvariation | 分类 Classification | 面积占比/% Area ratio/% |
|---|---|---|
| Cvariation<0.10 | 弱变异 Weak variation | 82.04 |
| 0.10<Cvariation<0.50 | 中等变异 Medium variation | 15.07 |
| 0.50<Cvariation<1.00 | 较强变异 Strong variation | 1.98 |
| Cvariation>1.00 | 强变异 Very strong variation | 0.91 |
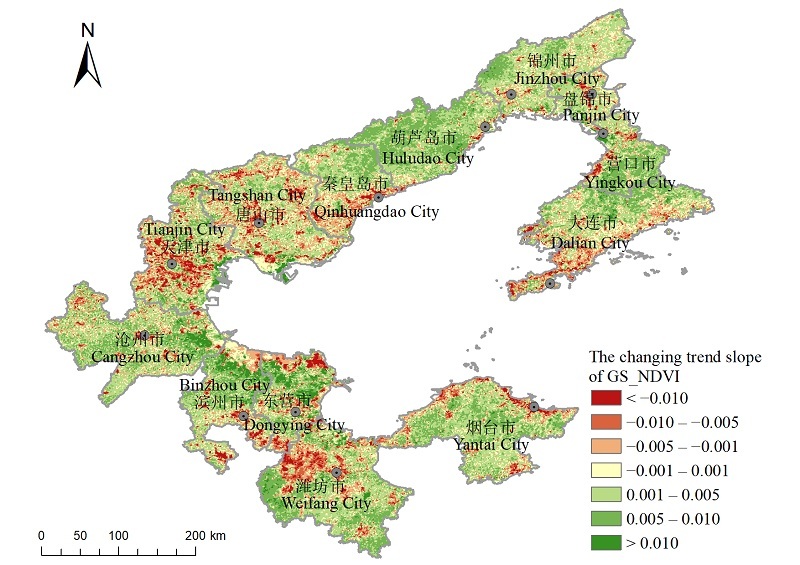
图5 像元尺度下GS_NDVI空间变化趋势
Fig. 5 Spatial changing trend of GS_NDVI at pixel scale
| 变化趋势斜率 Slope of the changing trend | 变化程度 Changing degree | 面积占比 Area ratio/% |
|---|---|---|
| <-0.010 | 明显退化 Obvious degradation | 3.97 |
| -0.010— -0.005 | 中度退化 Medium degradation | 6.96 |
| -0.005— -0.001 | 轻度退化 Light degradation | 13.70 |
| -0.001—0.001 | 基本不变 Unchanged | 13.13 |
| 0.001—0.005 | 轻度改善 Light improvement | 36.23 |
| 0.005—0.010 | 中度改善 Medium improvement | 23.28 |
| >0.010 | 明显改善 Obvious improvement | 2.71 |
表3 变化趋势对应的变化程度、像元面积比例
Table 3 The changing degree and area ratios of different changing trend
| 变化趋势斜率 Slope of the changing trend | 变化程度 Changing degree | 面积占比 Area ratio/% |
|---|---|---|
| <-0.010 | 明显退化 Obvious degradation | 3.97 |
| -0.010— -0.005 | 中度退化 Medium degradation | 6.96 |
| -0.005— -0.001 | 轻度退化 Light degradation | 13.70 |
| -0.001—0.001 | 基本不变 Unchanged | 13.13 |
| 0.001—0.005 | 轻度改善 Light improvement | 36.23 |
| 0.005—0.010 | 中度改善 Medium improvement | 23.28 |
| >0.010 | 明显改善 Obvious improvement | 2.71 |
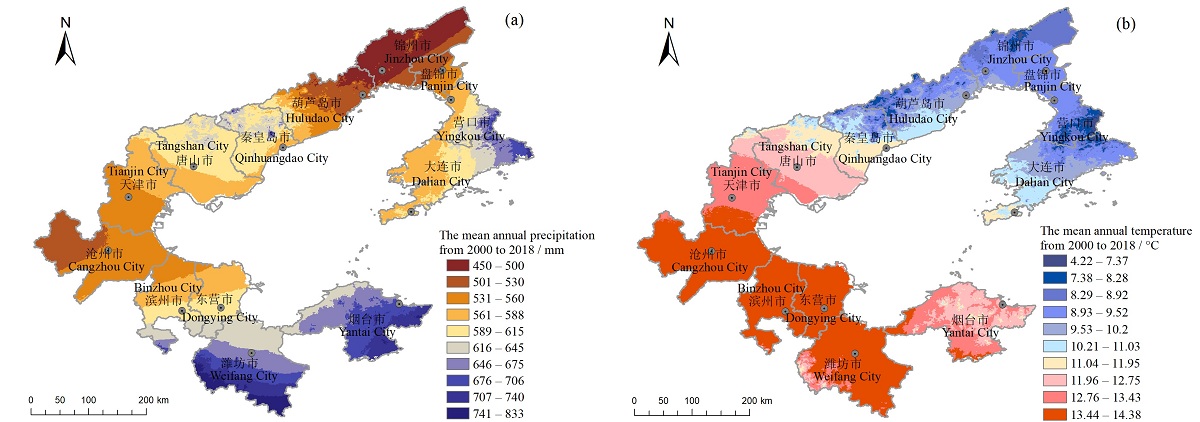
图6 研究区2000—2018年多年平均降水量和气温
Fig. 6 Mean annual precipitation and temperature during the period of 2000 to 2018
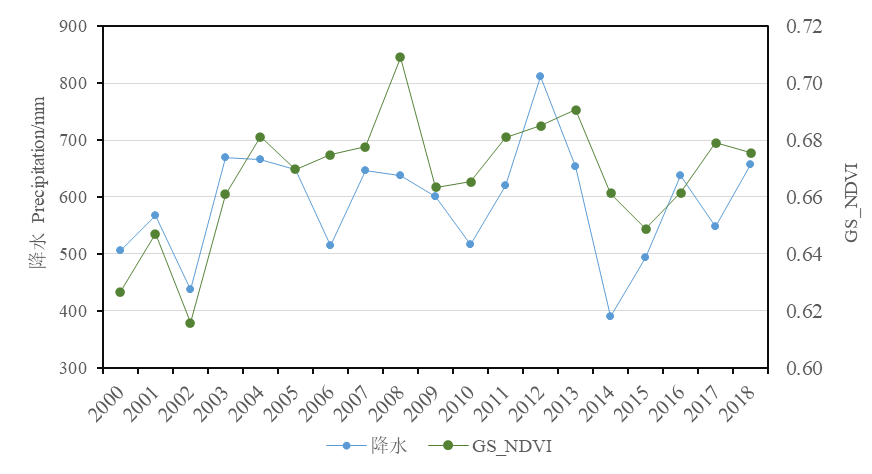
图7 区域尺度环渤海地区降水与GS_NDVI相关关系
Fig. 7 Correlation between GS_NDVI and precipitation at regional scale
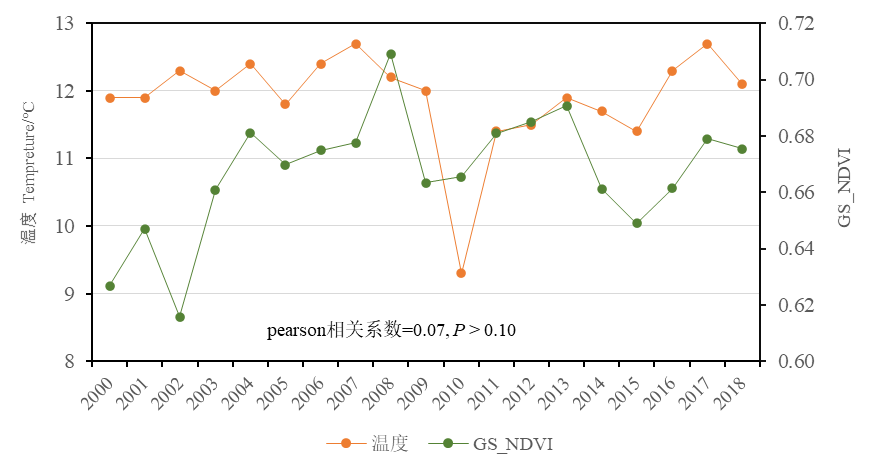
图8 区域尺度环渤海地区气温与GS_NDVI相关关系
Fig. 8 Correlation between GS_NDVI and temperature at regional scale
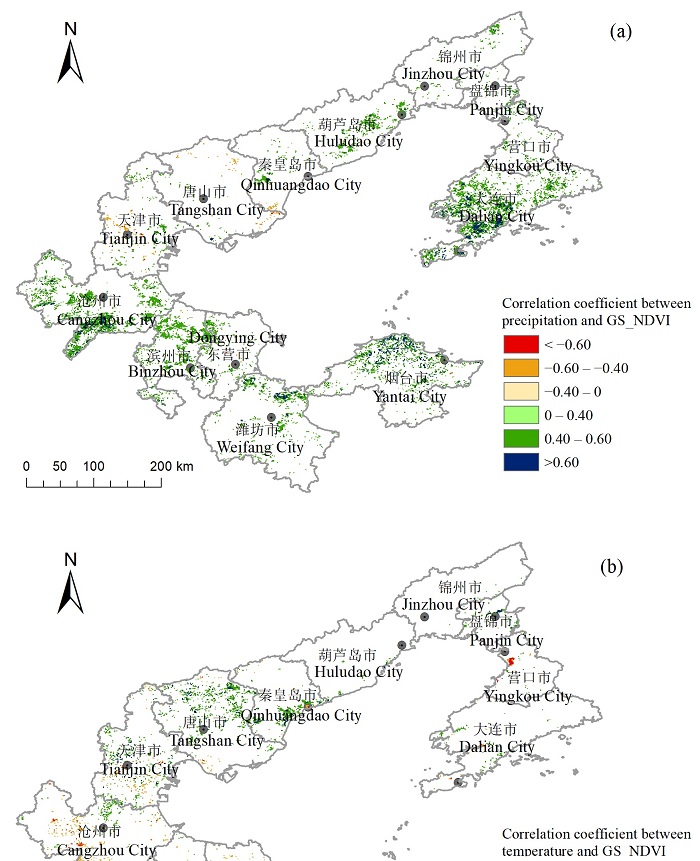
图9 像元尺度降雨、气温与GS_NDVI的相关系数空间分布(P<0.05)
Fig. 9 Spatial distribution of correlation coefficient of GS_NDVI and climate factors at pixel scale
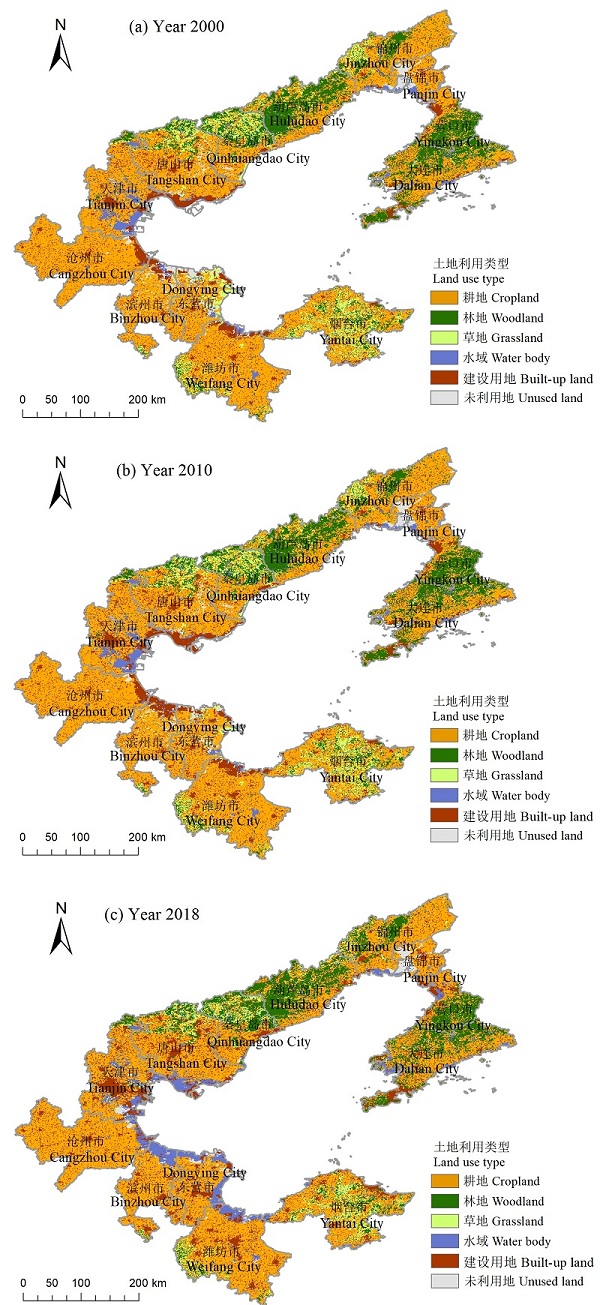
图10 研究区2000、2010、2018年土地利用类型空间分布
Fig. 10 Spatial distribution of land use at 2000, 2010 and 2018
| 土地利用类型 Land use type | 2000年 Year 2000 | 2010年 Year 2010 | 2018年 Year 2018 | |||||
|---|---|---|---|---|---|---|---|---|
| 面积 Area/ km2 | 面积占比 Area ratio/ % | 面积 Area/ km2 | 面积占比 Area ratio/ % | 面积 Area/ km2 | 面积占比 Area ratio/ % | |||
| 耕地 Cropland | 77237 | 57.01 | 76638 | 56.57 | 73565 | 54.30 | ||
| 林地 Woodland | 20679 | 15.26 | 20608 | 15.21 | 20652 | 15.24 | ||
| 草地 Grassland | 9902 | 7.31 | 9170 | 6.77 | 6851 | 5.06 | ||
| 水域 Water body | 6915 | 5.10 | 7005 | 5.17 | 11128 | 8.21 | ||
| 建设用地 Built-up land | 16076 | 11.87 | 18368 | 13.56 | 21214 | 15.66 | ||
| 未利用地 Unused land | 3327 | 2.46 | 2743 | 2.02 | 2073 | 1.53 | ||
表4 2000、2010、2018年环渤海地区土地利用类型面积及占比
Table 4 Areas and ratios of different land use types in 2000, 2010 and 2018
| 土地利用类型 Land use type | 2000年 Year 2000 | 2010年 Year 2010 | 2018年 Year 2018 | |||||
|---|---|---|---|---|---|---|---|---|
| 面积 Area/ km2 | 面积占比 Area ratio/ % | 面积 Area/ km2 | 面积占比 Area ratio/ % | 面积 Area/ km2 | 面积占比 Area ratio/ % | |||
| 耕地 Cropland | 77237 | 57.01 | 76638 | 56.57 | 73565 | 54.30 | ||
| 林地 Woodland | 20679 | 15.26 | 20608 | 15.21 | 20652 | 15.24 | ||
| 草地 Grassland | 9902 | 7.31 | 9170 | 6.77 | 6851 | 5.06 | ||
| 水域 Water body | 6915 | 5.10 | 7005 | 5.17 | 11128 | 8.21 | ||
| 建设用地 Built-up land | 16076 | 11.87 | 18368 | 13.56 | 21214 | 15.66 | ||
| 未利用地 Unused land | 3327 | 2.46 | 2743 | 2.02 | 2073 | 1.53 | ||
| 土地利用类型 Land use type | 2018年 Year 2018 | |||||||
|---|---|---|---|---|---|---|---|---|
| 耕地 Cropland | 林地 Woodland | 草地 Grassland | 水域 Water body | 建设用地 Built-up land | 未利用地 Unused land | 总计 Total | ||
| 2000年 Year 2000 | 耕地 Cropland | 59360 | 4550 | 2143 | 2630 | 10723 | 305 | 79712 |
| 林地 Woodland | 4467 | 13069 | 1432 | 395 | 1099 | 20 | 20483 | |
| 草地 Grassland | 3123 | 2234 | 2486 | 752 | 765 | 218 | 9579 | |
| 水域 Water body | 1911 | 325 | 249 | 2530 | 935 | 465 | 6415 | |
| 建设用地 Built-up land | 5933 | 434 | 279 | 2811 | 4349 | 112 | 13919 | |
| 未利用地 Unused land | 1092 | 26 | 49 | 834 | 299 | 873 | 3173 | |
| 总计 Total | 75887 | 20639 | 6637 | 9953 | 18172 | 1993 | 133280 | |
表5 2000—2018年研究区土地利用转移矩阵
Table 5 Transitions of the land use during 2000—2018 km2
| 土地利用类型 Land use type | 2018年 Year 2018 | |||||||
|---|---|---|---|---|---|---|---|---|
| 耕地 Cropland | 林地 Woodland | 草地 Grassland | 水域 Water body | 建设用地 Built-up land | 未利用地 Unused land | 总计 Total | ||
| 2000年 Year 2000 | 耕地 Cropland | 59360 | 4550 | 2143 | 2630 | 10723 | 305 | 79712 |
| 林地 Woodland | 4467 | 13069 | 1432 | 395 | 1099 | 20 | 20483 | |
| 草地 Grassland | 3123 | 2234 | 2486 | 752 | 765 | 218 | 9579 | |
| 水域 Water body | 1911 | 325 | 249 | 2530 | 935 | 465 | 6415 | |
| 建设用地 Built-up land | 5933 | 434 | 279 | 2811 | 4349 | 112 | 13919 | |
| 未利用地 Unused land | 1092 | 26 | 49 | 834 | 299 | 873 | 3173 | |
| 总计 Total | 75887 | 20639 | 6637 | 9953 | 18172 | 1993 | 133280 | |
| GS_NDVI变化程度 Changing degree of GS_NDVI | 土地利用变化 (2000—2018年) Land use change (Year 2000 to 2018) | 占该类像元比例 Proportion of pixels in corresponding class/% |
|---|---|---|
| 明显退化 Obvious degradation | 耕地→建设用地 Cropland→Built-up land | 26.94 |
| 耕地→耕地 Cropland→Cropland | 24.12 | |
| 中度退化 Medium degradation | 耕地→耕地 Cropland→Cropland | 33.13 |
| 耕地→建设用地 Cropland→built-up land | 19.43 | |
| 轻度退化 Light degradation | 耕地→耕地 Cropland→Cropland | 42.64 |
| 耕地→建设用地 Cropland→built-up land | 12.20 | |
| 基本不变 Unchanged | 耕地→耕地 Cropland→Cropland | 45.78 |
| 耕地→建设用地 Cropland→Built-up land | 9.03 | |
| 轻度改善 Light improvement | 耕地→耕地 Cropland→Cropland | 46.41 |
| 林地→林地 Woodland→Woodland | 9.02 | |
| 中度改善 Medium improvement | 耕地→耕地 Cropland→Cropland | 35.07 |
| 林地→林地 Woodland→Woodland | 21.84 | |
| 明显改善 Obvious improvement | 耕地→耕地 Cropland→Cropland | 36.53 |
| 建设用地→建设用地 Built-up land→Built-up land | 6.56 |
表6 不同变化趋势的像元对应的主要土地利用类型及其变化(2000—2018年)
Table 6 The main types of land use and the ratios corresponded by pixels with different kinds of changing trend from 2000 to 2018
| GS_NDVI变化程度 Changing degree of GS_NDVI | 土地利用变化 (2000—2018年) Land use change (Year 2000 to 2018) | 占该类像元比例 Proportion of pixels in corresponding class/% |
|---|---|---|
| 明显退化 Obvious degradation | 耕地→建设用地 Cropland→Built-up land | 26.94 |
| 耕地→耕地 Cropland→Cropland | 24.12 | |
| 中度退化 Medium degradation | 耕地→耕地 Cropland→Cropland | 33.13 |
| 耕地→建设用地 Cropland→built-up land | 19.43 | |
| 轻度退化 Light degradation | 耕地→耕地 Cropland→Cropland | 42.64 |
| 耕地→建设用地 Cropland→built-up land | 12.20 | |
| 基本不变 Unchanged | 耕地→耕地 Cropland→Cropland | 45.78 |
| 耕地→建设用地 Cropland→Built-up land | 9.03 | |
| 轻度改善 Light improvement | 耕地→耕地 Cropland→Cropland | 46.41 |
| 林地→林地 Woodland→Woodland | 9.02 | |
| 中度改善 Medium improvement | 耕地→耕地 Cropland→Cropland | 35.07 |
| 林地→林地 Woodland→Woodland | 21.84 | |
| 明显改善 Obvious improvement | 耕地→耕地 Cropland→Cropland | 36.53 |
| 建设用地→建设用地 Built-up land→Built-up land | 6.56 |
| [1] |
HE B, CHEN A F, JIANG W G, et al., 2017. The response of vegetation growth to shifts in trend of temperature in China[J]. Journal of Geographical Sciences, 27(7): 801-816.
DOI URL |
| [2] |
MUNKHNASAN L, LEE W K, SEONG W J, et al., 2018. Long-term trend and correlation between vegetation greenness and climate variables in Asia based on satellite data[J]. Science of the Total Environment, 618(1): 1089-1095.
DOI URL |
| [3] | LIU H Y, ZHANG M Y, LIN Z L, et al., 2018. Spatial heterogeneity of the relationship between vegetation dynamics and climate change and their driving forces at multiple time scales in Southwest China[J]. Agricultural & Forest Meteorology, 56-257: 10-21. |
| [4] |
LIU R, XIAO L L, LIU Z, et al., 2018. Quantifying the relative impacts of climate and human activities on vegetation changes at the regional scale[J]. Ecological Indicators, 93: 91-99.
DOI URL |
| [5] |
XIAO L L, YANG X H, CHEN S X, et al., 2015. An assessment of erosivity distribution and its influence on the effectiveness of land use conversion for reducing soil erosion in Jiangxi, China[J]. Catena, 125: 50-60.
DOI URL |
| [6] |
ZHANG Y, ZHANG C B, WANG Z Q, et al., 2016. Vegetation dynamics and its driving forces from climate change and human activities in the Three-River Source Region, China from 1982 to 2012 [J]. Science of the Total Environment, 563-564: 210-220.
DOI URL |
| [7] | ZHAO L, DAI A G, DONG B, 2018. Changes in global vegetation activity and its driving factors during 1982-2013 [J]. Agricultural & Forest Meteorology, 249: 198-209. |
| [8] |
白建军, 白江涛, 王磊, 2014. 2000-2010年陕北地区植被NDVI时空变化及其与区域气候的关系[J]. 地理科学, 34(7): 882-888.
DOI |
| BAI J J, BAI J T, WANG L, 2014. Spatio-temporal Change of Vegetation NDVI and Its Relations with Regional Climate in Northern Shaanxi Province in 2000-2010 [J]. Scientia Geographica Sinica, 34(7): 882-888. | |
| [9] | 李景保, 蔡炳华, 李敏, 2001. 论人类活动方式对土壤侵蚀的效应--以湖南省为例[J]. 热带地理, 21(2): 108-112. |
| LI J B, CAO B H, LI M, 2001. A study on the effect of the way of human activities to soil erosion: Taking Hunan province as an example[J]. Tropical Geography, 21(2): 108-112. | |
| [10] | 李双双, 延军平, 万佳, 2012. 近10年陕甘宁黄土高原区植被覆盖时空变化特征[J]. 地理学报, 67(7): 960-970. |
| LI S S, YAN J P, WAN J, 2012. The spatial-temporal changes of vegetation restoration on Loess Plateau in Shaanxi-Gansu-Ningxia Region[J]. Acta Geographica Sinica, 67(7): 960-970. | |
| [11] | 梁守真, 禹定峰, 王猛, 等, 2015. 应用遥感时序数据研究植被变化与气候因子的关系--以环渤海地区为例[J]. 国土资源遥感, 27(3): 114-121. |
| LIANG S Z, YU D F, WANG M, et al., 2015. Application of remote sensing time-series data to investigate the relationship between vegetation change and climatic factors: A case study of Circum-Bohai Sea area[J]. Remote Sensing for Land and Resources, 27(3): 114-121. | |
| [12] | 刘纪远, 邓祥征, 2009. LUCC时空过程研究的方法进展[J]. 科学通报, 54(21): 3251-3258. |
| LIU J Y, DENG X Z, 2009. Research progress of LUCC spatio-temporal process[J]. Chinese Science Bulletin, 54(21): 3251-3258. | |
| [13] | 刘家福, 马帅, 李帅, 等, 2018. 1982-2016年东北黑土区植被NDVI动态及其对气候变化的响应[J]. 生态学报, 38(21): 7647-7657. |
| LIU J F, MA S, LI S, et al., 2018. Changes in vegetation NDVI from 1982 to 2016 and its responses to climate change in the black-soil area of Northeast China[J]. Acta Ecologica Sinica, 38(21): 7647-7657. | |
| [14] |
刘宪锋, 潘耀忠, 朱秀芳, 等, 2015. 2000-2014年秦巴山区植被覆盖时空变化特征及其归因[J]. 地理学报, 70(5): 705-716.
DOI |
| LIU X F, PAN Y Z, ZHU X F, et al., 2015. Spatiotemporal variation of vegetation coverage in Qinling-Daba Mountains in relation to environmental factors[J]. Acta Geographica Sinica, 70(5): 705-716. | |
| [15] |
刘彦随, 杨忍, 2015. 中国环渤海地区城乡发展转型格局测度[J]. 地理学报, 70(2): 248-256.
DOI |
| LIU Y S, YANG R, 2015. The spatial pattern measure of urban-rural development transformation in the Bohai Rim region in China[J]. Acta Geographica Sinica, 70(2): 248-256. | |
| [16] | 麻馨月, 杨洋, 娄成武, 2016. 21世纪以来环渤海地区耕地生产潜力时空动态[J]. 中国人口·资源与环境, 26(S1): 226-231. |
| MA X Y, YANG Y, LOU C W, 2016. Spatiotemporal Dynamics of Cultivated Land Potential Productivity in Bohai Rim since the 21st Century[J]. China Population, Resources And Environment, 26(S1): 226-231. | |
| [17] | 穆少杰, 李建龙, 陈奕兆, 等, 2012. 2001-2010年内蒙古植被覆盖度时空变化特征[J]. 地理学报, 67(9): 1255-1268. |
| MU S J, LI J L, CHEN Y Z, et al., 2012. Spatial Differences of Variations of Vegetation Coverage in Inner Mongolia during 2001-2010 [J]. Acta Geographica Sinica, 67(9): 1255-1268. | |
| [18] |
彭文甫, 张冬梅, 罗艳玫, 等, 2019. 自然因子对四川植被NDVI变化的地理探测[J]. 地理学报, 74(9): 1758-1776.
DOI |
| PENG W F, ZHANG D M, LUO Y M, et al., 2019. Influence of natural factors on vegetation NDVI using geographical detection in Sichuan Province[J]. Acta Geographica Sinica, 74(9): 1758-1776. | |
| [19] | 齐亚霄, 张飞, 陈瑞, 等, 2020. 2001-2015年天山北坡植被覆盖动态变化研究[J]. 生态学报, 40(11):3677-3687. |
| QI Y X, ZHANG F, CHEN R, et al., 2020. Vegetation coverage dynamics in northern slope of Tianshan Mountains from 2001 to 2015 [J]. Acta Ecologica Sinica, 40(11):3677-3687. | |
| [20] | 万昌君, 吴小丹, 林兴稳, 2019. 遥感数据时空尺度对地理要素时空变化分析的影响[J]. 遥感学报, 23(6): 1064-1077. |
| WAN C J, WU X D, LIN X W, 2019. Impact of spatial and temporal scales of remote sensing data on the spatiotemporal change in geographic elements[J]. Journal of Remote Sensing, 23(6): 1064-1077. | |
| [21] | 王丽霞, 余东洋, 刘招, 2019. 渭河流域NDVI与气候因子时空变化及相关性研究[J]. 水土保持研究, 26(2): 249-254. |
| WANG L X, YU D Y, LIU Z, 2019. Study on tempo-spatial variations of NDVI and climate factors and their correlation in the Weihe watershed[J]. Research of Soil And Water Conservation, 26(2): 249-254. | |
| [22] | 王晓利, 张春艳, 侯西勇, 2019. 1961-2017年环渤海地区气象干旱时空特征及致灾危险性评估[J]. 生态学报, 39(13): 4647-4659. |
| WANG X L, ZHANG C Y, HOU X Y, 2019. Spatial-temporal characteristics and hazard risks of meteorological drought in Circum-Bohai-Sea region from 1961 to 2017 [J]. Acta Ecologica Sinica, 39(13): 4647-4659. | |
| [23] | 魏榕, 刘冀, 张特, 等, 2021. 雅砻江流域生长季植被时空变化特征及对气象因子的响应分析[J]. 生态环境学报, 30(3): 512-522. |
| WEI R, LIU J, ZHANG T, et al., 2021. Analysis of vegetation spatiotemporal variation characteristics and response to meteorological factors in the growing Season in Yalong River basin[J]. Ecology and Environmental Sciences, 30(3): 512-522. | |
| [24] | 毋亭, 张勇, 侯西勇, 2014. 基于半变异函数的环渤海地区NDVI空间格局特征研究[J]. 生态科学, 33(2): 313-320. |
| WU T, ZHANG Y, HOU X Y, 2014. Analysis of spatial patterns of NDVI over the Circum-Bohai Sea region based on semi-variogram[J]. Ecological Science, 33(2): 313-320. | |
| [25] | 徐勇, 徐小任, 汤青, 2016. 陆地表层人类活动强度--概念、方法及应用[J]. 地理学报, 26(9): 1349-1361. |
| XU Y, SUN X Y, TANG Q, 2016. Human activity intensity of land surface: Concept, method and application in China[J]. Acta Geographica Sinica, 26(9): 1349-1361. | |
| [26] | 闫赛佳, 吴志伟, 付婧婧, 等, 2020. 基于不同空间尺度的林火面积分布格局--以江西省为例[J]. 生态学杂志, 39(7): 2327-2336. |
| YAN S J, WU Z W, FU J J, et al., 2020. Multiple spatial-scale analysis on the distribution patterns of forest burned areas: A case study of Jiangxi Province[J]. Chinese Journal of Ecology, 39(7): 2327-2336. | |
| [27] | 杨波, 王全九, 许晓婷, 等, 2019. 还林还草工程后榆林市NDVI时空变化趋势[J]. 生态学杂志, 38(6): 1839-1848. |
| YANG B, WANG Q J, XU X T, et al., 2019. NDVI spatiotemporal variation in Yulin after grain for green project[J]. Chinese Journal of Ecology, 38(6): 1839-1848. | |
| [28] |
杨忍, 刘彦随, 龙花楼, 等, 2015. 基于格网的农村居民点用地时空特征及空间指向性的地理要素识别--以环渤海地区为例[J]. 地理研究, 34(6): 1077-1087.
DOI |
|
YANG R, LIU Y S, LONG H L, et al., 2015. Spatial-temporal characteristics of rural residential land use change and spatial directivity identification based on grid in the Bohai Rim in China[J]. Geographical Research, 34(6): 1077-1087.
DOI |
|
| [29] | 杨洋, 黄庆旭, 章立玲, 2015. 基于DMSP/OLS夜间灯光数据的土地城镇化水平时空测度研究--以环渤海地区为例[J]. 经济地理, 35(2): 141-148, 168. |
| YANG Y, HUANG Q X, ZHANG L L, 2015. The spatial-temporal measurement on the land urbanization level using DMSP/OLS nighttime light data: A case study of Bohai Rim[J]. Economic Geography, 35(2): 141-148, 168. | |
| [30] | 于泉洲, 梁春玲, 刘煜杰, 等, 2015. 基于MODIS的山东省植被覆盖时空变化及其原因分析[J]. 生态环境学报, 24(11): 1799-1807. |
| YU Q Z, LIANG C L, LIU Y J, et al., 2015. Analysis of Vegetation Spatio-temporal Variation and Driving Factors in Shandong Province Based on MODIS[J]. Ecology and Environmental Sciences, 24(11): 1799-1807. | |
| [31] | 朱长明, 李均力, 沈占锋, 等, 2019. 基于MODIS密集时间序列数据的塔里木河下游植被活动过程监测[J]. 资源科学, 41(3): 591-600. |
| ZHU C M, LI J L, SHEN Z F, et al., 2019. Spatiotemporal dynamics of vegetation activities in the lower reach of the Tarim River based on MODIS intensive time series data[J]. Resources Science, 41(3): 591-600. |
| [1] | 王雪梅, 杨雪峰, 赵枫, 安柏耸, 黄晓宇. 基于机器学习算法的干旱区绿洲地上生物量估算[J]. 生态环境学报, 2023, 32(6): 1007-1015. |
| [2] | 郝蕾, 翟涌光, 戚文超, 兰穹穹. 2001-2020年内蒙古植被碳源/碳汇时空动态及对气候因子的响应[J]. 生态环境学报, 2023, 32(5): 825-834. |
| [3] | 巫晨煜, 许帆帆, 魏士博, 樊晶晶, 刘观鹏, 王坤. 渭河流域地表植被覆盖对气候变化的响应研究[J]. 生态环境学报, 2023, 32(5): 835-844. |
| [4] | 陈俊芳, 吴宪, 刘啸林, 刘娟, 杨佳绒, 刘宇. 不同土壤水分下元素化学计量对微生物多样性的塑造特征[J]. 生态环境学报, 2023, 32(5): 898-909. |
| [5] | 李晖, 李必龙, 葛黎黎, 韩琛惠, 杨倩, 张岳军. 2000-2021年汾河流域植被时空演变特征及地形效应[J]. 生态环境学报, 2023, 32(3): 439-449. |
| [6] | 贾志峰, 刘鹏程, 刘宇, 吴博博, 陈丹姿, 张向飞. 气候变化和人类活动对松辽流域植被覆盖的影响[J]. 生态环境学报, 2023, 32(1): 1-10. |
| [7] | 阮惠华, 许剑辉, 张菲菲. 2001—2020年粤港澳大湾区植被和地表温度时空变化研究[J]. 生态环境学报, 2022, 31(8): 1510-1520. |
| [8] | 齐月, 张强, 胡淑娟, 蔡迪花, 赵福年, 陈斐, 张凯, 王鹤龄, 王润元. 黄土高原地区气候变化及其对冬小麦生产潜力的影响[J]. 生态环境学报, 2022, 31(8): 1521-1529. |
| [9] | 邓天乐, 谢立勇, 张凤哲, 赵洪亮, 蒋语童. CO2浓度升高条件下稗草与水稻生长空间竞争关系研究[J]. 生态环境学报, 2022, 31(8): 1566-1572. |
| [10] | 卢燕宇, 孙维, 方砚秋, 唐为安, 邓汗青, 何冬燕. 基于种植结构的安徽省气候生产潜力估算及粮食安全气候承载力分析[J]. 生态环境学报, 2022, 31(7): 1293-1305. |
| [11] | 李登科, 王钊. 气候变化和人类活动对陕西省植被NPP影响的定量分析[J]. 生态环境学报, 2022, 31(6): 1071-1079. |
| [12] | 曹晓云, 祝存兄, 陈国茜, 孙树娇, 赵慧芳, 朱文彬, 周秉荣. 2000—2021年柴达木盆地地表绿度变化及地形分异研究[J]. 生态环境学报, 2022, 31(6): 1080-1090. |
| [13] | 石智宇, 王雅婷, 赵清, 张连蓬, 朱长明. 2001-2020年中国植被净初级生产力时空变化及其驱动机制分析[J]. 生态环境学报, 2022, 31(11): 2111-2123. |
| [14] | 刘秉儒. 土壤微生物呼吸热适应性与微生物群落及多样性对全球气候变化响应研究[J]. 生态环境学报, 2022, 31(1): 181-186. |
| [15] | 聂桐, 董国涛, 蒋晓辉, 郭欣伟, 党素珍, 郑嘉昊, 李立缠, 王江. 榆林地区植被时空分异特征及其影响因素研究[J]. 生态环境学报, 2022, 31(1): 26-36. |
| 阅读次数 | ||||||
|
全文 |
|
|||||
|
摘要 |
|
|||||