生态环境学报 ›› 2023, Vol. 32 ›› Issue (1): 110-122.DOI: 10.16258/j.cnki.1674-5906.2023.01.012
付蓉1( ), 武新梅2, 陈斌3,*
收稿日期:2022-09-19
出版日期:2023-01-18
发布日期:2023-04-06
通讯作者:
*作者简介:付蓉(1992年生),女,硕士研究生,研究方向为资源环境遥感与GIS分析。E-mail: 1025780235@qq.com
基金资助:
FU Rong1(), WU Xinmei2, CHEN Bin3,*
Received:2022-09-19
Online:2023-01-18
Published:2023-04-06
摘要:
近年来合肥市发展迅速,不透水面、建筑密度的迅速增加加剧了城市热岛效应。研究城市地表温度的空间分异性及驱动因素对城市规划和生态环境的改善有重要意义。然而目前对城市地表温度的研究仍存在空间分异探讨较少、单一因子解释力度不够、驱动因子交互影响研究不多等问题。利用2020年9月MOD11A2遥感影像,选取气压、相对湿度、短波辐射、DEM、NDVI、人口密度、夜间灯光为驱动因子,对合肥市地表温度的空间分异性及地表温度驱动因子的差异性进行分析。首先将合肥市划分为1 km×1 km的单元网格并提取地表温度和各驱动因子的值,然后利用地理探测器确定该区域地表温度的空间分异性,最后结合广义可加模型对地表温度进行驱动因子分析。结果表明,(1)合肥市地表温度空间分异q值为0.575,各驱动因子空间分异q值均大于0且均通过P<0.01的显著性检验,地表温度和各因子的空间分异性显著。地表温度大致呈现中心高、四周低的空间格局,因此,将研究区域分为高温区和低温区。(2)利用GAM拟合地表温度与驱动因子,得到高温区驱动因子显著性排序为夜间灯光>NDVI>短波辐射>人口密度>相对湿度>DEM>气压;低温区驱动因子显著性排序为NDVI>夜间灯光>短波辐射>人口密度>气压>相对湿度>DEM。(3)高温区和低温区因子交互均在P<0.001水平下显著影响地表温度分布,模型调整后均优于单因素拟合模型,说明因子交互对地表温度影响更大。合肥市高温区和低温区的地表温度的主控因素不同,因子间交互对地表温度的影响更显著,可根据主控因素差异调节热环境,为今后城市发展规划提供参考依据。
中图分类号:
付蓉, 武新梅, 陈斌. 城市地表温度空间分异及驱动因子差异性分析——以合肥市为例[J]. 生态环境学报, 2023, 32(1): 110-122.
FU Rong, WU Xinmei, CHEN Bin. Analysis on the Spatial Stratified Heterogeneity and Driving Factors Differences of the Urban Land Surface Temperature: A Case Study of Hefei[J]. Ecology and Environment, 2023, 32(1): 110-122.
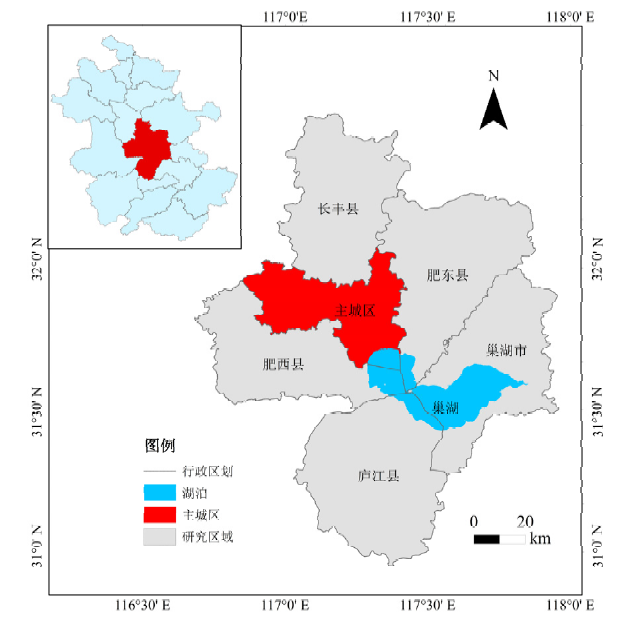
图1 研究区示意图 上图基于合肥市自然资源和规划局标准地图下载的审图号为晥合肥S(2021)3号标准地图制作,底图无修改
Figure 1 Schematic map of Hefei
| 数据 | 数据简记 | 时间分辨率 | 空间分辨率 | 数据来源 |
|---|---|---|---|---|
| 地表温度 | LST | 8 d | 1 km | NASA ( |
| 归一化植被指数 | NDVI | 16 d | 1 km | NASA ( |
| 数字高程模型 | DEM | — | 30 m | USGS ( |
| 人口密度 | DP | — | 1 km | 美国能源部橡树岭国家实验室 ( |
| 夜间灯光 | NL | 1 m | 0.5 km | 国家青藏高原科学数据中心 ( |
| 相对湿度 | RH | 1 m | 1 km | 国家科技基础条件平台—国家地球系统科学数据中心 ( |
| 气压 | AP | 1 d | 0.0625(°) | 国家气象科学数据中心 ( CLDAS-V2.0数据集 |
| 短波辐射 | SR | 1 d |
表1 研究数据
Table 1 Research data
| 数据 | 数据简记 | 时间分辨率 | 空间分辨率 | 数据来源 |
|---|---|---|---|---|
| 地表温度 | LST | 8 d | 1 km | NASA ( |
| 归一化植被指数 | NDVI | 16 d | 1 km | NASA ( |
| 数字高程模型 | DEM | — | 30 m | USGS ( |
| 人口密度 | DP | — | 1 km | 美国能源部橡树岭国家实验室 ( |
| 夜间灯光 | NL | 1 m | 0.5 km | 国家青藏高原科学数据中心 ( |
| 相对湿度 | RH | 1 m | 1 km | 国家科技基础条件平台—国家地球系统科学数据中心 ( |
| 气压 | AP | 1 d | 0.0625(°) | 国家气象科学数据中心 ( CLDAS-V2.0数据集 |
| 短波辐射 | SR | 1 d |
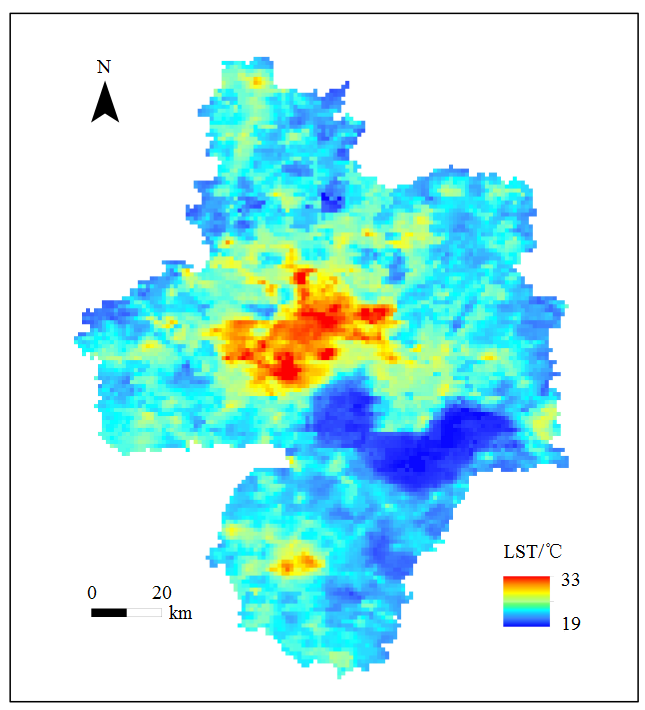
图2 2020年9月LST分布图
Figure 2 LST distribution map in September 2020
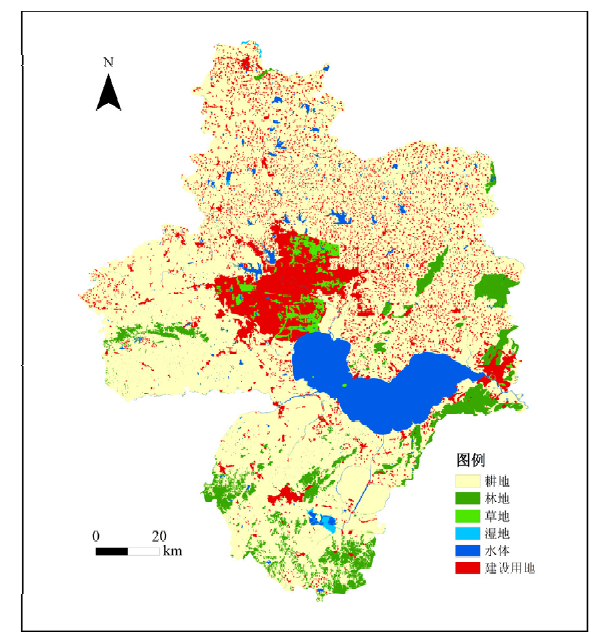
图3 2020年合肥市土地利用分类图 数据来源:国家基础地理信息中心全球地表覆盖数据产品服务网站
Figure 3 Land use classification map of Hefei in 2020

图4 LST与各因子的空间分异图
Figure 4 Spatial differentiation maps of LST and factors
| 指标 | 地表温度 | 气压 | 相对湿度 | 短波辐射 | 夜间灯光 | 人口密度 | 归一化植被指数 | 高程 |
|---|---|---|---|---|---|---|---|---|
| q | 0.575 | 0.554 | 0.397 | 0.758 | 0.605 | 0.32 | 0.65 | 0.337 |
| P | <0.01 | |||||||
表2 LST及各因子空间分异值
Table 2 The q values of LST and each factor
| 指标 | 地表温度 | 气压 | 相对湿度 | 短波辐射 | 夜间灯光 | 人口密度 | 归一化植被指数 | 高程 |
|---|---|---|---|---|---|---|---|---|
| q | 0.575 | 0.554 | 0.397 | 0.758 | 0.605 | 0.32 | 0.65 | 0.337 |
| P | <0.01 | |||||||
| 模型 | 修正决定r2 | 偏差解释率 | GCV值 | AIC值 |
|---|---|---|---|---|
| g(x) | 0.772 | 77.7% | 0.739 | 6198.62 |
| g1(x) | 0.771 | 77.4% | 0.742 | 6208.95 |
| g2(x) | 0.759 | 76.3% | 0.782 | 6335.66 |
| g3(x) | 0.770 | 77.4% | 0.746 | 6222.04 |
| g4(x) | 0.763 | 76.7% | 0.768 | 6290.55 |
| g5(x) | 0.688 | 69.3% | 1.011 | 6962.92 |
| g6(x) | 0.769 | 77.3% | 0.748 | 6227.12 |
| g7(x) | 0.737 | 74.2% | 0.852 | 6545.90 |
表3 各模型拟合结果
Table 3 Fitting analysis results of models
| 模型 | 修正决定r2 | 偏差解释率 | GCV值 | AIC值 |
|---|---|---|---|---|
| g(x) | 0.772 | 77.7% | 0.739 | 6198.62 |
| g1(x) | 0.771 | 77.4% | 0.742 | 6208.95 |
| g2(x) | 0.759 | 76.3% | 0.782 | 6335.66 |
| g3(x) | 0.770 | 77.4% | 0.746 | 6222.04 |
| g4(x) | 0.763 | 76.7% | 0.768 | 6290.55 |
| g5(x) | 0.688 | 69.3% | 1.011 | 6962.92 |
| g6(x) | 0.769 | 77.3% | 0.748 | 6227.12 |
| g7(x) | 0.737 | 74.2% | 0.852 | 6545.90 |
| 平滑效应项 | 估计自由度 | 参考自由度 | F值 | P值 | 显著性排序 |
|---|---|---|---|---|---|
| AP | 8.058 | 8.771 | 2.725 | 0.00696 | 7 |
| SR | 8.181 | 8.809 | 17.772 | <2×10-16 | 3 |
| RH | 3.129 | 4.000 | 6.415 | 0.00004 | 5 |
| DP | 7.023 | 8.100 | 12.481 | <2×10-16 | 4 |
| NL | 6.029 | 7.213 | 129.351 | <2×10-16 | 1 |
| DEM | 6.67 | 7.664 | 4.700 | 0.00002 | 6 |
| NDVI | 5.691 | 6.902 | 55.814 | <2×10-16 | 2 |
表4 高温区LST与7个因子的GAM拟合结果
Table 4 GAM fitting results of high LST and 7 factors in the high temperature region
| 平滑效应项 | 估计自由度 | 参考自由度 | F值 | P值 | 显著性排序 |
|---|---|---|---|---|---|
| AP | 8.058 | 8.771 | 2.725 | 0.00696 | 7 |
| SR | 8.181 | 8.809 | 17.772 | <2×10-16 | 3 |
| RH | 3.129 | 4.000 | 6.415 | 0.00004 | 5 |
| DP | 7.023 | 8.100 | 12.481 | <2×10-16 | 4 |
| NL | 6.029 | 7.213 | 129.351 | <2×10-16 | 1 |
| DEM | 6.67 | 7.664 | 4.700 | 0.00002 | 6 |
| NDVI | 5.691 | 6.902 | 55.814 | <2×10-16 | 2 |
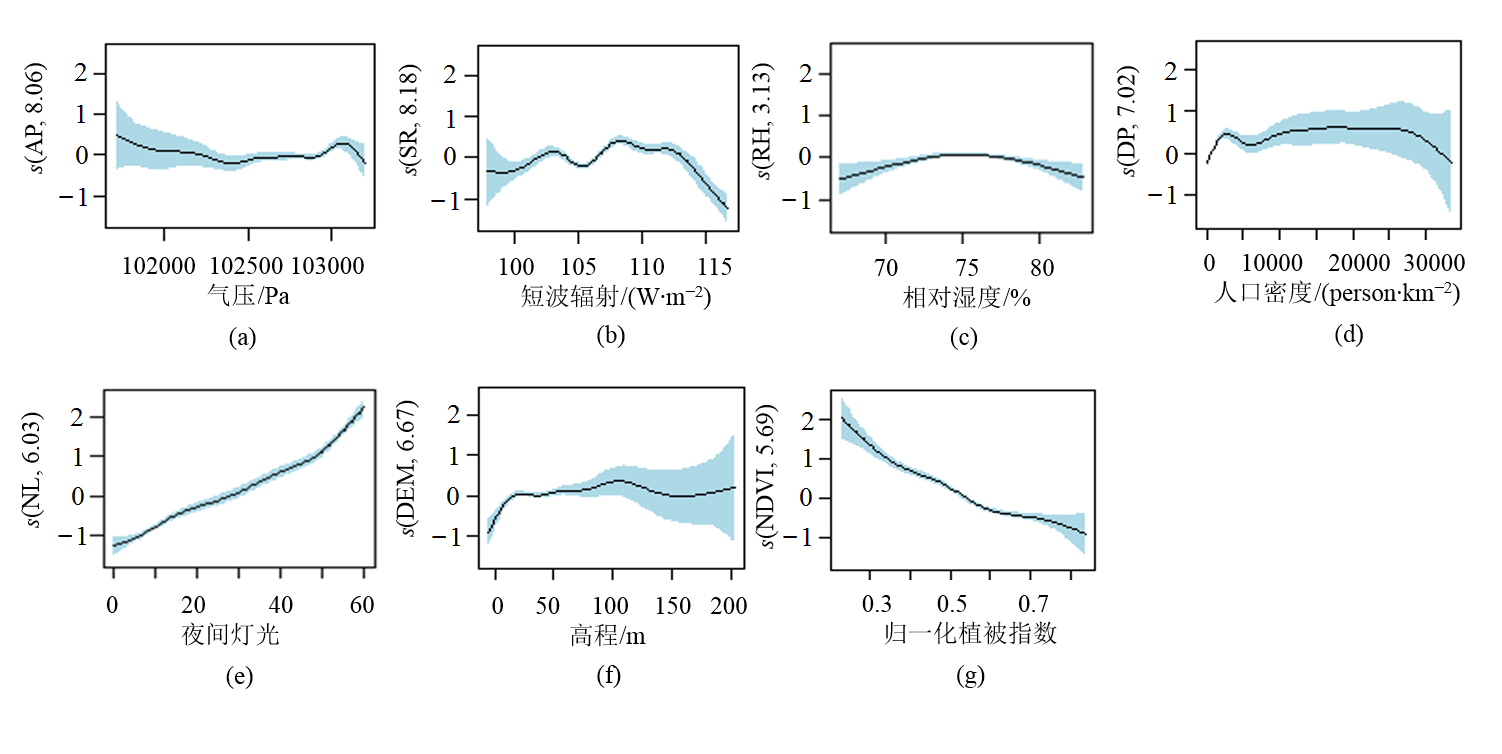
图5 高温区LST与单因子的GAM拟合图 蓝色阴影区域表示可信区间,实线表示LST的平滑拟合曲线,横坐标表示各因子的实测值,纵坐标表示各因子对LST的平滑拟合值,括号内数值表示估计自由度
Figure 5 GAM fitting diagram of LST and single factor in the high temperature region
| 交互项 | 估计自由度 | 参考自由度 | F值 | P值 |
|---|---|---|---|---|
| AP×DP | 8.007 | 9.146 | 19.13 | <2×10-16 |
| AP×SR | 10.441 | 11.923 | 13.39 | <2×10-16 |
| AP×NL | 10.844 | 12.114 | 8.332 | <2×10-16 |
| AP×RH | 12.333 | 13.342 | 40.6 | <2×10-16 |
| AP×DEM | 10.505 | 11.654 | 16.97 | <2×10-16 |
| AP×NDVI | 9.788 | 11.417 | 11.42 | <2×10-16 |
| SR×DP | 7.795 | 9.116 | 27.66 | <2×10-16 |
| SR×NL | 10.183 | 11.929 | 7.047 | <2×10-16 |
| SR×RH | 6.865 | 8.346 | 5.536 | <0.00001 |
| SR×DEM | 9.610 | 11.07 | 17.22 | <2×10-16 |
| SR×NDVI | 7.459 | 9.117 | 25.1 | <2×10-16 |
| DP×NL | 9.313 | 10.723 | 14.9 | <2×10-16 |
| DP×RH | 5.958 | 7.254 | 11.05 | <2×10-16 |
| DP×DEM | 7.052 | 15 | 11.4 | <2×10-16 |
| DP×NDVI | 6.364 | 7.756 | 16.78 | <2×10-16 |
| NL×RH | 8.992 | 11.045 | 4.528 | <0.00001 |
| NL×DEM | 8.564 | 10.221 | 7.949 | <2×10-16 |
| NL×NDVI | 8.707 | 10.852 | 8.717 | <2×10-16 |
| RH×DEM | 8.438 | 10.03 | 6.041 | <2×10-16 |
| RH×NDVI | 9.634 | 11.406 | 7.525 | <2×10-16 |
| DEM×NDVI | 7.715 | 9.19 | 16.3 | <2×10-16 |
表5 高温区LST与影响因子交互作用项的GAM拟合结果
Table 5 GAM fitting results of interaction terms between LST and influencing factors in the high temperature region
| 交互项 | 估计自由度 | 参考自由度 | F值 | P值 |
|---|---|---|---|---|
| AP×DP | 8.007 | 9.146 | 19.13 | <2×10-16 |
| AP×SR | 10.441 | 11.923 | 13.39 | <2×10-16 |
| AP×NL | 10.844 | 12.114 | 8.332 | <2×10-16 |
| AP×RH | 12.333 | 13.342 | 40.6 | <2×10-16 |
| AP×DEM | 10.505 | 11.654 | 16.97 | <2×10-16 |
| AP×NDVI | 9.788 | 11.417 | 11.42 | <2×10-16 |
| SR×DP | 7.795 | 9.116 | 27.66 | <2×10-16 |
| SR×NL | 10.183 | 11.929 | 7.047 | <2×10-16 |
| SR×RH | 6.865 | 8.346 | 5.536 | <0.00001 |
| SR×DEM | 9.610 | 11.07 | 17.22 | <2×10-16 |
| SR×NDVI | 7.459 | 9.117 | 25.1 | <2×10-16 |
| DP×NL | 9.313 | 10.723 | 14.9 | <2×10-16 |
| DP×RH | 5.958 | 7.254 | 11.05 | <2×10-16 |
| DP×DEM | 7.052 | 15 | 11.4 | <2×10-16 |
| DP×NDVI | 6.364 | 7.756 | 16.78 | <2×10-16 |
| NL×RH | 8.992 | 11.045 | 4.528 | <0.00001 |
| NL×DEM | 8.564 | 10.221 | 7.949 | <2×10-16 |
| NL×NDVI | 8.707 | 10.852 | 8.717 | <2×10-16 |
| RH×DEM | 8.438 | 10.03 | 6.041 | <2×10-16 |
| RH×NDVI | 9.634 | 11.406 | 7.525 | <2×10-16 |
| DEM×NDVI | 7.715 | 9.19 | 16.3 | <2×10-16 |

图6 部分影响因子交互项对高温区LST显著性影响的三维效应图
Figure 6 Three-dimensional significant effect diagram of the influence of some interaction terms on LST the high temperature region
| 平滑效应项 | 估计自由度 | 参考自由度 | F值 | P值 | 显著性排序 |
|---|---|---|---|---|---|
| AP | 8.498 | 8.920 | 22.069 | <2×10-16 | 5 |
| SR | 8.418 | 8.902 | 48.090 | <2×10-16 | 3 |
| RH | 4.812 | 6.001 | 16.972 | <2×10-16 | 6 |
| DP | 8.728 | 8.976 | 34.661 | <2×10-16 | 4 |
| NL | 6.954 | 7.972 | 67.440 | <2×10-16 | 2 |
| DEM | 6.787 | 7.816 | 4.903 | <0.0001 | 7 |
| NDVI | 7.781 | 8.617 | 166.857 | <2×10-16 | 1 |
表6 低温区LST与7个因子的GAM拟合结果
Table 6 GAM fitting results of LST and 7 factors the low temperature region
| 平滑效应项 | 估计自由度 | 参考自由度 | F值 | P值 | 显著性排序 |
|---|---|---|---|---|---|
| AP | 8.498 | 8.920 | 22.069 | <2×10-16 | 5 |
| SR | 8.418 | 8.902 | 48.090 | <2×10-16 | 3 |
| RH | 4.812 | 6.001 | 16.972 | <2×10-16 | 6 |
| DP | 8.728 | 8.976 | 34.661 | <2×10-16 | 4 |
| NL | 6.954 | 7.972 | 67.440 | <2×10-16 | 2 |
| DEM | 6.787 | 7.816 | 4.903 | <0.0001 | 7 |
| NDVI | 7.781 | 8.617 | 166.857 | <2×10-16 | 1 |
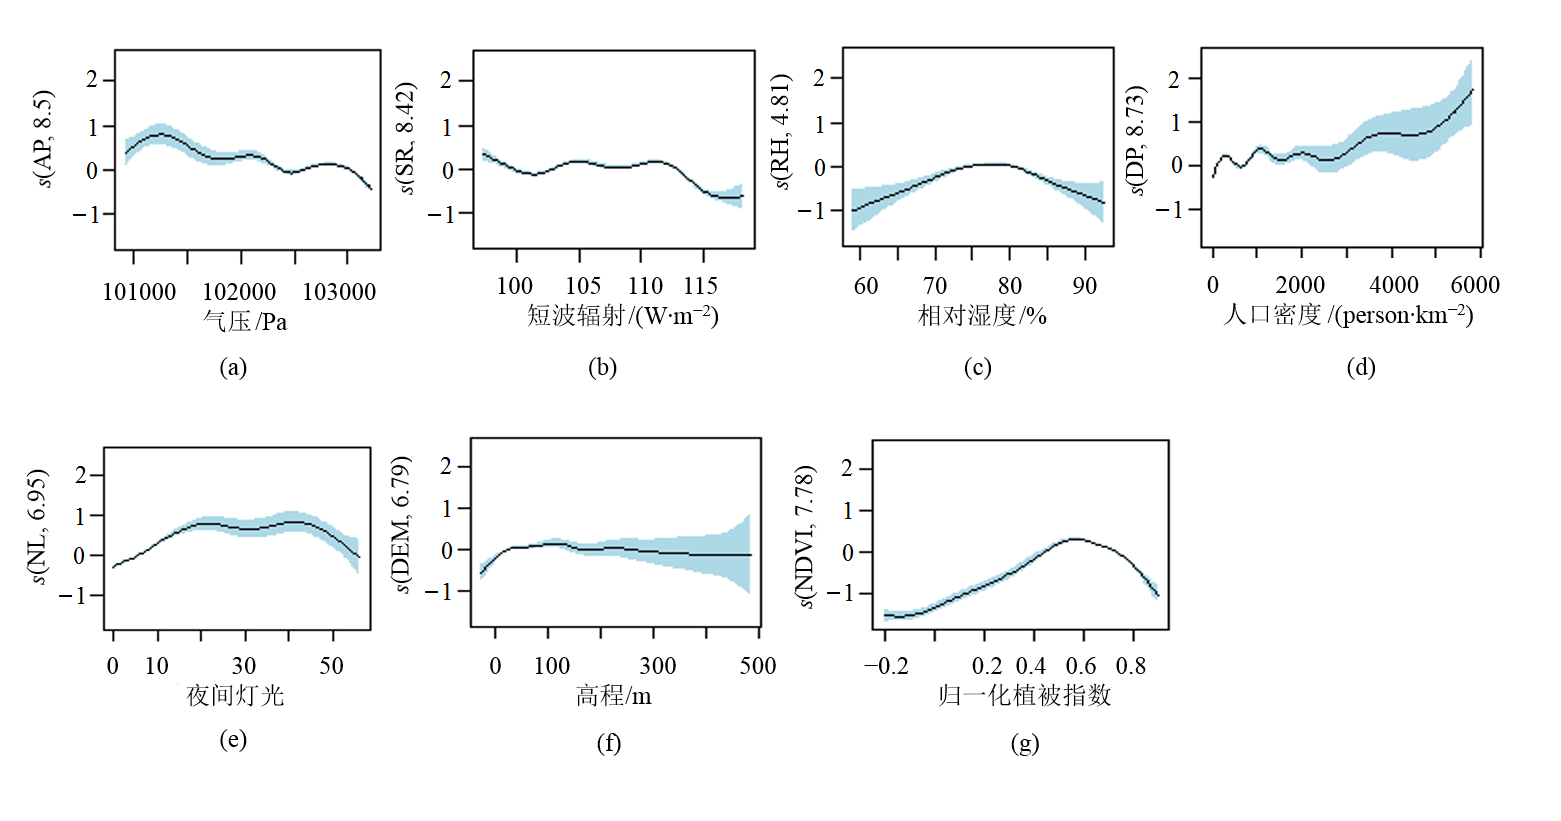
图7 低温区LST与单因子的GAM拟合图
Figure 7 GAM fitting diagram of LST and single factor in the low temperature region
| 交互项 | 估计自由度 | 参考自由度 | F值 | P值 |
|---|---|---|---|---|
| AP×DP | 11.829 | 12.766 | 44.76 | <2×10-16 |
| AP×SR | 15.328 | 15.615 | 30.88 | <2×10-16 |
| AP×NL | 15.873 | 15.992 | 18.91 | <2×10-16 |
| AP×RH | 15.873 | 15.992 | 18.91 | <2×10-16 |
| AP×DEM | 13.997 | 14.273 | 3.251 | 0.0000836 |
| AP×NDVI | 14.689 | 15.436 | 7.433 | <2×10-16 |
| SR×DP | 12.726 | 13.683 | 15.95 | <2×10-16 |
| SR×NL | 13.134 | 13.724 | 41.44 | <2×10-16 |
| SR×RH | 14.677 | 15.632 | 34.17 | <2×10-16 |
| SR×DEM | 11.411 | 12.27 | 28 | <2×10-16 |
| SR×NDVI | 15.948 | 15.998 | 12.57 | <2×10-16 |
| DP×NL | 14.949 | 15.52 | 15.45 | <2×10-16 |
| DP×RH | 9.632 | 10.709 | 18.84 | <2×10-16 |
| DP×DEM | 7.966 | 15.000 | 56.14 | <2×10-16 |
| DP×NDVI | 6.973 | 8.653 | 9.933 | <2×10-16 |
| NL×RH | 13.927 | 14.825 | 16.02 | <2×10-16 |
| NL×DEM | 11.08 | 12.148 | 43.48 | <2×10-16 |
| NL×NDVI | 11.938 | 13.475 | 5.941 | <2×10-16 |
| RH×DEM | 12.245 | 13.153 | 22.559 | <2×10-16 |
| RH×NDVI | 12.988 | 14.064 | 6.376 | <2×10-16 |
| DEM×NDVI | 6.062 | 7.44 | 21.5 | <2×10-16 |
表7 低温区LST与影响因子交互作用项的GAM拟合结果
Table 7 GAM fitting results of interaction terms between LST and influencing factors in the low temperature region
| 交互项 | 估计自由度 | 参考自由度 | F值 | P值 |
|---|---|---|---|---|
| AP×DP | 11.829 | 12.766 | 44.76 | <2×10-16 |
| AP×SR | 15.328 | 15.615 | 30.88 | <2×10-16 |
| AP×NL | 15.873 | 15.992 | 18.91 | <2×10-16 |
| AP×RH | 15.873 | 15.992 | 18.91 | <2×10-16 |
| AP×DEM | 13.997 | 14.273 | 3.251 | 0.0000836 |
| AP×NDVI | 14.689 | 15.436 | 7.433 | <2×10-16 |
| SR×DP | 12.726 | 13.683 | 15.95 | <2×10-16 |
| SR×NL | 13.134 | 13.724 | 41.44 | <2×10-16 |
| SR×RH | 14.677 | 15.632 | 34.17 | <2×10-16 |
| SR×DEM | 11.411 | 12.27 | 28 | <2×10-16 |
| SR×NDVI | 15.948 | 15.998 | 12.57 | <2×10-16 |
| DP×NL | 14.949 | 15.52 | 15.45 | <2×10-16 |
| DP×RH | 9.632 | 10.709 | 18.84 | <2×10-16 |
| DP×DEM | 7.966 | 15.000 | 56.14 | <2×10-16 |
| DP×NDVI | 6.973 | 8.653 | 9.933 | <2×10-16 |
| NL×RH | 13.927 | 14.825 | 16.02 | <2×10-16 |
| NL×DEM | 11.08 | 12.148 | 43.48 | <2×10-16 |
| NL×NDVI | 11.938 | 13.475 | 5.941 | <2×10-16 |
| RH×DEM | 12.245 | 13.153 | 22.559 | <2×10-16 |
| RH×NDVI | 12.988 | 14.064 | 6.376 | <2×10-16 |
| DEM×NDVI | 6.062 | 7.44 | 21.5 | <2×10-16 |

图8 部分影响因子交互项对低温区LST显著性影响的三维效应图
Figure 8 Three-dimensional significant effect diagram of the influence of some interaction terms on LST the low temperature region
| [1] |
BARAT A, KUMAR S, KUMAR P, et al., 2018. Characteristics of surface urban heat island (SUHI) over the Gangetic Plain of Bihar, India[J]. Asia-Pacific Journal of Atmospheric Sciences, 54(2): 205-214.
DOI |
| [2] |
CHAKRABORTI S, BANERJEE A, SANNIGRAHI S, et al., 2019. Assessing the dynamic relationship among land use pattern and land surface temperature: A spatial regression approach[J]. Asian Geographer, 36(2): 93-116.
DOI URL |
| [3] |
CHEN L, WANG X L, CAI X B, et al., 2021. Seasonal variations of daytime land surface temperature and their underlying drivers over Wuhan, China[J]. Remote Sensing, 13(2): 323.
DOI URL |
| [4] |
CHEN W, ZHANG Y, PENGWANG C Y, et al., 2017. Evaluation of urbanization dynamics and its impacts on surface heat islands: A case study of Beijing, China[J]. Remote Sensing, 9(5): 453.
DOI URL |
| [5] |
CHEN X L, ZHAO H M, LI P X, et al., 2006. Remote sensing image-based analysis of the relationship between urban heat island and land use/cover changes[J]. Remote Sensing of Environment, 104(2): 133-146.
DOI URL |
| [6] |
DEILAMI K, KAMRUZZAMAN M, 2017. Modelling the urban heat island effect of smart growth policy scenarios in Brisbane[J]. Land Use Policy, 64: 38-55.
DOI URL |
| [7] |
FARIDEH T, ABOLFAZL R, 2021. Quantitative analysis of spatial distribution of land surface temperature (LST) in relation Ecohydrological, terrain and socio-economic factors based on Landsat data in mountainous area[J]. Advances in Space Research, 68(9): 3622-3640.
DOI URL |
| [8] |
FATTAH M A, MORSHED S R, MORSHED S Y, 2021. Impacts of land use-based carbon emission pattern on surface temperature dynamics: Experience from the urban and suburban areas of Khulna, Bangladesh[J]. Remote Sensing Applications: Society and Environment, 22: 100508.
DOI URL |
| [9] |
HAN D L, ZHANG T T, ZHANG X D, et al., 2022. Study on spatiotemporal characteristics and influencing factors of pedestrian- level PM2.5 concentrations in outdoor open spaces of Harbin in winter, using a generalized additive model (GAM)[J]. Urban Climate, 46: 101313.
DOI URL |
| [10] | KABACOFF R I, 2015. R in Action: Data Analysis and Graphics with R[M]. 2nd ed. Shelter Island: Manning Publications Co.: 171-181. |
| [11] | LI X M, ZHOU W Q, OUYANG Z Y, 2013. Relationship between land surface temperature and spatial pattern of greenspace: What are the effects of spatial resolution?[J]. Landscape & Urban Planning, 114: 1-8. |
| [12] |
LIAO J J, YU C Y, FENG Z, et al., 2020. Spatial differentiation characteristics and driving factors of agricultural eco-efficiency in Chinese provinces from the perspective of ecosystem services[J]. Journal of Cleaner Production, 288: 125466.
DOI URL |
| [13] |
LIU L L, DONG Y C, KONG M, et al., 2020. Towards the comprehensive water quality control in Lake Taihu: correlating chlorophyll and water quality parameters with generalized additive model[J]. Science of the Total Environment, 705: 135993.
DOI URL |
| [14] |
MORABITO M, CRISCI A, GUERRI G, et al., 2021. Surface urban heat islands in Italian metropolitan cities: Tree cover and impervious surface influences[J]. Science of the Total Environment, 751: 142334.
DOI URL |
| [15] |
PAL S, ZIAUL S K, 2017. Detection of land use and land cover change and land surface temperature in English Bazar urban centre[J]. The Egyptian Journal of Remote Sensing and Space Science, 20(1): 125-145.
DOI URL |
| [16] |
RA A, CSTK A, EBD A, et al., 2021. Exploring the relationship between urban form and land surface temperature (LST) in a semi-arid region case study of Ben Guerir City-Morocco[J]. Environmental Challenges, 5: 100229.
DOI URL |
| [17] | SIDDIQUI A, KUSHWAHA G, NIKAM B, et al., 2021. Analysing the day/night seasonal and annual changes and trends in land surface temperature and surface urban heat island intensity (SUHII) for Indian cities[J]. Sustainable Cities and Society, 75: 2210-6707. |
| [18] |
WANG J F, ZHANG T L, FU B J, 2016. A measure of spatial stratified heterogeneity[J]. Ecological Indicators, 67: 250-256.
DOI URL |
| [19] |
WANG X, ZHOU T, TAO F, et al., 2019. Correlation analysis between UBD and LST in Hefei, China, using Luojia1-01 night-time light imagery[J]. Applied Sciences, 9(23): 5224.
DOI URL |
| [20] |
陈颖彪, 郑子豪, 吴志峰, 等, 2019. 夜间灯光遥感数据应用综述和展望[J]. 地理科学进展, 38(2): 205-223.
DOI |
|
CHEN Y B, ZHENG Z H, WU Z F, et al., 2019. Review and prospect of application of nighttime light remote sensing data[J]. Progress in Geography, 38(2): 205-223.
DOI |
|
| [21] | 邓玉娇, 杜尧东, 王捷纯, 等, 2020. 粤港澳大湾区城市热岛时空特征及驱动因素[J]. 生态学杂志, 39(8): 2671-2677. |
| DENG Y J, DU Y D, WANG J C, et al., 2020. Spatiotemporal characteristics and driving factors of urban heat islands in Guangdong Hong Kong-Marco Greater Bay Area[J]. Chinese Journal of Ecology, 39(8): 2671-2677. | |
| [22] |
杜正静, 夏晓玲, 裴兴云, 等, 2015. 基于GAM模型的三种降雨因子对贵州地质灾害危险性预测的对比分析[J]. 中国农学通报, 31(6): 187-193.
DOI |
|
DU Z J, XIA X L, PEI X Y, et al., 2015. Comparative analysis of Three kinds of rainfall factor for geological hazard risk prediction based on GAM in Guizhou province[J]. Chinese Agricultural Science Bulletin, 31(6): 187-193.
DOI |
|
| [23] |
樊智宇, 詹庆明, 刘慧民, 等, 2019. 武汉市夏季城市热岛与不透水面增温强度时空分布[J]. 地球信息科学学报, 21(2): 226-235.
DOI |
| FAN Z Y, ZHAN Q M, LIU H M, et al., 2019. Spatial-temporal distribution of urban heat island and the heating effect of impervious surface in summer in Wuhan[J]. Journal of Geo-information Science, 21(2): 226-235. | |
| [24] |
方颖, 李连发, 2019. 基于机器学习的高精度高分辨率气象因子时空估计[J]. 地球信息科学学报, 21(6): 799-813.
DOI |
| FANG Y, LI L F, 2019. Spatiotemporal estimation of high-accuracy and high-resolution meteorological parameters based on machine learning[J]. Journal of Geo-information Science, 21(6): 799-813. | |
| [25] | 葛静茹, 王海军, 贺三维, 等, 2021. 武汉市都市发展区地表温度季节性空间分布与驱动力分析[J]. 长江流域资源与环境, 30(2): 351-360. |
| GE J R, WANG H J, HE S W, et al., 2021. Seasonal-spatial distribution and driving forces of land surface temperature in the urban development area of Wuhan[J]. Resources and Environment in the Yangtze Basin, 30(2): 351-360. | |
| [26] |
顾西辉, 张强, 孔冬冬, 2016. 中国极端降水事件时空特征及其对夏季温度响应[J]. 地理学报, 71(5): 718-730.
DOI |
|
GU X H, ZHANG Q, KONG D D, et al., 2016. Spatiotemporal patterns of extreme precipitation with their responses to summer temperature[J]. Acta Geographica Sinica, 71(5): 718-730.
DOI |
|
| [27] |
郭宇, 王宏伟, 张喆, 等, 2020. 南京市热环境与地表覆被的时空尺度效应及驱动机制研究[J]. 生态环境学报, 29(7): 1403-1411.
DOI URL |
| GUO Y, WANG H W, ZHANG Z, et al., 2020. Spatio-temporal scale effect and driving mechanism of thermal environment and land surface cover in Nanjing[J]. Ecology and Environmental Sciences, 29(7): 1403-1411. | |
| [28] | 贾明秀, 黄六一, 褚建伟, 等, 2019. 基于GAM和GWR模型分析环境因子对南极磷虾资源分布的非线性和非静态性影响[J]. 中国海洋大学学报 (自然科学版), 49(8): 19-26. |
| JIA M X, HUANG L Y, CHU J W, et al., 2019. Studies on the nonlinear and spatial nonstationary effects of environmental factors on the distribution of Antarctic krill (Euphausia superba)[J]. Periodical of Ocean University of China, 49(8): 19-26. | |
| [29] | 乐柯君, 方陆明, 何小兵, 等, 2019. 森林城市景观格局与热环境的关系——以龙泉市为例[J]. 应用生态学报, 30(9): 3066-3074. |
| LE K J, FANG L M, HE X B, et al., 2019. Relationship between forest city landscape pattern and thermal environment: A case study of Longquan city, China[J]. Chinese Journal of Applied Ecology, 30(9): 3066-3074. | |
| [30] |
李喆, 陈圣宾, 陈芝阳, 2022. 地表温度与土地利用类型间的空间尺度依赖性——以成都为例[J]. 生态环境学报, 31(5): 999-1007.
DOI URL |
| LI Z, CHEN S B, CHEN Z Y, 2022. Spatial scale dependence between land surface temperature and land use types: A case study of Chengdu city[J]. Ecology and Environmental Sciences, 31(5): 999-1007. | |
| [31] | 李壮, 季民, 张镯漫, 2022. 基于地理探测器的合肥市热岛效应影响因素分析[J]. 测绘与空间地理信息, 45(3): 56-59. |
| LI Z, JI M, ZHANG Z M, 2022. Analysis of influencing factors of heat island effect in Hefei city based on geographicaldetectors[J]. Geomatics & Spatial Information Technology, 45(3): 56-59. | |
| [32] | 刘大龙, 马岚, 赵辉辉, 2021. 城市复杂辐射场形成机理[J]. 太阳能学报, 42(10): 458-463. |
| LIU D L, MA L, ZHAO H H, 2021. Formation mechanism of urban complex radiation field[J]. Acta Energiae Solaris Sinica, 42(10): 458-463. | |
| [33] | 刘晓彤, 黄金金, 张逸如, 等, 2022. 基于广义可加模型的广东省森林土壤有机质影响因子[J]. 生态学杂志, 41(11): 2278-2288. |
| LIU X T, HUANG J J, ZHANG Y R, et al., 2022. Analysis of influencing factors on forest soil organic matter in Guangdong Province based on GAM model[J]. Chinese Journal of Ecology, 41(11): 2278-2288. | |
| [34] |
聂桐, 董国涛, 蒋晓辉, 等, 2022. 榆林地区植被时空分异特征及其影响因素研究[J]. 生态环境学报, 31(1): 26-36.
DOI URL |
| NIE T, DONG G T, JIANG X H, et al., 2022. Spatio-temporal variations and influencing factors of vegetation in Yulin[J]. Ecology and Environmental Sciences, 31(1): 26-36. | |
| [35] | 任至涵, 倪长健, 花瑞阳, 等, 2021. 成都O3逐日污染潜势关键时段优选的GAM模型[J]. 中国环境科学, 41(11): 5079-5085. |
| REN Z H, NI C J, HUA R Y, et al., 2021. Optimization of the key period of daily ozone pollution potential in Chengdu based on Generalized Additive Model[J]. China Environmental Science, 41(11): 5079-5085. | |
| [36] |
阮惠华, 许剑辉, 张菲菲, 2022. 2001—2020年粤港澳大湾区植被和地表温度时空变化研究[J]. 生态环境学报, 31(8): 1510-1520.
DOI URL |
| RUAN H H, XU J H, ZHANG F F, 2022. Spatiotemporal changes of vegetation and land surface temperature during 2001 and 2020 in the Guangdong-Hong Kong-Macao greater bay area of China[J]. Ecology and Environmental Sciences, 31(8): 1510-1520. | |
| [37] |
单宝艳, 张巧, 任启新, 等, 2022. 基于局地气候分区的济南市热环境空间分异及其影响因素[J]. 地球信息科学学报, 24(4): 711-722.
DOI |
| SHAN B Y, ZHANG Q, REN Q X, et al., 2022. Spatial differentiation of urban thermal environment and its influencing factors based on local climate zones in Ji’nan[J]. Journal of Geo-information Science, 24(4): 711-722. | |
| [38] |
王劲峰, 徐成东, 2017. 地理探测器: 原理与展望[J]. 地理学报, 72(1): 116-134.
DOI |
|
WANG J F, XU C D, 2017. Geodetector: Principle and prospective[J]. Acta Geographica Sinica, 72(1): 116-134.
DOI |
|
| [39] | 王念, 卢致宇, 徐建红, 等, 2021. 遥感反演和站点观测的地气温度分布特征差异[J]. 遥感学报, 25(8): 1848-1861. |
| WANG N, LU Z Y, XU J H, et al., 2021. Difference of temperature distribution characteristics based on remote sensing and meteorological station temperature data[J]. National Remote Sensing Bulletin, 25(8): 1848-1861. | |
| [40] | 王修信, 朱启疆, 梁宗经, 等, 2011. 喀斯特城市植被覆盖度时空变化对地表温度的影响[J]. 地理与地理信息科学, 27(4): 107-110. |
| WANG X X, ZHU Q J, LIANG Z J, et al., 2011. Influence of spatio-temporal change of vegetation coverage on land surface temperature in Karst city[J]. Geography and Geo-Information Science, 27(4): 107-110. | |
| [41] | 吴昌广, 夏丽丽, 林姚宇, 等, 2015. 深圳市典型住区热环境特征及其影响因子分析[J]. 哈尔滨工业大学学报, 47(6): 59-62. |
| WU C G, XIA L L, LIN Y Y, et al., 2015. Analysis on characteristics of thermal environments in typical residential districts and its influencing factors in Shenzhen[J]. Journal of Harbin Institute of Technology, 47(6): 59-62. | |
| [42] | 向炀, 周志翔, 2020. 基于地理探测器的城市热岛驱动因素分析——以武汉市为例[J]. 长江流域资源与环境, 29(8): 1768-1779. |
| XIANG Y, ZHOU Z X, 2020. Analysis of driving factors of urban heat island based on geographical detector: Taking Wuhan city as an example[J]. Resources and Environment in the Yangtze Basin, 29(8): 1768-1779. | |
| [43] | 谢苗苗, 王仰麟, 付梅臣, 2011. 城市地表温度热岛影响因素研究进展[J]. 地理科学进展, 30(1): 35-41. |
|
XIE M M, WANG Y L, FU M C, 2011. An overview and perspective about causative factors of surface urban heat island effects[J]. Progress in Geography, 30(1): 35-41.
DOI |
|
| [44] |
熊鹰, 章芳, 2020. 基于多源数据的长沙市人居热环境效应及其影响因素分析[J]. 地理学报, 75(11): 2443-2458.
DOI |
|
XIONG Y, ZHANG F, 2020. Thermal environment effects of urban human settlements and influencing factors based on multi-source data: A case study of Changsha city[J]. Acta Geographica Sinica, 75(11): 2443-2458.
DOI |
|
| [45] | 徐涵秋, 2009. 城市不透水面与相关城市生态要素关系的定量分析[J]. 生态学报, 29(5): 2456-2462. |
| XU H Q, 2009. Quantitative analysis on the relationship of urban impervious surface with other components of the urban ecosystem[J]. Acta Ecologica Sinica, 29(5): 2456-2462. | |
| [46] |
杨艳艳, 朱明明, 徐炳庆, 等, 2021. 山东半岛南部近岸海域鱼卵、仔稚鱼群落结构与环境因子相关性[J]. 生态环境学报, 30(5): 995-1004.
DOI URL |
| YANG Y Y, ZHU M M, XU B Q, et al., 2021. Community structure of ichthyoplankton and its relationship with environmental factors in coastal waters of southern Shandong peninsula[J]. Ecology and Environmental Sciences, 30(5): 995-1004. | |
| [47] |
于琛, 胡德勇, 曹诗颂, 等, 2017. 2005—2016年北京中心城区热岛时空格局及影响因子多元建模[J]. 地球信息科学学报, 19(11): 1485-1494.
DOI |
| YU C, HU D Y, CAO S S, et al., 2017. Spatio-temporal pattern of heat island and multivariate modeling of impact factors of Beijing downtown from 2005 to 2016[J]. Journal of Geo-information Science, 19(11): 1485-1494. | |
| [48] |
朱梓弘, 朱同彬, 杨霖, 等, 2019. 中国土壤碱解氮含量与影响因子的空间关系研究[J]. 生态环境学报, 28(11): 2199-2207.
DOI URL |
| ZHU Z H, ZHU T B, YANG L, et al., 2019. The spatial relationship between soil alkeline-nitrogen content and environmental factors in China[J]. Ecology and Environmental Sciences, 28(11): 2199-2207. | |
| [49] | 祝新明, 宋小宁, 冷佩, 等, 2021. 多尺度地理加权回归的地表温度降尺度研究[J]. 遥感学报, 25(8): 1749-1766. |
| ZHU X M, SONG X N, LENG P, et al., 2021. Spatial downscaling of land surface temperature with the multi-scale geographically weighted regression[J]. National Remote Sensing Bulletin, 25(8): 1749-1766. |
| [1] | 王琳, 卫伟. 黄土高原典型县域生态系统服务变化特征及驱动因素[J]. 生态环境学报, 2023, 32(6): 1140-1148. |
| [2] | 李建辉, 党争, 陈琳. 黄河几字弯都市圈PM2.5时空特征及影响因素分析[J]. 生态环境学报, 2023, 32(4): 697-705. |
| [3] | 王成武, 罗俊杰, 唐鸿湖. 基于InVEST模型的太行山沿线地区生态系统碳储量时空分异驱动力分析[J]. 生态环境学报, 2023, 32(2): 215-225. |
| [4] | 蒋恬田, 杨纯, 廖炜, 胡力, 刘欢瑶, 任勃, 李小马. 城市绿地景观格局影响地表温度的通径分析——以长沙市为例[J]. 生态环境学报, 2023, 32(1): 18-25. |
| [5] | 阮惠华, 许剑辉, 张菲菲. 2001—2020年粤港澳大湾区植被和地表温度时空变化研究[J]. 生态环境学报, 2022, 31(8): 1510-1520. |
| [6] | 陈文裕, 夏丽华, 徐国良, 余世钦, 陈行, 陈金凤. 2000—2020年珠江流域NDVI动态变化及影响因素研究[J]. 生态环境学报, 2022, 31(7): 1306-1316. |
| [7] | 李梦华, 韩颖娟, 赵慧, 王云霞. 基于地理探测器的宁夏植被覆盖度时空变化特征及其驱动因子分析[J]. 生态环境学报, 2022, 31(7): 1317-1325. |
| [8] | 李喆, 陈圣宾, 陈芝阳. 地表温度与土地利用类型间的空间尺度依赖性——以成都为例[J]. 生态环境学报, 2022, 31(5): 999-1007. |
| [9] | 高思琦, 董国涛, 蒋晓辉, 聂桐, 郭欣伟, 党素珍, 李心宇, 李昊洋. 黄河源植被覆盖度变化及空间分布自然驱动力分析[J]. 生态环境学报, 2022, 31(3): 429-439. |
| [10] | 赵锐, 詹梨苹, 周亮, 张军科. 地理探测联合地理加权岭回归的PM2.5驱动因素分析[J]. 生态环境学报, 2022, 31(2): 307-317. |
| [11] | 杨艳, 周德成, 宫兆宁, 刘子源, 张良侠. 基于植被生产力的黄土高原地区生态脆弱性及其控制因子分析[J]. 生态环境学报, 2022, 31(10): 1951-1958. |
| [12] | 聂桐, 董国涛, 蒋晓辉, 郭欣伟, 党素珍, 郑嘉昊, 李立缠, 王江. 榆林地区植被时空分异特征及其影响因素研究[J]. 生态环境学报, 2022, 31(1): 26-36. |
| [13] | 王金杰, 赵安周, 胡小枫. 京津冀植被净初级生产力时空分布及自然驱动因子分析[J]. 生态环境学报, 2021, 30(6): 1158-1167. |
| [14] | 张军, 高煜, 王国兰, 金梓函, 杨明航. 典型河谷城市土壤重金属含量空间分异及其影响因素[J]. 生态环境学报, 2021, 30(6): 1276-1285. |
| [15] | 宋鑫博, 黄鹤, 郭军, 熊明明. 城市形态对夏季热环境影响研究——以天津中心城区为例[J]. 生态环境学报, 2021, 30(11): 2165-2174. |
| 阅读次数 | ||||||
|
全文 |
|
|||||
|
摘要 |
|
|||||