生态环境学报 ›› 2023, Vol. 32 ›› Issue (1): 18-25.DOI: 10.16258/j.cnki.1674-5906.2023.01.003
蒋恬田1( ), 杨纯1, 廖炜2, 胡力1, 刘欢瑶3, 任勃3, 李小马1,*()
收稿日期:2022-10-13
出版日期:2023-01-18
发布日期:2023-04-06
通讯作者:
*李小马(1985年生),男,副教授,博士,主要研究方向为城市生态学、城市热岛效应。E-mail: lixiaoma@hunau.edu.cn作者简介:蒋恬田(1996年生),女,硕士研究生,主要从事城市绿地景观格局与热环境方面的研究。E-mail: JTT885@outlook.com
基金资助:
JIANG Tiantian1(), YANG Chun1, LIAO Wei2, HU Li1, LIU Huanyao3, REN Bo3, LI Xiaoma1,*()
Received:2022-10-13
Online:2023-01-18
Published:2023-04-06
摘要:
优化绿地景观格局是城市绿化土地有限背景下改善城市热环境的有效途径,阐明绿地景观格局影响城市热环境的路径与机制是合理并有效地规划与管理城市绿地的基础。以长沙市为例,利用高分2号高分辨率遥感影像在乡镇(街道)尺度量化绿地面积比例和景观配置格局,基于Landsat地表温度采用通径分析方法揭示绿地景观格局影响地表温度的路径,分析其直接效应和间接效应。结果显示:(1)绿地面积比例、水体面积比例、裸地面积比例和绿地斑块密度对地表温度呈显著的直接负效应,共解释85%的地表温度变异,直接路径系数分别为-0.61、-0.54、-0.29和-0.21;(2)绿地面积比例对绿地斑块密度呈显著的直接负效应(直接路径系数-0.46),而绿地斑块密度对地表温度呈显著的直接负效应(直接路径系数-0.21),因此绿地面积比例增加间接导致地表温度升高(间接路径系数0.10),从而削弱提高绿化覆盖率以改善城市热环境的效果;(3)绿地边界密度受绿地面积比例、绿地平均斑块形状指数和绿地斑块密度显著影响,但其对地表温度的影响不显著。因此,以小面积斑块为主的见缝插绿式绿地建设是长沙城市绿地规划管理以改善城市热环境的有效措施。
中图分类号:
蒋恬田, 杨纯, 廖炜, 胡力, 刘欢瑶, 任勃, 李小马. 城市绿地景观格局影响地表温度的通径分析——以长沙市为例[J]. 生态环境学报, 2023, 32(1): 18-25.
JIANG Tiantian, YANG Chun, LIAO Wei, HU Li, LIU Huanyao, REN Bo, LI Xiaoma. Path Analysis of the Urban Greenspace Landscape Pattern Impacts on Land Surface Temperature: A Case Study in Changsha[J]. Ecology and Environment, 2023, 32(1): 18-25.
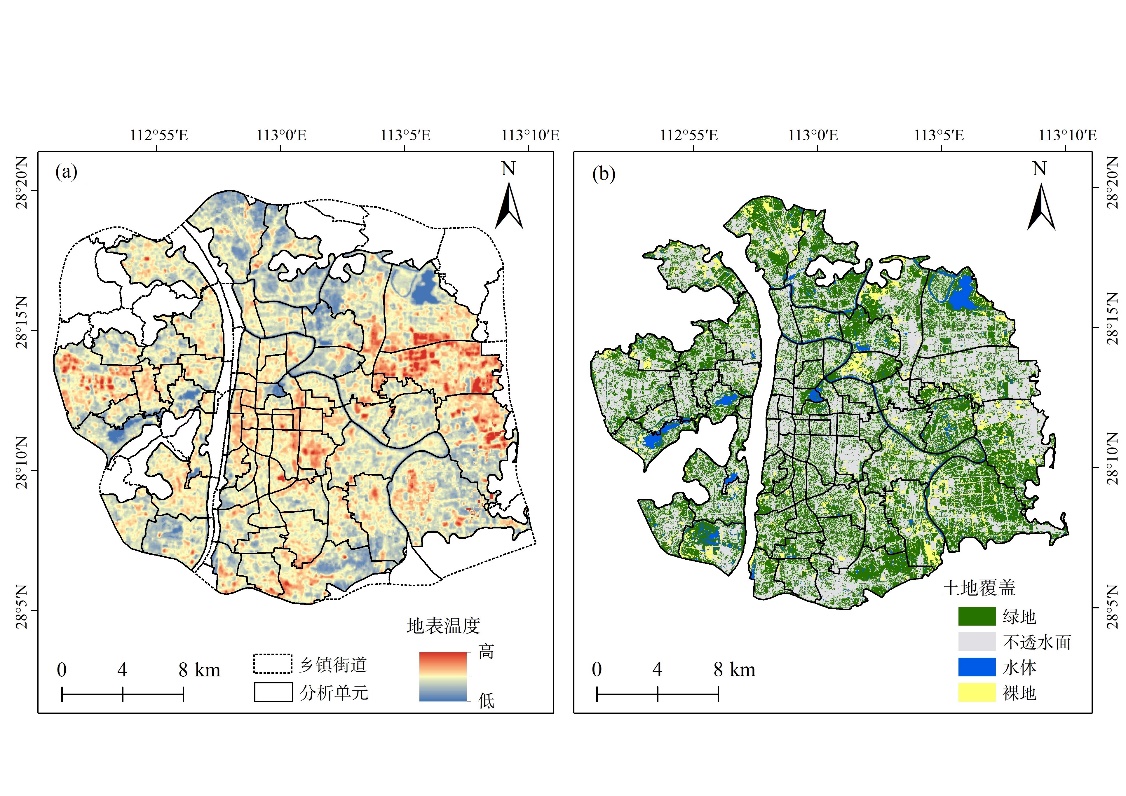
图1 地表温度及土地覆盖图
Figure 1 Land surface temperature map and Land cover map
| 景观格局指数 | 缩写 | 描述(单位) | 公式 |
|---|---|---|---|
| 绿地面积比例 | Pg | 绿地总面积占分析单元的百分比 (%) | |
| 不透水面面积比例 | Pi | 不透水面总面积占分析单元的百分比 (%) | |
| 水体面积比例 | Pw | 水体总面积占分析单元的百分比 (%) | |
| 裸地面积比例 | Pb | 裸地总面积占分析单元的百分比 (%) | |
| 绿地斑块密度 | PDg | 绿地斑块数除以分析单元面积, 其值越大, 绿地斑块越破碎 (ind·km-2) | |
| 绿地边界密度 | EDg | 每公顷绿地所有边缘部分的总长度 (不包括边界), 反映绿地的破碎程度 (m·hm-2) | |
| 平均绿地斑块形状指数 | SIg | 形状指数的平均值 |
表1 景观格局指数描述与公式
Table 1 Description and equations of the selected landscape metrics
| 景观格局指数 | 缩写 | 描述(单位) | 公式 |
|---|---|---|---|
| 绿地面积比例 | Pg | 绿地总面积占分析单元的百分比 (%) | |
| 不透水面面积比例 | Pi | 不透水面总面积占分析单元的百分比 (%) | |
| 水体面积比例 | Pw | 水体总面积占分析单元的百分比 (%) | |
| 裸地面积比例 | Pb | 裸地总面积占分析单元的百分比 (%) | |
| 绿地斑块密度 | PDg | 绿地斑块数除以分析单元面积, 其值越大, 绿地斑块越破碎 (ind·km-2) | |
| 绿地边界密度 | EDg | 每公顷绿地所有边缘部分的总长度 (不包括边界), 反映绿地的破碎程度 (m·hm-2) | |
| 平均绿地斑块形状指数 | SIg | 形状指数的平均值 |
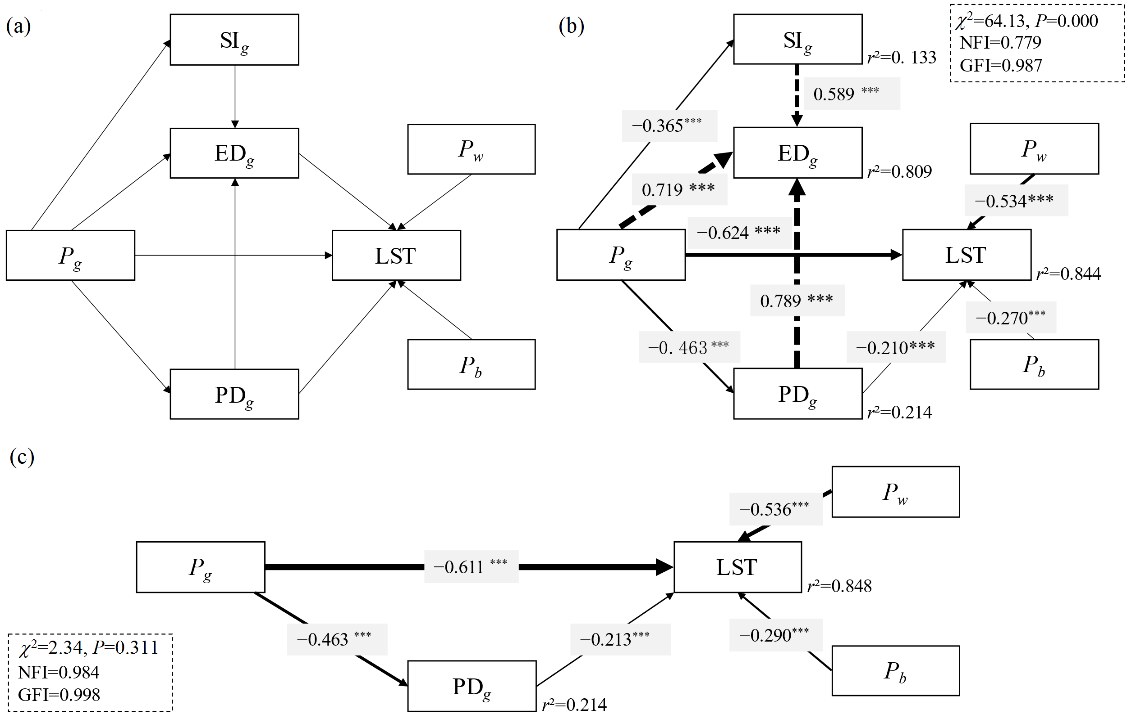
图2 绿地景观格局影响地表温度的路径 理论路径模型(a);基于多模型推断的路径模型(b);优化路径模型(c)(“→”代表直接影响路径,虚箭头代表正效应,实箭头代表负效应,宽度代表路径系数绝对值。***P≤0.001;0.001<**P≤0.01;*0.01<P≤0.05。Pg,绿地面积比例;SIg,平均绿地斑块形状指数;EDg,绿地边界密度;PDg,绿地斑块密度;LST,地表温度;Pw,水体面积比例;Pb,裸地面积比例)
Figure 2 The path diagrams of Green Space Landscape pattern affecting Land Surface temperature
| 景观格局指数 | 最小值 | 最大值 | 平均值 | 标准差 |
|---|---|---|---|---|
| 地表温度/℃ | 42.98 | 50.98 | 46.87 | 1.69 |
| 绿地面积比例Pg/% | 14.95 | 57.65 | 38.57 | 10.24 |
| 不透水面积比例Pi/% | 34.68 | 85.00 | 55.06 | 12.89 |
| 水体面积比例Pw/% | 0.00 | 21.85 | 3.40 | 4.49 |
| 裸地面积比例Pb/% | 0.00 | 16.59 | 2.97 | 3.29 |
| 绿地斑块密度PDg/(ind·km-2) | 205.47 | 954.95 | 454.83 | 154.18 |
| 绿地边界密度EDg/(m·hm-2) | 418.51 | 896.23 | 628.74 | 115.30 |
| 平均绿地斑块形状指数SIg | 1.35 | 1.60 | 1.48 | 0.06 |
表2 描述性统计分析
Table 2 Descriptive statistics of LST and landscape metrics
| 景观格局指数 | 最小值 | 最大值 | 平均值 | 标准差 |
|---|---|---|---|---|
| 地表温度/℃ | 42.98 | 50.98 | 46.87 | 1.69 |
| 绿地面积比例Pg/% | 14.95 | 57.65 | 38.57 | 10.24 |
| 不透水面积比例Pi/% | 34.68 | 85.00 | 55.06 | 12.89 |
| 水体面积比例Pw/% | 0.00 | 21.85 | 3.40 | 4.49 |
| 裸地面积比例Pb/% | 0.00 | 16.59 | 2.97 | 3.29 |
| 绿地斑块密度PDg/(ind·km-2) | 205.47 | 954.95 | 454.83 | 154.18 |
| 绿地边界密度EDg/(m·hm-2) | 418.51 | 896.23 | 628.74 | 115.30 |
| 平均绿地斑块形状指数SIg | 1.35 | 1.60 | 1.48 | 0.06 |
| [1] |
AL-SAADI L M, JABER S H, AL-JIBOORI M H, 2020. Variation of urban vegetation cover and its impact on minimum and maximum heat islands[J]. Urban Climate, 34: 100707.
DOI URL |
| [2] |
ATHUKORALA D, MURAYAMA Y, 2021. Urban heat island formation in greater cairo: Spatio-temporal analysis of daytime and nighttime land surface temperatures along the urban-rural gradient[J]. Remote Sensing, 13(7): 27.
DOI URL |
| [3] |
AZHDARI A, SOLTANI A, ALIDADI M, 2018. Urban morphology and landscape structure effect on land surface temperature: Evidence from Shiraz, a semi-arid city[J]. Sustainable Cities and Society, 41: 853-864.
DOI URL |
| [4] |
BENTLER P, BONETT M, 1980. Significance tests and goodness of fit in the analysis of covariance structures[J]. Psychological Bulletin, 88(3): 588-606.
DOI URL |
| [5] |
BOWLER D E, BUYUNG-ALI L, KNIGHT T M, et al., 2010. Urban greening to cool towns and cities: A systematic review of the empirical evidence[J]. Landscape and Urban Planning, 97(3): 147-155.
DOI URL |
| [6] |
BUYANTUYEV A, WU J G, 2010. Urban heat islands and landscape heterogeneity: linking spatiotemporal variations in surface temperatures to land-cover and socioeconomic patterns[J]. Landscape Ecology, 25(1): 17-33.
DOI URL |
| [7] |
CHAKRABORTY T, LEE X, 2019. A simplified urban-extent algorithm to characterize surface urban heat islands on a global scale and examine vegetation control on their spatiotemporal variability[J]. International Journal of Applied Earth Observation and Geoinformation, 74: 269-280.
DOI URL |
| [8] |
CLASSEN A, PETERS M K, KINDEKETA W J, et al., 2015. Temperature versus resource constraints: which factors determine bee diversity on Mount Kilimanjaro, Tanzania?[J]. Global Ecology and Biogeography, 24(6): 642-652.
DOI URL |
| [9] |
CROMPTON O, CORREA D, DUNCAN J, et al., 2021. Deforestation-induced surface warming is influenced by the fragmentation and spatial extent of forest loss in Maritime Southeast Asia[J]. Environmental Research Letters, 16(11): 114018.
DOI |
| [10] |
DIMOUDI A, NIKOLOPOULOU M, 2003. Vegetation in the urban environment: microclimatic analysis and benefits[J]. Energy and Buildings, 35(1): 69-76.
DOI URL |
| [11] |
GENG X L, YU Z W, ZHANG D, et al., 2022. The influence of local background climate on the dominant factors and threshold-size of the cooling effect of urban parks[J]. Science of the Total Environment, 823: 153806.
DOI URL |
| [12] |
GRACE J B, KELLEY J E, 2006. A structural equation model analysis of postfire plant diversity in California shrublands[J]. Ecological Applications, 16(2): 503-514.
DOI URL |
| [13] | HAHS A K, MCDONNELL M J, 2006. Selecting independent measures to quantify Melbourne’s urban-rural gradient[J]. Landscape & Urban Planning, 78(4): 435-448. |
| [14] | HAMADA S, OHTA T, 2010. Seasonal variations in the cooling effect of urban green areas on surrounding urban areas[J]. Urban Forestry & Urban Greening, 9(1): 15-24. |
| [15] |
HARRISON X A, DONALDSON L, CORREA-CANO M E, et al., 2018. A brief introduction to mixed effects modelling and multi-model inference in ecology[J]. Peerj, 6: e4794.
DOI URL |
| [16] |
HE C, ZHOU L G, YAO Y R, et al., 2021. Cooling effect of urban trees and its spatiotemporal characteristics: A comparative study[J]. Building and Environment, 204: 108103.
DOI URL |
| [17] |
JENERETTE G D, HARLAN S L, BRAZEL A, et al., 2007. Regional relationships between surface temperature, vegetation, and human settlement in a rapidly urbanizing ecosystem[J]. Landscape Ecology, 22(3): 353-365.
DOI URL |
| [18] |
JIAO M, ZHOU W Q, ZHENG Z, et al., 2021. Optimizing the shade potential of trees by accounting for landscape context[J]. Sustainable Cities and Society, 70: 102905.
DOI URL |
| [19] |
JIAO M, ZHOU W, ZHENG Z, et al., 2017. Patch size of trees affects its cooling effectiveness: A perspective from shading and transpiration processes[J]. Agricultural and Forest Meteorology, 247: 293-299.
DOI URL |
| [20] | KE X L, MEN H L, ZHOU T, et al., 2021. Variance of the impact of urban green space on the urban heat island effect among different urban functional zones: A case study in Wuhan[J]. Urban Forestry & Urban Greening, 62: 127159. |
| [21] | KONG F, YIN H, JAMES P, et al., 2014. Effects of spatial pattern of greenspace on urban cooling in a large metropolitan area of eastern China[J]. Landscape & Urban Planning, 128: 35-47. |
| [22] |
LI H B, WU J G, 2004. Use and misuse of landscape indices[J]. Landscape Ecology, 19(4): 389-399.
DOI URL |
| [23] |
LI W F, BAI Y, CHEN Q W, et al., 2014. Discrepant impacts of land use and land cover on urban heat islands: A case study of Shanghai, China[J]. Ecological Indicators, 47: 171-178.
DOI URL |
| [24] | LI X C, GONG P, ZHOU Y Y, et al., 2020. Mapping global urban boundaries from the global artificial impervious area (GAIA) data[J]. Environmental Research Letters, 15(9): 11. |
| [25] | LI X M, ZHOU W Q, OUYANG Z Y, 2013. Relationship between land surface temperature and spatial pattern of greenspace: What are the effects of spatial resolution?[J]. Landscape & Urban Planning, 114: 1-8. |
| [26] |
LI X M, ZHOU W Q, OUYANG Z Y, et al., 2012. Spatial pattern of greenspace affects land surface temperature: Evidence from the heavily urbanized Beijing metropolitan area, China[J]. Landscape Ecology, 27(6): 887-898.
DOI URL |
| [27] |
LI X M, ZHOU Y Y, YU S, et al., 2019. Urban heat island impacts on building energy consumption: A review of approaches and findings[J]. Energy, 174: 407-419.
DOI URL |
| [28] |
LI X, HE H S, BU R, et al., 2005. The adequacy of different landscape metrics for various landscape patterns[J]. Pattern Recognition, 38(12): 2626-2638.
DOI URL |
| [29] | LIAO W, CAI Z W, FENG Y, et al., 2021. A simple and easy method to quantify the cool island intensity of urban greenspace[J]. Urban Forestry & Urban Greening, 62: 127173. |
| [30] |
LUO Z K, FENG W T, LUO Y Q, et al., 2017. Soil organic carbon dynamics jointly controlled by climate, carbon inputs, soil properties and soil carbon fractions[J]. Global Change Biology, 23(10): 4430-4439.
DOI PMID |
| [31] |
MAIMAITIYIMING M, GHULAM A, TIYIP T, et al., 2014. Effects of green space spatial pattern on land surface temperature: Implications for sustainable urban planning and climate change adaptation[J]. Isprs Journal of Photogrammetry and Remote Sensing, 89: 59-66.
DOI URL |
| [32] |
MASOUDI M, TAN P Y, LIEW S C, 2019. Multi-city comparison of the relationships between spatial pattern and cooling effect of urban green spaces in four major Asian cities[J]. Ecological Indicators, 98: 200-213.
DOI URL |
| [33] |
MATÍAS L, CASTRO J, ZAMORA R, 2012. Effect of simulated climate change on soil respiration in a mediterranean-type ecosystem: Rainfall and habitat Type are more important than temperature or the soil carbon pool[J]. Ecosystems, 15(2): 299-310.
DOI URL |
| [34] |
NGULANI T, SHACKLETON C M, 2020. The degree, extent and value of air temperature amelioration by urban green spaces in Bulawayo, Zimbabwe[J]. South African Geographical Journal, 102(3): 344-355.
DOI URL |
| [35] | NJOVU H K, STEFFAN-DEWENTER I, GEBERT F, et al., 2021. Plant traits mediate the effects of climate on phytophagous beetle diversity on Mt. Kilimanjaro[J]. Ecology, 102(12): e03521. |
| [36] |
PALAFOX-JUAREZ E B, LOPEZ-MARTINEZ J O, HERNANDEZ-STEFANONI J L, et al., 2021. Impact of urban land-cover changes on the spatial-temporal land surface temperature in a tropical city of Mexico[J]. Isprs International Journal of Geo-Information, 10(2): 76.
DOI URL |
| [37] |
PENG J, LIU Q Y, XU Z H, et al., 2020. How to effectively mitigate urban heat island effect? A perspective of waterbody patch size threshold[J]. Landscape and Urban Planning, 202: 103873.
DOI URL |
| [38] |
PENG J, WANG Y L, ZHANG Y, et al., 2010. Evaluating the effectiveness of landscape metrics in quantifying spatial patterns[J]. Ecological Indicators, 10(2): 217-223.
DOI URL |
| [39] |
RIITTERS K H, O'NEILL R V, HUNSAKER C T, et al., 1995. A factor analysis of landscape pattern and structure metrics[J]. Landscape Ecology, 10(1): 23-39.
DOI URL |
| [40] |
SAYAO V M, DOS SANTOS N V, MENDES W D, et al., 2020. Land use/land cover changes and bare soil surface temperature monitoring in southeast Brazil[J]. Geoderma Regional, 22: e00313.
DOI URL |
| [41] |
SHAO W Y, WANG Q Z, GUAN Q Y, et al., 2022. Distribution of soil available nutrients and their response to environmental factors based on path analysis model in arid and semi-arid area of northwest China[J]. Science of the Total Environment, 827: 154254.
DOI URL |
| [42] | TANAKA J S, HUBA G J, 1985. A fit index for covariance structure models under arbitrary GLS estimation[J]. British Journal of Mathematical & Statistical Psychology, 38(2): 197-201. |
| [43] |
WANG J, ZHOU W Q, JIAO M, 2022. Location matters: planting urban trees in the right places improves cooling[J]. Frontiers in Ecology and the Environment, 20(3): 147-151.
DOI URL |
| [44] |
WANG L Y, HOU H, WENG J X, 2020. Ordinary least squares modelling of urban heat island intensity based on landscape composition and configuration: A comparative study among three megacities along the Yangtze River[J]. Sustainable Cities and Society, 62: 102381.
DOI URL |
| [45] |
WENG Q H, LU D S, SCHUBRING J, 2004. Estimation of land surface temperature-vegetation abundance relationship for urban heat island studies[J]. Remote Sensing of Environment, 89(4): 467-483.
DOI URL |
| [46] |
WU C Y, LI J X, WANG C F, et al., 2021. Estimating the cooling effect of pocket green space in high density urban areas in Shanghai, China[J]. Frontiers in Environmental Science, 9: 657969.
DOI URL |
| [47] |
YOUNGSTEADT E, ERNST A F, DUNN R R, et al., 2017. Responses of arthropod populations to warming depend on latitude: Evidence from urban heat islands[J]. Global Change Biology, 23(4): 1436-1447.
DOI PMID |
| [48] |
YU Z W, GUO X Y, JØRGENSEN G, et al., 2017. How can urban green spaces be planned for climate adaptation in subtropical cities?[J]. Ecological Indicators, 82: 152-162.
DOI URL |
| [49] |
YUAN B, ZHOU L, DANG X W, et al., 2021. Separate and combined effects of 3D building features and urban green space on land surface temperature[J]. Journal of Environmental Management, 295: 113116.
DOI URL |
| [50] |
ZHANG X Y, ZHONG T Y, FENG X Z, et al., 2009. Estimation of the relationship between vegetation patches and urban land surface temperature with remote sensing[J]. International Journal of Remote Sensing, 30(8): 2105-2118.
DOI URL |
| [51] | ZHANG Z, LÜ Y M, PAN H T, 2013. Cooling and humidifying effect of plant communities in subtropical urban parks[J]. Urban Forestry & Urban Greening, 12(3): 323-329. |
| [52] |
ZHAO J C, ZHAO X, LIANG S L, et al., 2020. Assessing the thermal contributions of urban land cover types[J]. Landscape and Urban Planning, 204: 103927.
DOI URL |
| [53] |
ZHOU W Q, HUANG G L, PICKETT S T A, et al., 2021. Urban tree canopy has greater cooling effects in socially vulnerable communities in the US[J]. One Earth, 4(12): 1764-1775.
DOI URL |
| [54] |
ZHOU W Q, QIAN Y G, LI X M, et al., 2014. Relationships between land cover and the surface urban heat island: seasonal variability and effects of spatial and thematic resolution of land cover data on predicting land surface temperatures[J]. Landscape Ecology, 29(1): 153-167.
DOI URL |
| [55] |
ZHOU W Q, WANG J, CADENASSO M L, 2017. Effects of the spatial configuration of trees on urban heat mitigation: A comparative study[J]. Remote Sensing of Environment, 195: 1-12.
DOI URL |
| [56] |
ZHU D Y, ZHOU Q, LIU M M, et al., 2021. Non-optimum temperature-related mortality burden in China: Ad-dressing the dual influences of climate change and urban heat islands[J]. Science of the Total Environment, 782: 146760.
DOI URL |
| [57] | 布仁仓, 胡远满, 常禹, 等, 2005. 景观指数之间的相关分析[J]. 生态学报, 25(10): 2764-2775. |
| BU R C, HU Y M, CHANG Y, et al., 2005. A correlation analysis on landscape metrics[J]. Acta Ecologica Sinica, 25(10): 2764-2775. | |
| [58] | 长沙市人民政府, 2022. 长沙概况. (2022-05-24) [2022-08-04]. http://www.changsha.gov.cn/. |
| Changsha Municipal People’s Government, 2022. General situation of Changsha[EB/OL]. (2022-05-24) [2022-08-04]. http://www.changsha.gov.cn/. | |
| [59] | 长沙市统计局, 2022. 2021年长沙统计年鉴. (2022-02-22) [2022-08-04]. http://tjj.changsha.gov.cn/tjxx/tjsj/tjnj/. |
| Changsha Bureau of Statistics, 2022. Changsha Statistical Yearbook 2021[EB/OL]. (2022-02-22) [2022-08-04]. http://tjj.changsha.gov.cn/tjxx/tjsj/tjnj/. | |
| [60] | 陈爱莲, 孙然好, 陈利顶, 2013. 绿地格局对城市地表热环境的调节功能[J]. 生态学报, 33(8): 2372-2380. |
|
CHEN A L, SUN R H, CHEN L D, 2013. Effects of urban green pattern on urban surface thermal environment[J]. Acta Ecologica Sinica, 33(8): 2372-2380.
DOI URL |
|
| [61] | 陈辉, 古琳, 黎燕琼, 等, 2009. 成都市城市森林格局与热岛效应的关系[J]. 生态学报, 29(9): 4865-5883. |
| CHEN H, GU L, LI Y Q, et al., 2009. Analysis on relations between the pattern of urban forests and heat island effect in Chengdu[J]. Acta Ecologica Sinica, 29(9): 4865-5883. | |
| [62] |
陈明, 戴菲, 2021. 基于形态学空间格局分析的城市绿地对热环境的影响研究[J]. 生态环境学报, 30(1): 125-134.
DOI URL |
| CHEN M, DAI F, 2021. The influence of urban green spaces on thermal environment based on morphological spatial pattern analysis[J]. Ecology and Environmental Sciences, 30(1): 125-134. | |
| [63] | 焦敏, 周伟奇, 钱雨果, 等, 2021. 斑块面积对城市绿地降温效应的影响研究进展[J]. 生态学报, 41(23): 9154-9163. |
| JIAO M, ZHOU W Q, QIAN Y G, et al., 2021. Infiuence of patch size on the cooling capacity of urban greenspace: progresses, problems and perspectives[J]. Acta Ecologica Sinica, 41(23): 9154-9163. | |
| [64] |
李莹莹, 邓雅云, 陈永生, 等, 2018. 基于卫星遥感的合肥城市绿色空间对热环境的影响评估[J]. 生态环境学报, 27(7): 1224-1233.
DOI URL |
| LI Y Y, DENG Y Y, CHEN Y S, et al., 2018. Characterization of urban green space thermal environmental effects based on satellite remote sensing: A case study of Hefei, China[J]. Ecology and Environmental Sciences, 27(7): 1224-1233. | |
| [65] |
买买提江·买提尼亚孜, 阿里木江·卡斯木, 2015. 干旱区典型城市下垫面特征及其与地表热环境的关系研究[J]. 生态环境学报, 24(11): 1865-1871.
DOI URL |
| MAIMAITIJIANG M, ALIMUJIANG K, 2015. Study on land surface characteristics and its relationship with land surface thermal environment of typical city in arid region[J]. Ecology and Environmental Sciences, 24(11): 1865-1871 | |
| [66] | 苏泳娴, 黄光庆, 陈修治, 等, 2011. 城市绿地的生态环境效应研究进展[J]. 生态学报, 31(23): 7287-7300. |
| SU Y X, HUANG G Q, CHEN X Z, et al., 2011. Research progress in the eco-environmental effects of urban green spaces[J]. Acta Ecologica Sinica, 31(23): 7287-7300. | |
| [67] |
王晓俊, 卫笑, 邹昊, 2020. 城市绿地空间格局对热岛效应的影响研究进展[J]. 生态环境学报, 29(9): 1904-1911.
DOI URL |
| WANG X J, WEI X, ZOU H, 2020. Research progress about the impact of urban green space spatial pattern on urban heat island[J]. Ecology and Environmental Sciences, 29(9): 1904-1911. | |
| [68] | 岳文泽, 徐丽华. 2013. 城市典型水域景观的热环境效应[J]. 生态学报, 33(6): 1852-1859. |
|
YUE W Z, XU L H, 2013. Thermal environment effect of urban water landscape[J]. Acta Ecologica Sinica, 33(6): 1852-1859.
DOI URL |
|
| [69] | 张波, 王文杰, 何兴元, 等, 2017. 哈尔滨城市森林遮荫和降温增湿效应差异及其影响因素[J]. 生态学杂志, 36(4): 951-961. |
| ZHANG B, WANG W J, HE X Y, et al., 2017. Shading, cooling and humidifying effects of urban forests in Harbin City and possible association with various factors[J]. Chinese Journal of Ecology, 36(4): 951-961. |
| [1] | 付蓉, 武新梅, 陈斌. 城市地表温度空间分异及驱动因子差异性分析——以合肥市为例[J]. 生态环境学报, 2023, 32(1): 110-122. |
| [2] | 阮惠华, 许剑辉, 张菲菲. 2001—2020年粤港澳大湾区植被和地表温度时空变化研究[J]. 生态环境学报, 2022, 31(8): 1510-1520. |
| [3] | 李喆, 陈圣宾, 陈芝阳. 地表温度与土地利用类型间的空间尺度依赖性——以成都为例[J]. 生态环境学报, 2022, 31(5): 999-1007. |
| [4] | 宋鑫博, 黄鹤, 郭军, 熊明明. 城市形态对夏季热环境影响研究——以天津中心城区为例[J]. 生态环境学报, 2021, 30(11): 2165-2174. |
| 阅读次数 | ||||||
|
全文 |
|
|||||
|
摘要 |
|
|||||