生态环境学报 ›› 2022, Vol. 31 ›› Issue (10): 1951-1958.DOI: 10.16258/j.cnki.1674-5906.2022.10.003
杨艳1,2,3( ), 周德成1, 宫兆宁2,3, 刘子源1, 张良侠1,*()
收稿日期:2022-06-14
出版日期:2022-10-18
发布日期:2022-12-09
通讯作者:
*张良侠(1986年生),女,博士,主要研究方向为生态系统综合评估。E-mail: zhanglx@nuist.edu.cn作者简介:杨艳(1999年生),女,硕士研究生,主要研究方向为遥感技术与地学应用。E-mail: yangyannuist@163.com
基金资助:
YANG Yan1,2,3(), ZHOU Decheng1, GONG Zhaoning2,3, LIU Ziyuan1, ZHANG Liangxia1,*()
Received:2022-06-14
Online:2022-10-18
Published:2022-12-09
摘要:
作为中国典型的生态脆弱区之一,研究黄土高原生态脆弱性的空间分布格局及控制因子,可为该地区生态系统修复和环境管理提供重要科学参考和理论支持。该研究依据IPCC生态脆弱性定义,以生态系统净初级生产力(net primary productivity,NPP)为指标,评估了2001—2020年黄土高原生态脆弱性的空间分布格局,并基于地理探测器定量分析了生态脆弱性的控制因子。结果表明,黄土高原生态脆弱性整体较高,中度及以上等级脆弱区域面积占比约61%,且脆弱性呈现出西北高东南低的分布格局。林地脆弱性最低,中度及以下等级脆弱区面积占比超过85%;草地、耕地和建设用地中度及以下等级脆弱区面积占比分别为59%、66%和76%;未利用地的脆弱性程度最高,中度及以上等级脆弱区面积占比超过86%。植被覆盖度和降水是影响生态脆弱性的主控因子,二者的解释力分别为0.59和0.48;其他因子对生态脆弱性的影响力整体较小(<0.18)。此外,不同影响因子间均存在较强的交互作用,特别是植被覆盖度与海拔之间,其交互作用的解释力高达0.66。该研究表明,基于NPP动态变化能够有效表征黄土高原地区生态脆弱性的空间分布格局,结果强调了黄土高原地区生态系统的高度脆弱性以及植被与降水的主控作用,可为干旱半干旱区生态系统修复与管理及其成效评估提供一定的理论和方法参考。
中图分类号:
杨艳, 周德成, 宫兆宁, 刘子源, 张良侠. 基于植被生产力的黄土高原地区生态脆弱性及其控制因子分析[J]. 生态环境学报, 2022, 31(10): 1951-1958.
YANG Yan, ZHOU Decheng, GONG Zhaoning, LIU Ziyuan, ZHANG Liangxia. Ecological Vulnerability and Its Drivers of the Loess Plateau Based on Vegetation Productivity[J]. Ecology and Environment, 2022, 31(10): 1951-1958.
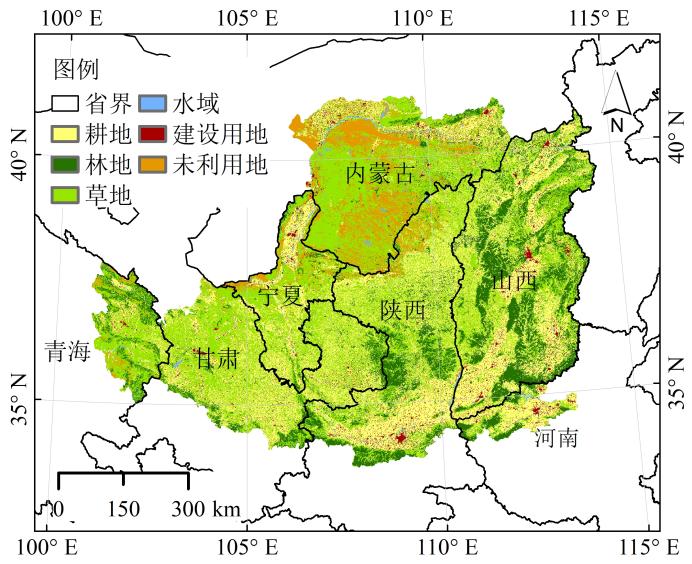
图1 2010年黄土高原地区土地利用情况
Figure 1 Land use in the Loess Plateau in 2010
| 探测因子 Detection factor | 指标 Index | 单位 Unit |
|---|---|---|
| X1 | 年均温 | ℃ |
| X2 | 年均降水 | mm |
| X3 | NDVI | — |
| X4 | 海拔 | m |
| X5 | 坡度 | ° |
| X6 | 人均GDP | 万元 |
| X7 | 人口密度 | person·km-2 |
表1 影响因子
Table 1 Impact Factor
| 探测因子 Detection factor | 指标 Index | 单位 Unit |
|---|---|---|
| X1 | 年均温 | ℃ |
| X2 | 年均降水 | mm |
| X3 | NDVI | — |
| X4 | 海拔 | m |
| X5 | 坡度 | ° |
| X6 | 人均GDP | 万元 |
| X7 | 人口密度 | person·km-2 |
| 脆弱性等级 Vulnerability level | 脆弱指数 Vulnerability index | 面积 Area/km2 | 百分比 Percentage/% |
|---|---|---|---|
| 微度脆弱 Slight vulnerability | -1.00- -0.51 | 1.05×10⁵ | 16.46 |
| 轻度脆弱 Mildly vulnerability | -0.51- -0.19 | 1.46×10⁵ | 22.75 |
| 中度脆弱 Moderately vulnerability | -0.19-0.09 | 1.69×10⁵ | 26.45 |
| 重度脆弱 Severely vulnerability | 0.09-0.41 | 1.49×10⁵ | 23.40 |
| 极度脆弱 Extremely vulnerability | 0.41-1.00 | 6.80×10⁴ | 10.95 |
表2 黄土高原不同脆弱性等级所占面积及占比
Table 2 Area and proportion of different vulnerability levels in the Loess Plateau
| 脆弱性等级 Vulnerability level | 脆弱指数 Vulnerability index | 面积 Area/km2 | 百分比 Percentage/% |
|---|---|---|---|
| 微度脆弱 Slight vulnerability | -1.00- -0.51 | 1.05×10⁵ | 16.46 |
| 轻度脆弱 Mildly vulnerability | -0.51- -0.19 | 1.46×10⁵ | 22.75 |
| 中度脆弱 Moderately vulnerability | -0.19-0.09 | 1.69×10⁵ | 26.45 |
| 重度脆弱 Severely vulnerability | 0.09-0.41 | 1.49×10⁵ | 23.40 |
| 极度脆弱 Extremely vulnerability | 0.41-1.00 | 6.80×10⁴ | 10.95 |
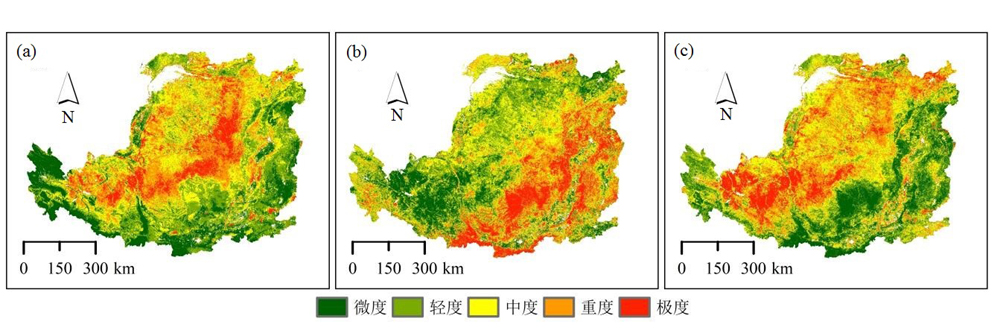
图2 2001—2020年黄土高原地区敏感性(a)、适应性(b)和生态脆弱性(c)空间分布特征
Figure 2 Spatial distributions of sensitivity, adaptability and ecological vulnerability in the Loess Plateau in 2001-2020
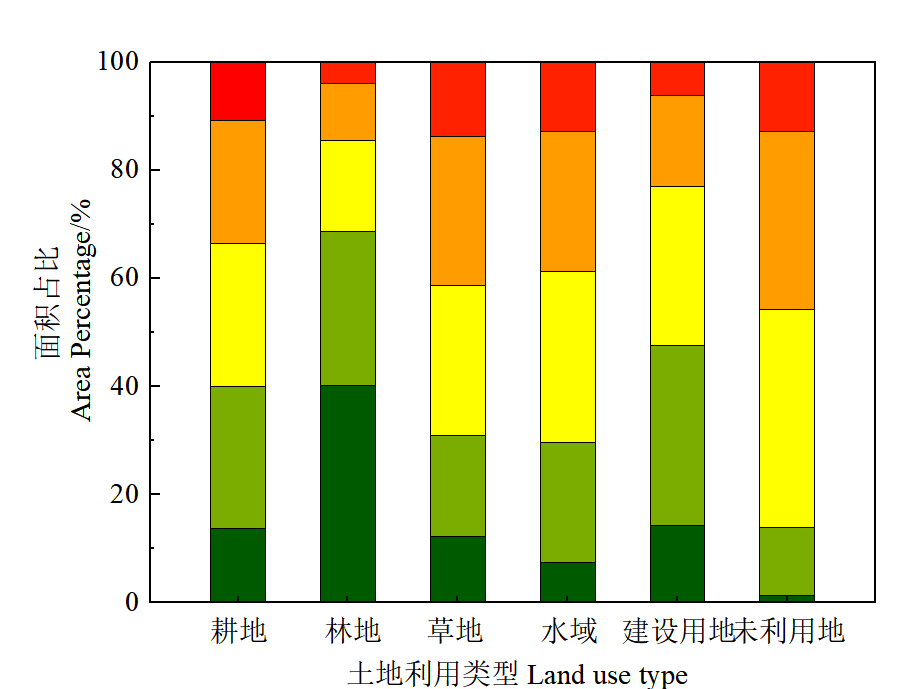
图3 2001—2020年黄土高原不同土地利用类型下各生态脆弱性等级面积占比
Figure 3 Area proportion of each ecological vulnerability under different land use types in the Loess Plateau in 2001-2020
| 探测因子Detection factor | X1 | X2 | X3 | X4 | X5 | X6 | X7 |
|---|---|---|---|---|---|---|---|
| q值 q value | 0.13 | 0.48 | 0.59 | 0.09 | 0.18 | 0.09 | 0.09 |
| q排序 q ranking | 4 | 2 | 1 | 5 | 3 | 6 | 7 |
| P值 P value | 0.000 | 0.000 | 0.000 | 0.000 | 0.000 | 0.000 | 0.000 |
表3 黄土高原地区各影响因子对生态脆弱性的解释力
Table 3 Explanatory power of different drivers on ecological vulnerability in the Loess Plateau in 2001-2020
| 探测因子Detection factor | X1 | X2 | X3 | X4 | X5 | X6 | X7 |
|---|---|---|---|---|---|---|---|
| q值 q value | 0.13 | 0.48 | 0.59 | 0.09 | 0.18 | 0.09 | 0.09 |
| q排序 q ranking | 4 | 2 | 1 | 5 | 3 | 6 | 7 |
| P值 P value | 0.000 | 0.000 | 0.000 | 0.000 | 0.000 | 0.000 | 0.000 |
| 探测因子 Detection factor | X1 | X2 | X3 | X4 | X5 | X6 |
|---|---|---|---|---|---|---|
| X2 | 0.55● | |||||
| X3 | 0.63● | 0.63● | ||||
| X4 | 0.17● | 0.58○ | 0.66● | |||
| X5 | 0.33○ | 0.59● | 0.64● | 0.37○ | ||
| X6 | 0.19● | 0.53● | 0.62● | 0.19○ | 0.25● | |
| X7 | 0.19● | 0.51● | 0.61● | 0.19○ | 0.27● | 0.15● |
表4 黄土高原地区生态脆弱性各影响因子间的交互作用
Table 4 Interactions among drivers of ecological vulnerability in the Loess Plateau
| 探测因子 Detection factor | X1 | X2 | X3 | X4 | X5 | X6 |
|---|---|---|---|---|---|---|
| X2 | 0.55● | |||||
| X3 | 0.63● | 0.63● | ||||
| X4 | 0.17● | 0.58○ | 0.66● | |||
| X5 | 0.33○ | 0.59● | 0.64● | 0.37○ | ||
| X6 | 0.19● | 0.53● | 0.62● | 0.19○ | 0.25● | |
| X7 | 0.19● | 0.51● | 0.61● | 0.19○ | 0.27● | 0.15● |
| [1] |
BAI J, LI J L, BAO A M, et al., 2021. Spatial-temporal variations of ecological vulnerability in the Tarim River Basin, Northwest China[J]. Journal of Arid Land, 13(8): 814-834.
DOI |
| [2] | HU X J, MA C M, HUANG P, et al., 2021. Ecological vulnerability assessment based on AHP-PSR method and analysis of its single parameter sensitivity and spatial autocorrelation for ecological protection: A case of Weifang City, China[J]. Ecological Indicators, 125: 1-11. |
| [3] | IPCC, 2014. Climate Change 2014:Impacts, adaptation, and vulnerability. Part A:global and sectoral aspects. Contribution of working group Ⅱ to the fifth assess-ment report of the intergovernmental panel on climate change[M]. Cambridge. UK: Cambridge University Press. |
| [4] | LI Q, SHI X Y, WU Q Q, 2021. Effects of protection and restoration on reducing ecological vulnerability[J]. Science of The Total Environment, 761: 1-11. |
| [5] |
LIU D, CAO C X, OLENA D, et al., 2017. Using fuzzy analytic hierarchy process for spatio-temporal analysis of eco-environmental vulnerability change during 1990-2010 in Sanjiangyuan region, China[J]. Ecological Indicators, 73: 612-625.
DOI URL |
| [6] | SUN Z H, MAO Z A, YANG L Y, et al., 2021. Impacts of climate change and afforestation on vegetation dynamic in the Mu Us Desert, China[J]. Ecological Indicators, 129: 1-11. |
| [7] |
XIAO J F, 2014. Satellite evidence for significant biophysical consequences of the “Grain for Green” Program on the Loess Plateau in China[J]. Journal of Geophysical Research: Biogeosciences, 119(12): 2261-2275.
DOI URL |
| [8] | ZHANG J, SUN J, MA B, et al., 2017. Assessing the ecological vulnerability of the upper reaches of the Minjiang River[J]. PLoS ONE, 12(7): 1-16. |
| [9] | 陈枫, 李泽红, 董锁成, 等, 2018. 基于VSD模型的黄土高原丘陵沟壑区县域生态脆弱性评价——以甘肃省临洮县为例[J]. 干旱区资源与环境, 32(11): 74-80. |
| CHEN F, LI Z H, DONG S C, et al., 2018. Evaluation of ecological vulnerability in gully-hilly region of Loess Plateau based on VSD Model: A case of Lintao county[J]. Journal of Arid Land Resources and Environment, 32(11): 74-80. | |
| [10] | 陈剑南, 刘益麟, 李朋飞, 等, 2022. 1901—2016年黄土高原降雨侵蚀力时空变化[J]. 水土保持研究, 29(4): 39-46. |
| CHEN J N, LIU Y L, LI P F, et al., 2022. Spatiotemporal changes of rainfall erosivity on the Loess Playeau during 1901-2016[J]. Research of Soil and Water Conservation, 29(4): 39-46. | |
| [11] | 陈桃, 包安明, 郭浩, 等, 2019. 中亚跨境流域生态脆弱性评价及其时空特征分析——以阿姆河流域为例[J]. 自然资源学报, 34(12): 2643-2657. |
|
CHEN T, BAO A M, GUO H, et al., 2019. Ecological vulnerability assessment for a transboundary basin in Central Asia and its spatiotemporal characteristics analysis: Taking Amu Darya River Basin as an example[J]. Journal of Natural Resources, 34(12): 2643-2657.
DOI URL |
|
| [12] | 陈玉兰, 焦菊英, 田红卫, 等, 2022. 黄土高原归一化植被指数与自然环境因子的空间关联性——基于地理探测器[J]. 生态学报, 42(9): 3569-3580. |
| CHEN Y L, JIAO J Y, TIAN H W, et al., 2022. Spation correlation analysis between vegetation NDVI and natural environmental factors based on geographical detector on the Loess Plateau[J]. Acta Ecologica Sinica, 42(9): 3569-3580. | |
| [13] |
何敏, 王鹤松, 孙建新, 2019. 基于植被生产力的西南地区生态系统脆弱性特征[J]. 应用生态学报, 30(2): 429-438.
DOI |
| HE M, WANG H S, SUN J X, 2019. Characters of ecosystem vulnerability in southwestern China based on vegetation productivity[J]. Chinese Journal of Applied Ecology, 30(2): 429-438. | |
| [14] |
贺鹏, 毕如田, 徐立帅, 等, 2022. 基于地理探测的黄土高原植被生长对气候的响应[J]. 应用生态学报, 33(2):448-456.
DOI |
| HE P, BI R T, XU L S, et al., 2022. Using geographical detection to analyze responses of vegetation growth to climate change in the Loess Plateau, China[J]. Chinese Journal of Applied Ecology, 33(2): 448-456. | |
| [15] | 金丽娟, 许泉立, 2022. 基于SRP模型的四川省生态脆弱性评价[J]. 生态科学, 41(2): 156-165. |
|
JIN L J, XU Q L, 2022. Ecological vulnerability assessment of Sichuan Province based on SRP model[J]. Ecological Sciences, 41(2): 156-165.
DOI URL |
|
| [16] | 李路, 孙桂丽, 陆海燕, 等, 2021. 喀什地区生态脆弱性时空变化及驱动力分析[J]. 干旱区地理, 44(1): 277-288. |
| LI L, SUN G L, LU H Y, et al., 2021. Spatial-temporal variation and driving forces of ecological vulnerability in Kashi Prefecture[J]. Arid Land Geography, 44(1): 277-288. | |
| [17] | 刘静, 温仲明, 刚成诚, 2020. 黄土高原不同植被覆被类型NDVI对气候变化的响应[J]. 生态学报, 40(2): 678-691. |
| LIU J, WEN Z M, GANG C C, 2020. Normalized difference vegetation index of different vegetation cover types and its responses to climate change in the Loess Plateau[J]. Acta Ecologica Sinica, 40(2): 678-691. | |
| [18] |
刘军会, 邹长新, 高吉喜, 等, 2015. 中国生态环境脆弱区范围界定[J]. 生物多样性, 23(6): 725-732.
DOI |
|
LIU J H, ZOU C X, GAO J X, et al., 2015. Location determination of ecologically vulnerable regions in China[J]. Biodiversity Science, 23(6): 725-732.
DOI |
|
| [19] |
刘洋洋, 王倩, 杨悦, 等, 2019. 黄土高原草地净初级生产力时空动态及其影响因素[J]. 应用生态学报, 30(7): 2309-2319.
DOI |
|
LIU Y Y, WANG Q, YANG Y, et al., 2019. Spatial-temporal dynamics of grassland NPP and its driving factors in the Loess Plateau, China[J]. Chinese Journal of Applied Ecology, 30(7): 2309-2319.
DOI |
|
| [20] | 苏胜亮, 高明, 徐锦娟, 等, 2022. 宁夏海原县生态脆弱性与经济贫困空间耦合关系[J]. 水土保持研究, 29(3): 327-333. |
| SU S L, GAO M, XU J J, et al., 2022. Spatial coupling relationship between ecological fragility and economic poverty in Haiyuan County of Ningxia[J]. Research of Soil and Water Conservation, 29(3): 327-333. | |
| [21] | 孙桂丽, 陆海燕, 郑佳翔, 等, 2022. 新疆生态脆弱性时空演变及驱动力分析[J]. 干旱区研究, 39(1): 258-269. |
| SUN G L, LU H Y, ZHENG J X, et al., 2022. Spatio-temporal variation of ecological vulnerability in Xinjiang and driving force analysis[J]. Arid Zone Research, 39(1): 258-269. | |
| [22] | 王鹤松, 何敏, 闫薇, 等, 2021. 基于遥感总初级生产力的天山-塔里木绿洲地区生态系统脆弱性研究[J]. 生态学报, 41(24): 9729-9737. |
| WANG H S, HE M, YAN W, et al, 2021. Ecosystem vulnerability in the Tianshan Mountains and Tarim Oasis based on remote sensed gross primary[J]. Acta Ecologica Sinica, 41(24): 9729-9737. | |
| [23] |
王劲峰, 徐成东, 2017. 地理探测器: 原理与展望[J]. 地理学报, 72(1): 116-134.
DOI |
| WANG J F, XU C D, 2017. Geodetector: Principle and prospective[J]. Acta Geographical Sinica, 72(1): 116-134. | |
| [24] | 王佳宁, 薛东前, 马蓓蓓, 等, 2020. 黄土高原地区矿产资源型城市脆弱性及其人口响应[J]. 干旱区地理, 43(6): 1679-1690. |
| WANG J N, XUE D Q, MA B B, et al., 2020. Vulnerability and population response of mineral resource-based cities in the Loess Plateau[J]. Arid Land Geography, 43(6): 1679-1690. | |
| [25] | 王丽霞, 史园莉, 张宏伟, 等, 2021. 2000—2020年北方农牧交错区植被生态功能变化及驱动因子分析[J]. 生态环境学报, 30(10): 1990-1998. |
| WANG L X, SHI Y L, ZHANG H W, et al., 2021. Analysis of vegetation ecological function changes and driving factors in farming-pastoral ecotone in northern China from 2000 to 2020[J]. Ecology and Environmental Sciences, 30(10): 1990-1998. | |
| [26] | 肖桐, 王军邦, 陈卓奇, 2010. 三江源地区基于净初级生产力的草地生态系统脆弱性特征[J]. 资源科学, 32(2): 323-330. |
| XIAO T, WANG J B, CHEN Z Q, 2010. Vulnerability of grassland ecosystems in the Sanjiangyuan region based on NPP[J]. Resources Science, 32(2): 323-330. | |
| [27] | 修丽娜, 颜长珍, 钱大文, 等, 2019. 生态工程背景下黄土高原植被变化时空特征及其驱动力[J]. 水土保持通报, 39(4): 214-221. |
| XIU L N, YAN C Z, QIAN D W, et al., 2019. Analysis of spatial-temporal change and driving forces of vegetation in Loess Plateau under background of ecological engineering[J]. Bulletin of Soil and Water Conservation, 39(4): 214-221. | |
| [28] | 徐广才, 康慕谊, 贺丽娜, 等, 2009. 生态脆弱性及其研究进展[J]. 生态学报, 29(5): 2578-2588. |
| XU G C, KANG M Y, HE L N, et al., 2009. Advances in research on ecological vulnerability[J]. Chinese Journal of Ecology, 29(5): 2578-2588. | |
| [29] |
徐兴良, 于贵瑞, 2022. 基于生态系统演变机理的生态系统脆弱性、适应性与突变理论[J]. 应用生态学报, 33(3): 623-628.
DOI |
| XU X L, YU G R, 2022. Theories of ecosystem vulnerability, adaptation and catastrophe based on the mechanisms of ecological succession[J]. Chinese Journal of Applied Ecology, 33(3): 623-628. | |
| [30] | 鄢继尧, 赵媛, 2020. 近三十年我国生态脆弱区研究热点与展望[J]. 南京师大学报(自然科学版), 43(4): 74-85. |
| YAN J Y, ZHAO Y, 2020. Research hotspots and prospects of ecologically vulnerable area in China in the past three decades[J]. Journal of Nanjing Normal University (Natural Science Edition), 43(4): 74-85. | |
| [31] | 杨丹, 王晓峰, 2022. 黄土高原气候和人类活动对植被NPP变化的影响[J]. 干旱区研究, 39(2): 584-593. |
| YANG D, WANG X F, 2022. Contribution of climatic change and human activities to changes in net primary productivity in the Loess Plateau[J]. Arid Zone Research, 39(2): 584-593. | |
| [32] | 杨飞, 马超, 方华军, 2019. 脆弱性研究进展: 从理论研究到综合实践[J]. 生态学报, 39(2): 441-453 |
| YANG F, MA C, FANG H J, 2019. Research progress on vulnerability: From theoretical research to comprehensive practice[J]. Acta Ecologica Sinica, 39(2): 441-453. | |
| [33] |
杨晴青, 杨新军, 高岩辉, 2019. 1980年以来黄土高原半干旱区乡村人居环境系统脆弱性时序演变——以陕西省佳县为例[J]. 地理科学进展, 38(5): 756-771.
DOI |
|
YANG Q Q, YANG X J, GAO Y H, 2019. Change in vulnerability of rural human settlement in the semi-arid area of the Loess Plateau since 1980: A case study of Jiaxian County, Shaanxi Province[J]. Progress in Geography, 38(5): 756-771.
DOI |
|
| [34] | 杨雯娜, 周亮, 孙东琪, 2021. 基于分区-集成的黄河流域生态脆弱性评价[J]. 自然资源遥感, 33(3): 211-218. |
| YANG W N, ZHAO L, SUN D Q, 2021. Ecological vulnerability assessment of the Yellow River basin based on partition-integration concept[J]. Remote Sensing for Natural Resources, 33(3): 211-218. | |
| [35] | 于贵瑞, 徐兴良, 王秋风, 2020. 全球变化对生态脆弱区资源环境承载力影响的研究进展[J]. 中国基础科学, 22(5): 16-20. |
| YU G R, XU X L, WANG Q F, 2020. Progress of the effects of global changes on the resource and environmental carrying capacity of the ecologically fragile areas[J]. China Basic Science, 22(5): 16-20. | |
| [36] | 於琍, 李克让, 陶波, 2012. 长江中下游区域生态系统对极端降水的脆弱性评估研究[J]. 自然资源学报, 27(1): 82-89. |
| YU L, LI K R, TAO B, 2012. Assessment on ecosystem vulnerability to extreme precipitation in the upper and middle Yangtze valley[J]. Journal of Natural Resources, 27(1): 82-89. | |
| [37] | 张家政, 李崇贵, 王涛, 2022. 黄土高原植被覆盖时空变化及原因[J]. 水土保持研究, 29(1): 224-230. |
| ZHANG J Z, LI C G, WANG T, 2022. Dynamic changes of vegetation coverage on the Loess Plateau and its factors[J]. Research of Soil and Water Conservation, 29(1): 224-230. | |
| [38] | 张良侠, 樊江文, 张海燕, 等, 2022. 黄土高原地区生态脆弱性时空变化及其驱动因子分析[J]. 环境科学, 43(9): 4902-4910. |
|
ZHANG L X, FAN J W, ZHANG H Y, et al., 2022. Spatial-temporal variations and their driving forces of the ecological vulnerability in the Loess Plateau[J]. Environmental Science, 43(9): 4902-4910.
DOI URL |
|
| [39] | 张学玲, 余文波, 蔡海生, 等, 2018. 区域生态环境脆弱性评价方法研究综述[J]. 生态学报, 38(16): 5970-5981. |
| ZHANG X L, YU W B, CAI H S, et al., 2018. Review of the evaluation methods of regional eco-environmental vulnerability[J]. Acta Ecologica Sinica, 38(16): 5970-5981. | |
| [40] | 张学渊, 魏伟, 周亮, 等, 2021. 西北干旱区生态脆弱性时空演变分析[J]. 生态学报, 41(12): 4707-4719. |
| ZHANG X Y, WEI W, ZHOU L, et al., 2021. Analysis on spatio-temporal evolution of ecological vulnerability in arid areas of Northwest China[J]. Acta Ecologica Sinica, 41(12): 4707-4719. | |
| [41] | 朱琪, 王亚楠, 周旺明, 等, 2021. 东北森林带生态脆弱性时空变化及其驱动因素[J]. 生态学杂志, 40(11): 3474-3482. |
| ZHU Q, WANG Y N, ZHOU W M, et al., 2021. Spatiotemporal changes and driving factors of ecological vulnerability in Northeast China forest belt[J]. Chinese Journal of Ecology, 40(11): 3474-3482. |
| [1] | 王琳, 卫伟. 黄土高原典型县域生态系统服务变化特征及驱动因素[J]. 生态环境学报, 2023, 32(6): 1140-1148. |
| [2] | 李建辉, 党争, 陈琳. 黄河几字弯都市圈PM2.5时空特征及影响因素分析[J]. 生态环境学报, 2023, 32(4): 697-705. |
| [3] | 王成武, 罗俊杰, 唐鸿湖. 基于InVEST模型的太行山沿线地区生态系统碳储量时空分异驱动力分析[J]. 生态环境学报, 2023, 32(2): 215-225. |
| [4] | 付蓉, 武新梅, 陈斌. 城市地表温度空间分异及驱动因子差异性分析——以合肥市为例[J]. 生态环境学报, 2023, 32(1): 110-122. |
| [5] | 齐月, 张强, 胡淑娟, 蔡迪花, 赵福年, 陈斐, 张凯, 王鹤龄, 王润元. 黄土高原地区气候变化及其对冬小麦生产潜力的影响[J]. 生态环境学报, 2022, 31(8): 1521-1529. |
| [6] | 陈文裕, 夏丽华, 徐国良, 余世钦, 陈行, 陈金凤. 2000—2020年珠江流域NDVI动态变化及影响因素研究[J]. 生态环境学报, 2022, 31(7): 1306-1316. |
| [7] | 李梦华, 韩颖娟, 赵慧, 王云霞. 基于地理探测器的宁夏植被覆盖度时空变化特征及其驱动因子分析[J]. 生态环境学报, 2022, 31(7): 1317-1325. |
| [8] | 李登科, 王钊. 气候变化和人类活动对陕西省植被NPP影响的定量分析[J]. 生态环境学报, 2022, 31(6): 1071-1079. |
| [9] | 张恒宇, 孙树臣, 吴元芝, 安娟, 宋红丽. 黄土高原不同植被密度条件下土壤水、碳、氮分布特征[J]. 生态环境学报, 2022, 31(5): 875-884. |
| [10] | 高思琦, 董国涛, 蒋晓辉, 聂桐, 郭欣伟, 党素珍, 李心宇, 李昊洋. 黄河源植被覆盖度变化及空间分布自然驱动力分析[J]. 生态环境学报, 2022, 31(3): 429-439. |
| [11] | 赵锐, 詹梨苹, 周亮, 张军科. 地理探测联合地理加权岭回归的PM2.5驱动因素分析[J]. 生态环境学报, 2022, 31(2): 307-317. |
| [12] | 石智宇, 王雅婷, 赵清, 张连蓬, 朱长明. 2001-2020年中国植被净初级生产力时空变化及其驱动机制分析[J]. 生态环境学报, 2022, 31(11): 2111-2123. |
| [13] | 赵安周, 田新乐. 基于GEE平台的1986-2021年黄土高原植被覆盖度时空演变及影响因素[J]. 生态环境学报, 2022, 31(11): 2124-2133. |
| [14] | 聂桐, 董国涛, 蒋晓辉, 郭欣伟, 党素珍, 郑嘉昊, 李立缠, 王江. 榆林地区植被时空分异特征及其影响因素研究[J]. 生态环境学报, 2022, 31(1): 26-36. |
| [15] | 王金杰, 赵安周, 胡小枫. 京津冀植被净初级生产力时空分布及自然驱动因子分析[J]. 生态环境学报, 2021, 30(6): 1158-1167. |
| 阅读次数 | ||||||
|
全文 |
|
|||||
|
摘要 |
|
|||||