生态环境学报 ›› 2022, Vol. 31 ›› Issue (4): 740-749.DOI: 10.16258/j.cnki.1674-5906.2022.04.012
易嘉慧1,2( ), 何超3, 杨璐1,2, 叶志祥1,2, 田雅1,2, 柯碧钦1,2, 慕航1,2, 涂佩玥4, 韩超然1,2, 洪松1,2,*()
收稿日期:2021-11-29
出版日期:2022-04-18
发布日期:2022-06-22
通讯作者:
*洪松(1973年生),男,教授,博士,研究方向为环境地学。E-mail: songhongpku@126.com作者简介:易嘉慧(1999年生),女,硕士研究生,研究方向为环境地学。E-mail: 2020202050003@whu.edu.cn
基金资助:
YI Jiahui1,2(), HE Chao3, YANG Lu1,2, YE Zhixiang1,2, TIAN Ya1,2, KE Biqin1,2, MU Hang1,2, TU Peiyue4, HAN Chaoran1,2, HONG Song1,2,*()
Received:2021-11-29
Online:2022-04-18
Published:2022-06-22
摘要:
新冠肺炎(COVID-19)疫情期间,全球采取封锁措施给研究气温变化和空气质量变化的关联性提供了机会。基于2015—2020年全球0.1°×0.1°分辨率的气温数据和全球城市逐日主要污染物(PM2.5、NO2和O3)浓度数据,利用空间分析和双变量全局空间自相关等方法,以2015—2019年的滑动平均值为基准值,对比分析了2020年COVID-19疫情期间全球气温和主要大气污染物的时空变化规律,探讨了全球9个区域两者之间的空间关联特征,为制定气候变化和污染物防控政策提供科学参考。结果表明,(1)相比2015—2019年同期基准值,2020年全球气温在COVID-19封锁期间(2020年Q1时段)平均升高0.24 ℃;其中,中亚(1.72 ℃)、东欧和北亚地区(1.70 ℃)2020年年均气温升幅较大;南亚(-0.93 ℃)和北欧(-0.64 ℃)年均气温降幅较大。(2)相比2015—2019年基准值,2020年Q1时段全球PM2.5和NO2浓度分别下降16.41%和29.73%,O3浓度升高7.92%;南亚PM2.5(-22.40 μg·m-3)和NO2(-6.42 μg·m-3)质量浓度下降最显著。对于全球O3质量浓度而言,欧洲显著增加,增幅为2.61 μg·m-3,而亚洲(-0.93 μg·m-3)和北美洲(-1.96 μg·m-3)显著下降。(3)在COVID-19期间各污染物与气温的空间关联性由强及弱依次为O3、NO2和PM2.5。从空间上看,降温区域中,南亚(0.219)和北美洲(0.159)的气温与NO2呈显著空间正相关,各区域气温与O3呈不显著空间关联;升温区域中,北欧(0.558)、南欧(0.406)和西欧(0.284)气温均与O3呈显著空间正相关。疫情封锁期间,大气污染物浓度变化对气温有影响,PM2.5和NO2浓度大幅下降时,当地气温有下降趋势。
中图分类号:
易嘉慧, 何超, 杨璐, 叶志祥, 田雅, 柯碧钦, 慕航, 涂佩玥, 韩超然, 洪松. COVID-19疫情期间全球气温和主要大气污染物浓度变化的空间关联[J]. 生态环境学报, 2022, 31(4): 740-749.
YI Jiahui, HE Chao, YANG Lu, YE Zhixiang, TIAN Ya, KE Biqin, MU Hang, TU Peiyue, HAN Chaoran, HONG Song. Spatial Correlation between Changes in Global Temperature and Major Air Pollutants during the COVID-19 Pandemic[J]. Ecology and Environment, 2022, 31(4): 740-749.
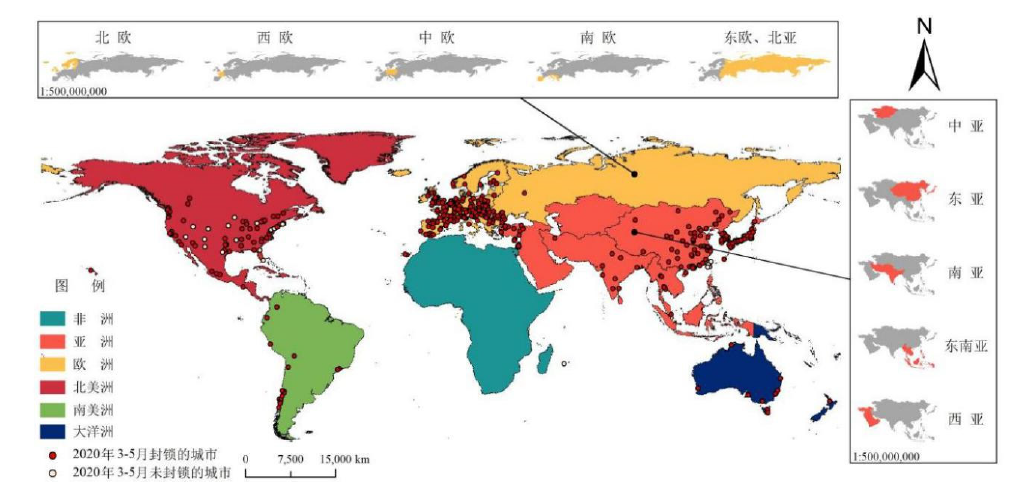
图1 全球城市空气质量监测点示意图
Figure 1 Diagram of global urban air quality monitoring sites
| 时间 | Q1 | Q2 | |||
|---|---|---|---|---|---|
| 平均气温 Average temperature | 2020年相对 变化值 Relative change in 2020 | 平均气温 Average temperature | 2020年相对 变化值 Relative change in 2020 | ||
| 2020 | 8.56 | — | 0.13 | — | |
| 2019 | 8.56 | -0.00 | -0.86 | 0.99 | |
| 2015‒2019 | 8.32 | 0.24 | -0.54 | 0.67 | |
表1 全球2015—2020年Q1、Q2时段平均气温对比分析
Table 1 Global average temperature and its changes during Q1 and Q2 from 2015 to 2020 ℃
| 时间 | Q1 | Q2 | |||
|---|---|---|---|---|---|
| 平均气温 Average temperature | 2020年相对 变化值 Relative change in 2020 | 平均气温 Average temperature | 2020年相对 变化值 Relative change in 2020 | ||
| 2020 | 8.56 | — | 0.13 | — | |
| 2019 | 8.56 | -0.00 | -0.86 | 0.99 | |
| 2015‒2019 | 8.32 | 0.24 | -0.54 | 0.67 | |
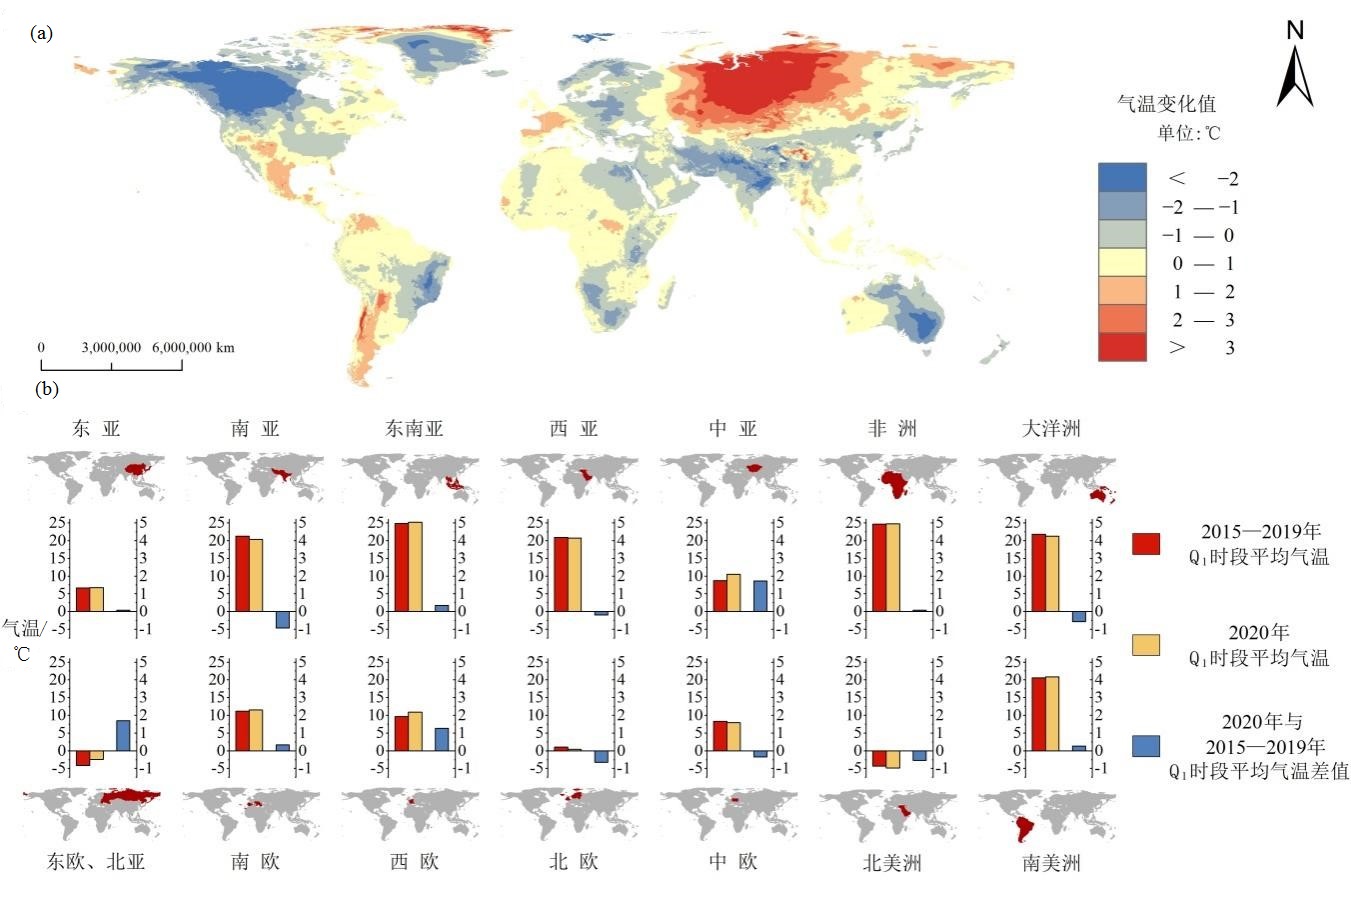
图2 全球2020年Q1时段相对2015—2019年同期平均气温变化图
Figure 2 Global average temperature changes in 2020 compared to those in Q1 period of 2015 to 2019
| PM2.5 | NO2 | O3 | ||||||||||
|---|---|---|---|---|---|---|---|---|---|---|---|---|
| 质量浓度 Mass concentration | 2020年相对 变化值 Relative change in 2020 | 2020年相对变化率 Relative rate of change in 2020/% | 质量浓度 Mass concentration | 2020年相对 变化值 Relative change in 2020 | 2020年相对变化率 Relative rate of change in 2020/% | 质量浓度 Mass concentration | 2020年相对 变化值 Relative change in 2020 | 2020年相对变化率 Relative rate of change in 2020/% | ||||
| Q1 | 2020 | 47.82 | 7.78 | 26.44 | ||||||||
| 2019 | 53.75 | -5.93 | -11.04 | 9.98 | -2.20 | -22.05 | 25.27 | 1.18 | 4.65 | |||
| 2015‒2019 | 57.21 | -9.39 | -16.41 | 11.07 | -3.29 | -29.73 | 24.51 | 1.94 | 7.92 | |||
| Q2 | 2020 | 57.45 | 11.53 | 17.51 | ||||||||
| 2019 | 64.22 | -6.77 | -10.54 | 13.51 | -1.97 | -14.62 | 16.91 | 0.62 | 3.56 | |||
| 2015‒2019 | 65.63 | -8.18 | -12.47 | 14.00 | -2.46 | -17.60 | 16.84 | 0.67 | 3.98 | |||
表2 2015—2020年Q1、Q2时段各污染物(PM2.5、NO2和O3)浓度对比统计
Table 2 Concentration changes of pollutants (PM2.5, NO2 and O3) during Q1and Q3 period from 2015 to 2020 μg∙m-3
| PM2.5 | NO2 | O3 | ||||||||||
|---|---|---|---|---|---|---|---|---|---|---|---|---|
| 质量浓度 Mass concentration | 2020年相对 变化值 Relative change in 2020 | 2020年相对变化率 Relative rate of change in 2020/% | 质量浓度 Mass concentration | 2020年相对 变化值 Relative change in 2020 | 2020年相对变化率 Relative rate of change in 2020/% | 质量浓度 Mass concentration | 2020年相对 变化值 Relative change in 2020 | 2020年相对变化率 Relative rate of change in 2020/% | ||||
| Q1 | 2020 | 47.82 | 7.78 | 26.44 | ||||||||
| 2019 | 53.75 | -5.93 | -11.04 | 9.98 | -2.20 | -22.05 | 25.27 | 1.18 | 4.65 | |||
| 2015‒2019 | 57.21 | -9.39 | -16.41 | 11.07 | -3.29 | -29.73 | 24.51 | 1.94 | 7.92 | |||
| Q2 | 2020 | 57.45 | 11.53 | 17.51 | ||||||||
| 2019 | 64.22 | -6.77 | -10.54 | 13.51 | -1.97 | -14.62 | 16.91 | 0.62 | 3.56 | |||
| 2015‒2019 | 65.63 | -8.18 | -12.47 | 14.00 | -2.46 | -17.60 | 16.84 | 0.67 | 3.98 | |||
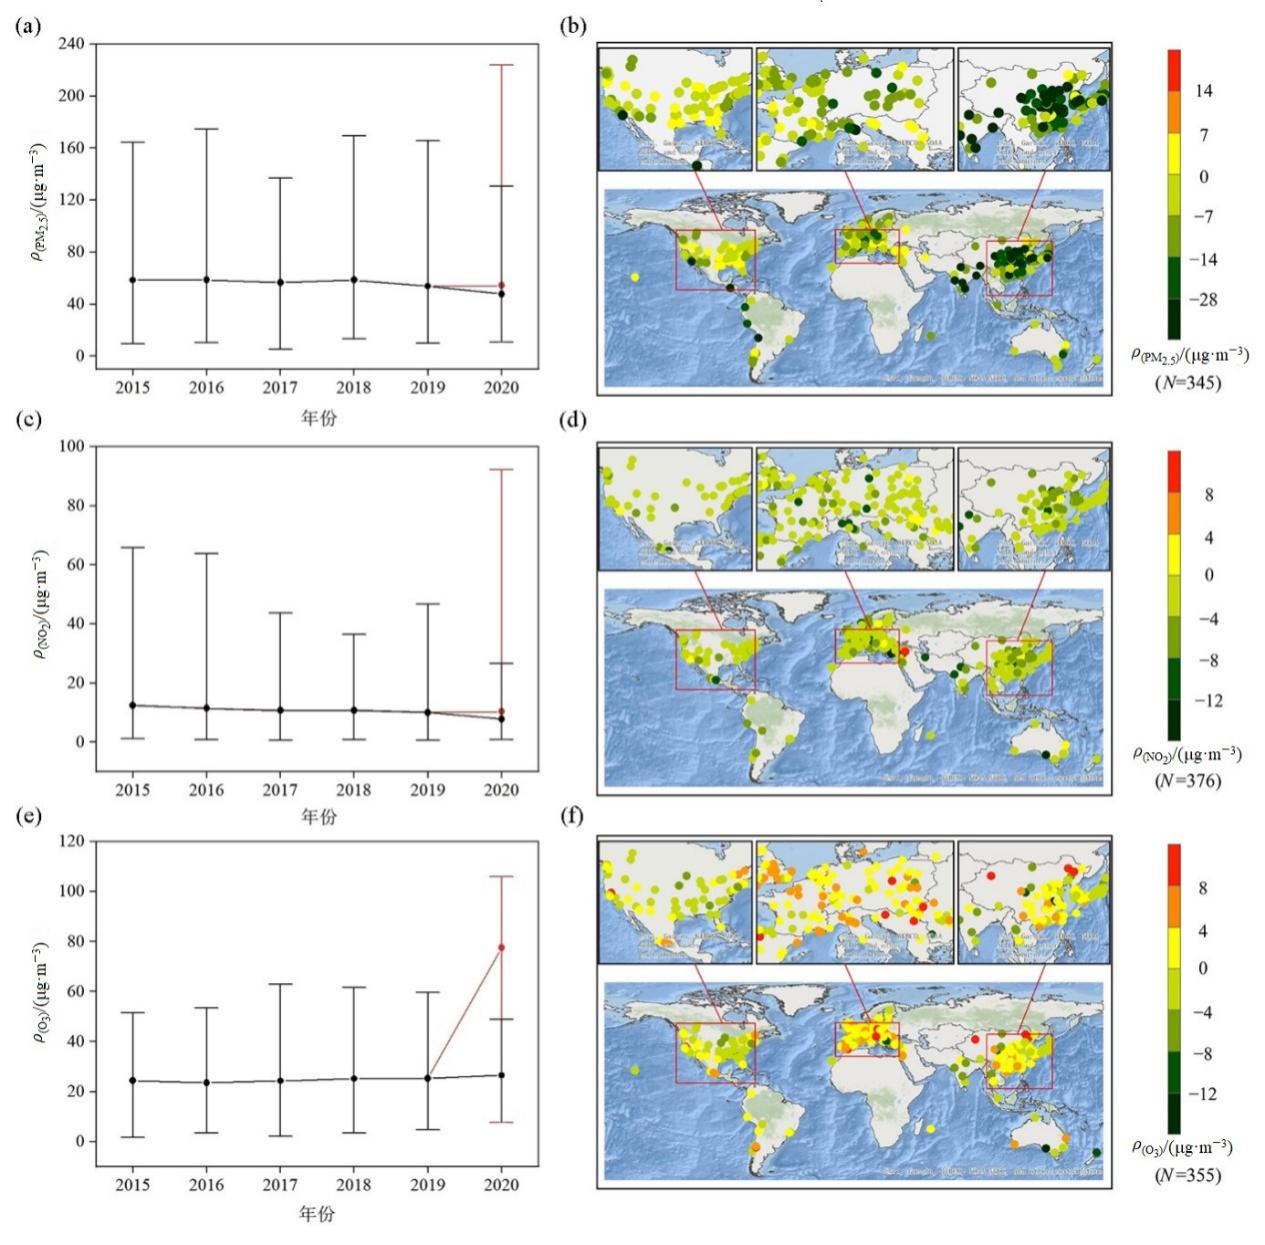
图3 2020年Q1时段全球大气污染物(PM2.5、NO2和O3)浓度变化 (a)、(c)、(e)2015—2020 年逐年Q1 时段全球 PM2.5(a)、NO2(c)和 O3(e)浓度变化(黑点是实际观测值;2020 年红点是根据 2015—2019 年Q1 时段污染物浓度线性外推的结果;误差条代表不同站点平均浓度的范围)(b)、(d)、(f)2020 年相对 2015—2019 年 Q1 时段全球 PM2.5(b)、NO2(d)和 O3(f)浓度变化时空分布图
Figure 3 Changes of global atmospheric pollutant (PM2.5, NO2 and O3) concentration in Q1 of 2020 (a), (c) and (e) represents the global concentrations change of PM2.5, NO2 and O3 in respectively, in Q1 period from 2015 to 2020 (The black dots highlight the actual observation, while the red dots within 2020 indicate the linear extrapolation of pollutant concentration during Q1 period from 2015 to 2019. Here the error bar represents the range of average concentrations at different sites) (b), (d) and (f) represents that spatial and temporal distribution of global PM2.5, NO2 and O3 concentrations respectively, in Q1 during 2020, which is compared with 2015-2019.
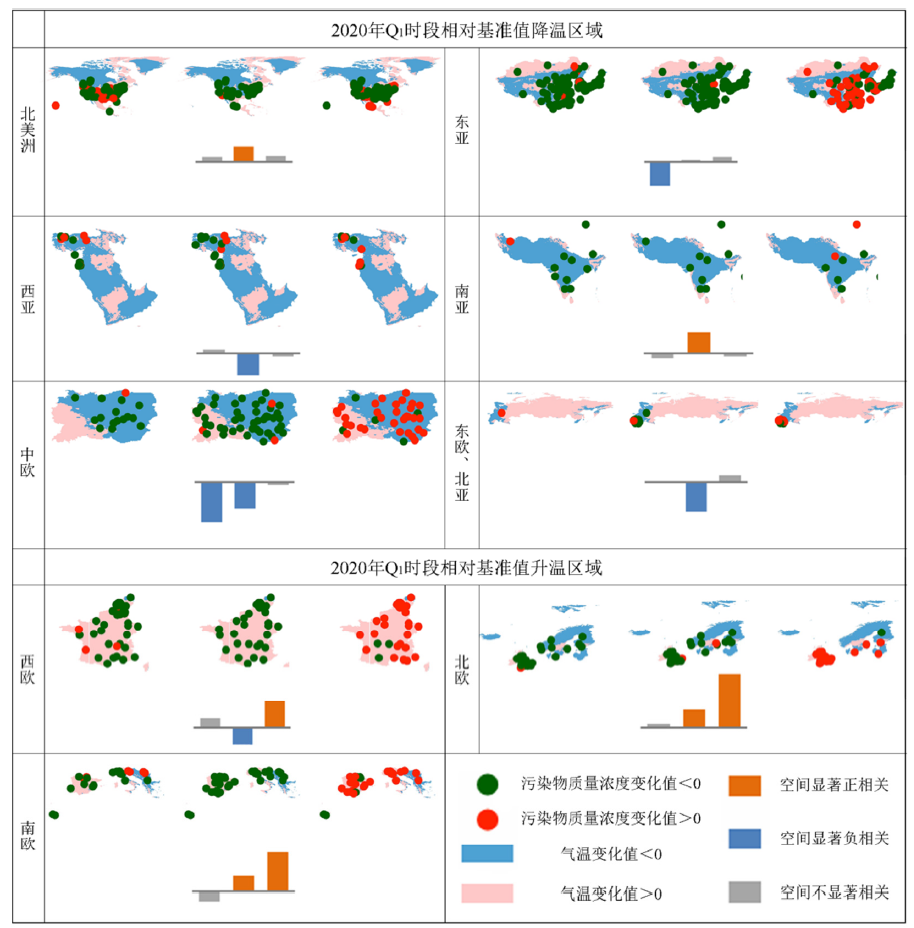
图4 全球气温变化和各污染物浓度变化的空间关联情况 区域图为各区域不同污染物的空间分布图,从左到右为PM2.5、NO2和O3。柱状图为不同污染物与气温的双变量Moran’s I值,从左到右为PM2.5、NO2和O3,其中灰色柱状图表示统计值在P=0.05水平上不显著,蓝色或橙色柱状图表示统计值在P=0.05 水平上显著
Figure 4 Spatial correlations between global temperature changes and concentration changes of various pollutants The regional map shows the spatial distribution of different pollutants in each region. PM2.5, NO2 and O3 ranks from left to right. The bar chart here displays bivarate Moran's I values of different pollutants and air temperature. The gray bar chart indicates that the statistical values are insignificant at P=0.05, while the blue or orange bar chart indicates that the statistical values are significant at P=0.05.
| [1] |
ANSELIN L, 1995. Local indicators of spatial association-LISA[J]. Geographical Analysis, 27(2): 93-115.
DOI URL |
| [2] |
CONLEY A J, WESTERVELT D M, LAMARQUE J F, et al., 2018. Multimodel surface temperature responses to removal of US Sulfur dioxide emissions[J]. Journal of Geophysical Research-Atmospheres, 123(5): 2773-2796.
DOI URL |
| [3] | FORSTER P M, FORSTER H I, EVANS M J, et al., 2020. Current and future global climate impacts resulting from COVID-19[J]. Nature Climate Change, 10(10): 971. |
| [4] |
FUENTES R, GALEOTTI M, LANZA A, et al., 2020. COVID-19 and climate change: A tale of two global problems[J]. Sustainability, 12(20): 1-14.
DOI URL |
| [5] | GETTELMAN A, LAMBOLL R, BARDEEN C G, et al., 2021. Climate impacts of COVID-19 induced emission changes[J]. Geophysical Research Letters, 48(3): 1-10. |
| [6] |
GIRACH I A, OJHA N, BABU S S, 2021. Ozone chemistry and dynamics at a tropical coastal site impacted by the COVID-19 lockdown[J]. Journal of Earth System Science, 130(3): 158-165.
DOI URL |
| [7] | GUO H, CHENG T H, GU X F, et al., 2017. Assessment of PM2.5 concentrations and exposure throughout China using ground observations[J]. Science of the Total Environment, 601(1): 1024-1030. |
| [8] |
HE C, HONG S, ZHANG L, et al., 2021. Global, continental, and national variation in PM2.5, O3, and NO2 concentrations during the early 2020 COVID-19 lockdown[J]. Atmospheric Pollution Research, 12(3): 136-145.
DOI URL |
| [9] |
HEYD T, 2021. COVID-19 and climate change in the times of the Anthropocene[J]. Anthropocene Review, 8(1): 21-36.
DOI URL |
| [10] | HU M, CHEN Z B, CUI H Y, et al., 2021. Air pollution and critical air pollutant assessment during and after COVID-19 lockdowns: Evidence from pandemic hotspots in China, the Republic of Korea, Japan, and India[J]. Atmospheric Pollution Research, 12(2): 316-329. |
| [11] |
HUGHES K A, CONVEY P, 2020. Implications of the COVID-19 pandemic for Antarctica[J]. Antarctic Science, 32(6): 426-439.
DOI URL |
| [12] |
KUMARI P, TOSHNIWAL D, 2022. Impact of lockdown measures during COVID-19 on air quality: A case study of India[J]. International Journal of Environmental Health Research, 32(3): 503-510.
DOI URL |
| [13] | LI M, ZHANG Q, KUROKAWA J, et al., 2017. MIX: A mosaic Asian anthropogenic emission inventory under the international collaboration framework of the MICS-Asia and HTAP[J]. Atmospheric Chemistry and Physics, 17(2): 935-963. |
| [14] |
LIU Z, CIAIS P, DENG Z, et al., 2020. Near-real-time monitoring of global CO2 emissions reveals the effects of the COVID-19 pandemic[J]. Nature Communications, 11(1): 1-12.
DOI URL |
| [15] | LU X, ZHANG L, WANG X L, et al., 2020. Rapid increases in warm-season surface Ozone and resulting health impact in China since 2013 [J]. Environmental Science & Technology Letters, 7(4): 240-247. |
| [16] |
PELOSI A, TERRIBILE F, D'URSO G, et al., 2020. Comparison of ERA5-Land and UERRA MESCAN-SURFEX reanalysis data with spatially interpolated weather observations for the regional assessment of reference evapotranspiration[J]. Water, 12(6): 1-22.
DOI URL |
| [17] |
RUPANI P F, NILASHI M, ABUMALLOH R A, et al., 2020. Coronavirus pandemic (COVID-19) and its natural environmental impacts[J]. International Journal of Environmental Science and Technology, 17(11): 4655-4666.
DOI URL |
| [18] | TOBLER W R, 1970. A computer movie simulating urban growth in the Detroit Region[J]. Economic Geography, 2(46): 234-240. |
| [19] |
USMAN M, HUSNAIN M, RIAZ A, et al., 2021. Climate change during the COVID-19 outbreak: Scoping future perspectives[J]. Environmental Science and Pollution Research, 28(35): 49302-49313.
DOI URL |
| [20] | VENTER Z S, AUNAN K, CHOWDHURY S, et al., 2020. COVID-19 lockdowns cause global air pollution declines[J]. Proceedings of the National Academy of Sciences of the United States of America, 117(32): 18984-18990. |
| [21] |
WANG Y, YAN P, JI F, et al., 2021. Unnatural trend of global land long-term surface air temperature change[J]. International Journal of Climatology, 41(4): 2330-2341.
DOI URL |
| [22] | WEBER J, SHIN Y M, SYKES J S, et al., 2020. Minimal climate impacts from short-lived climate forcers following emission reductions related to the COVID-19 pandemic[J]. Geophysical Research Letters, 47(20): 1-11. |
| [23] |
WOLFF E, 1992. The influence of global and local atmospheric pollution on the chemistry of Antarctic snow and ice[J]. Marine Pollution Bulletin, 25(9-12): 274-280.
DOI URL |
| [24] |
ZANG S M, BENJENK I, BREAKEY S, et al., 2021. The intersection of climate change with the era of COVID-19[J]. Public Health Nursing, 38(2): 321-335.
DOI URL |
| ZHANG R X, ZHANG Y Z, LIN H P, et al., 2020. NOxemission reduction and recovery during COVID-19 in East China[J]. Atmosphere, 11(4): 1-15. | |
| [25] | 韩余, 周国兵, 陈道劲, 等, 2020. 重庆市臭氧污染及其气象因子预报方法对比研究[J]. 气象与环境学报, 36(4): 59-66. |
| HAN Y, ZHOU G B, CHEN D J, et al., 2020. Characteristics of ozone pollution and forecasting technique based on meteorological factors in Chongqing[J]. Journal of Meteorology and Environment, 36(4): 59-66. | |
| [26] | 黄小刚, 赵景波, 辛未冬, 2021. 基于网格的长三角PM2.5分布影响因素及交互效应[J]. 环境科学, 42(7): 3107-3117. |
| HUANG X G, ZHAO J B, XIN W D, 2021. Factors and their interaction effects on the distribution of PM2.5 in the Yangtze River Delta based on grids[J]. Environmental Science, 42(7): 3107-3117. | |
| [27] | 姬杨蓓蓓, 莫世杰, 成枫, 2020. 公共交通管控对新冠肺炎病毒 (COVID-19)疫情爆发期的影响分析[J]. 重庆交通大学学报 (自然科学版), 39(8): 20-28. |
| JIYANG B B, MO S J, CHENG F, 2020. Influence analysis of public transport controls against Novel Coronavirus Pneumonia (COVID-19) during outbreak period[J]. Journal of Chongqing Jiaotong University (Natural Science), 39(8): 20-28. | |
| [28] | 纪源, 赵秋月, 陈凤, 等, 2021. 新冠肺炎疫情期间南京市PM2.5中碳质组分污染特征分析[J]. 生态与农村环境学报, 37(8): 992-1000. |
| JI Y, ZHAO Q Y, CHEN F, et al., 2021. Characteristics of carbonaceous aerosols in ambient PM2.5 during the COVID-19 period in Nanjing[J]. Journal of Ecology and Rural Environment, 37(8): 992-1000. | |
| [29] | 李婷慧, 蔡晓斌, 董佳丹, 等, 2020. COVID-19疫情不同阶段管控措施对大气污染物浓度的影响研究[J]. 华中师范大学学报(自然科学版), 54(6): 1051-1058. |
| LI T H, CAI X B, DONG J D, et al., 2020. The impact of COVID-19 control measures on atmospheric pollutant concentrations in different epidemic areas of China[J]. Journal of Central China Normal University (Natural Sciences), 54(6): 1051-1058. | |
| [30] | 吕桅桅, 李兰, 2018. 湖北省主要观测站PM2.5污染特征及气象要素的影响分析[J]. 生态环境学报, 27(11): 2073-2080. |
| LÜ Z Z, LI L, 2018. PM2.5 pollution characteristics in main observation stations in Hubei and the impact analysis of meteorological factors[J]. Ecology and Environmental Sciences, 27(11): 2073-2080. | |
| [31] | 毛显强, 曾桉, 邢有凯, 等, 2021. 从理念到行动: 温室气体与局地污染物减排的协同效益与协同控制研究综述[J]. 气候变化研究进展, 17(3): 255-267. |
| MAO X Q, ZENG A, XING Y K, et al., 2021. From concept to action: A review of research on co-benefits and co-control of greenhouse gases and local air pollutants reductions[J]. Climate Change Research, 17(3): 255-267. | |
| [32] | 缪明榕, 吴辉, 朱毅, 等, 2020. 南通市大气污染物浓度变化特征及其与气象因素的关系[J]. 科学技术与工程, 20(22): 9248-9254. |
| MIAO M R, WU H, ZHU Y, et al., 2020. Variation characteristics of atmospheric pollutants’ concentration and its relations with meteorological factors in Nantong City[J]. Science Technology and Engineering, 20(22): 9248-9254. | |
| [33] | 倪超, 李新江, 向涛, 等, 2018. 重庆涪陵大气污染物特征及其与气象要素的关系[J]. 西南师范大学学报(自然科学版), 43(9): 123-130. |
| NI C, LI X J, XIANG T, et al., 2018. Correlation analysis of atmospheric pollutants and meteorological factors in fulling area of Chongqing[J]. Journal of Southwest China Normal University (Natural Science Edition), 43(9): 23-130. | |
| [34] |
沈中健, 曾坚, 2021. 闽南三市城镇发展与地表温度的空间关系[J]. 地理学报, 76(3): 566-583.
DOI |
| SHEN Z J, ZENG J, 2021. Spatial relationship of urban development to land surface temperature in three cities of southern Fujian[J]. Acta Geographica Sinica, 76(3): 566-583. | |
| [35] | 谢祖欣, 冯宏芳, 林文, 等, 2020. 气象条件对福州市夏季臭氧O3浓度的影响研究[J]. 生态环境学报, 29(11): 2251-2261. |
| XIE Z X, FENG H F, LIN W, et al., 2020. Meteorological factors impact on summertime ozone O3 concentration in Fuzhou[J]. Ecology and Environmental Sciences, 29(11): 2251-2261. | |
| [36] |
徐冬, 黄震方, 黄睿, 2019. 基于空间面板计量模型的雾霾对中国城市旅游流影响的空间效应[J]. 地理学报, 74(4): 814-830.
DOI |
| XU D, HUANG Z F, HUANG R, 2019. The spatial effects of haze on tourism flows of Chinese cities: Empirical research based on the spatial panel econometric model[J]. Acta Geographica Sinica, 74(4): 814-830. | |
| [37] | 臧星华, 鲁垠涛, 姚宏, 等, 2015. 中国主要大气污染物的时空分布特征研究[J]. 生态环境学报, 24(8): 1322-1329. |
| ZANG X H, LU Y T, YAO H, et al., 2015. The temporal and spatial distribution characteristics of main air pollutants in China[J]. Ecology and Environmental Sciences, 24(8): 1322-1329. | |
| [38] | 赵宗慈, 罗勇, 黄建斌, 2021. 气象、环境与新冠肺炎有关系吗?[J]. 气候变化研究进展, 17(3): 377-378. |
| ZHAO Z C, LUO Y, HUANG J B, 2021. Are there relationships between meteorology, environment and COVID-19?[J]. Climate Change Research, 17(03): 377-378. | |
| [39] | 朱松丽, 2020. “后疫情”时期的全球气候治理[J]. 气候变化研究进展, 16(6): 758-762. |
| ZHU S L, 2020. Global climate governance in Post-Pandemic time[J]. Climate Change Research, 16(6): 758-762. |
| [1] | 刘桢迪, 宋艳宇, 王宪伟, 谭稳稳, 张豪, 高晋丽, 高思齐, 杜宇. 冻土区泥炭地植物生长及碳氮特征对模拟增温的响应[J]. 生态环境学报, 2022, 31(9): 1765-1772. |
| [2] | 蔡国俊, 袁桂香, 符辉. 基于文献计量分析的生态网络研究现状和趋势[J]. 生态环境学报, 2022, 31(8): 1690-1699. |
| [3] | 李美娇, 何凡能, 赵彩杉, 杨帆. 全球历史LUCC数据集新疆地区耕地数据可靠性评估[J]. 生态环境学报, 2022, 31(6): 1215-1224. |
| [4] | 陈丽娟, 周文君, 易艳芸, 宋清海, 张一平, 梁乃申, 鲁志云, 温韩东, MOHD Zeeshan, 沙丽清. 云南哀牢山亚热带常绿阔叶林土壤CH4通量特征[J]. 生态环境学报, 2022, 31(5): 949-960. |
| [5] | 李成伟, 刘章勇, 龚松玲, 杨伟, 李绍秋, 朱波. 稻作模式改变对稻田CH4和N2O排放的影响[J]. 生态环境学报, 2022, 31(5): 961-968. |
| [6] | 李喆, 陈圣宾, 陈芝阳. 地表温度与土地利用类型间的空间尺度依赖性——以成都为例[J]. 生态环境学报, 2022, 31(5): 999-1007. |
| [7] | 温智峰, 魏识广, 李林, 叶万辉, 练琚愉. 南亚热带常绿阔叶林植物不同分类水平上的空间分布格局及空间关联[J]. 生态环境学报, 2022, 31(3): 440-450. |
| [8] | 刘秉儒. 土壤微生物呼吸热适应性与微生物群落及多样性对全球气候变化响应研究[J]. 生态环境学报, 2022, 31(1): 181-186. |
| [9] | 姚世庭, 芦光新, 邓晔, 党宁, 王英成, 张海娟, 颜珲璘. 模拟增温对土壤真菌群落组成及多样性的影响[J]. 生态环境学报, 2021, 30(7): 1404-1411. |
| [10] | 侯素霞, 张鉴达, 李静. 上海市大气污染物时空分布及其相关性因子分析[J]. 生态环境学报, 2021, 30(6): 1220-1228. |
| [11] | 陈思, 王灿, 李想, 李明锐, 湛方栋, 李元, 祖艳群, 何永美. 不同UV-B辐射增幅对稻田土壤酶活性、活性有机碳含量及温室气体排放的影响[J]. 生态环境学报, 2021, 30(6): 1260-1268. |
| [12] | 卢乔倩, 江涛, 柳丹丽, 刘智勇. 中国不同植被覆盖类型NDVI对气温和降水的响应特征[J]. 生态环境学报, 2020, 29(1): 23-34. |
| 阅读次数 | ||||||
|
全文 |
|
|||||
|
摘要 |
|
|||||