生态环境学报 ›› 2026, Vol. 35 ›› Issue (9): 1436-1444.DOI: 10.16258/j.cnki.1674-5906.2026.09.010
陈盈巧1( ), 关净文1, 王蕴赟2, 于兴娜1,*()
收稿日期:2026-04-02
修回日期:2026-08-11
接受日期:2026-08-13
出版日期:2026-09-18
发布日期:2026-09-16
通讯作者:
于兴娜, E-mail: 作者简介:陈盈巧(2003年生),女,硕士研究生,主要研究方向为大气环境。E-mail: chenyq_cc@qq.com
基金资助:
Chen Yingqiao1(), Guan Jingwen1, Wang Yunyun2, Yu Xingna1,*()
Received:2026-04-02
Revised:2026-08-11
Accepted:2026-08-13
Online:2026-09-18
Published:2026-09-16
摘要:
【目的】明确杭州市夏季大气挥发性有机物(VOCs)对臭氧(O3)污染的影响,为精准防控提供依据。【方法】基于当地夏季观测数据,采用光化学年龄参数法校正105种VOCs的观测体积分数,利用正交矩阵因子分解(PMF)模型进行来源解析。【结果】观测期间O3小时平均质量浓度为97.37 μg∙m−3,污染期均值为139.28 μg∙m−3,是非污染期的1.55倍。VOCs平均观测体积分数为26.35×10⁻⁹,初始体积分数为44.11×10⁻⁹;初始臭氧生成潜势(OFP)总量为220.71×10⁻⁹,损耗率为78.54%。含氧VOCs(OVOCs)和烷烃是体积分数优势组分,占观测VOCs的62.62%、初始VOCs的52.70%;烯烃的OFP值最高且体积分数损耗率超过80%。O3污染期VOCs平均体积分数高于非污染期,但OFP值略低;非污染期烯烃与OVOCs的光化学损耗更大,且平均湿度更高。高湿条件有利于·OH生成,进而加速损耗。PMF模型基于观测数据解析出二次源、工业排放、油气挥发、溶剂涂料、工业清洗和天然源6个污染源;经光化学校正,污染源减少至5个,分别为燃烧源、工业排放、油气挥发、溶剂涂料和天然源,且燃烧源以26.52%的贡献率居于首位。【结论】光化学损耗会掩盖环境VOCs的真实排放特征,应在科学研究与政策制定中引入光化学校正,以准确识别真实排放来源。
中图分类号:
陈盈巧, 关净文, 王蕴赟, 于兴娜. 杭州城区夏季VOCs光化学损耗特征及其来源分析[J]. 生态环境学报, 2026, 35(9): 1436-1444.
Chen Yingqiao, Guan Jingwen, Wang Yunyun, Yu Xingna. Characteristics and Source Apportionment of VOCs Considering Photochemical Loss in Urban Hangzhou during Summer[J]. Ecology and Environmental Sciences, 2026, 35(9): 1436-1444.
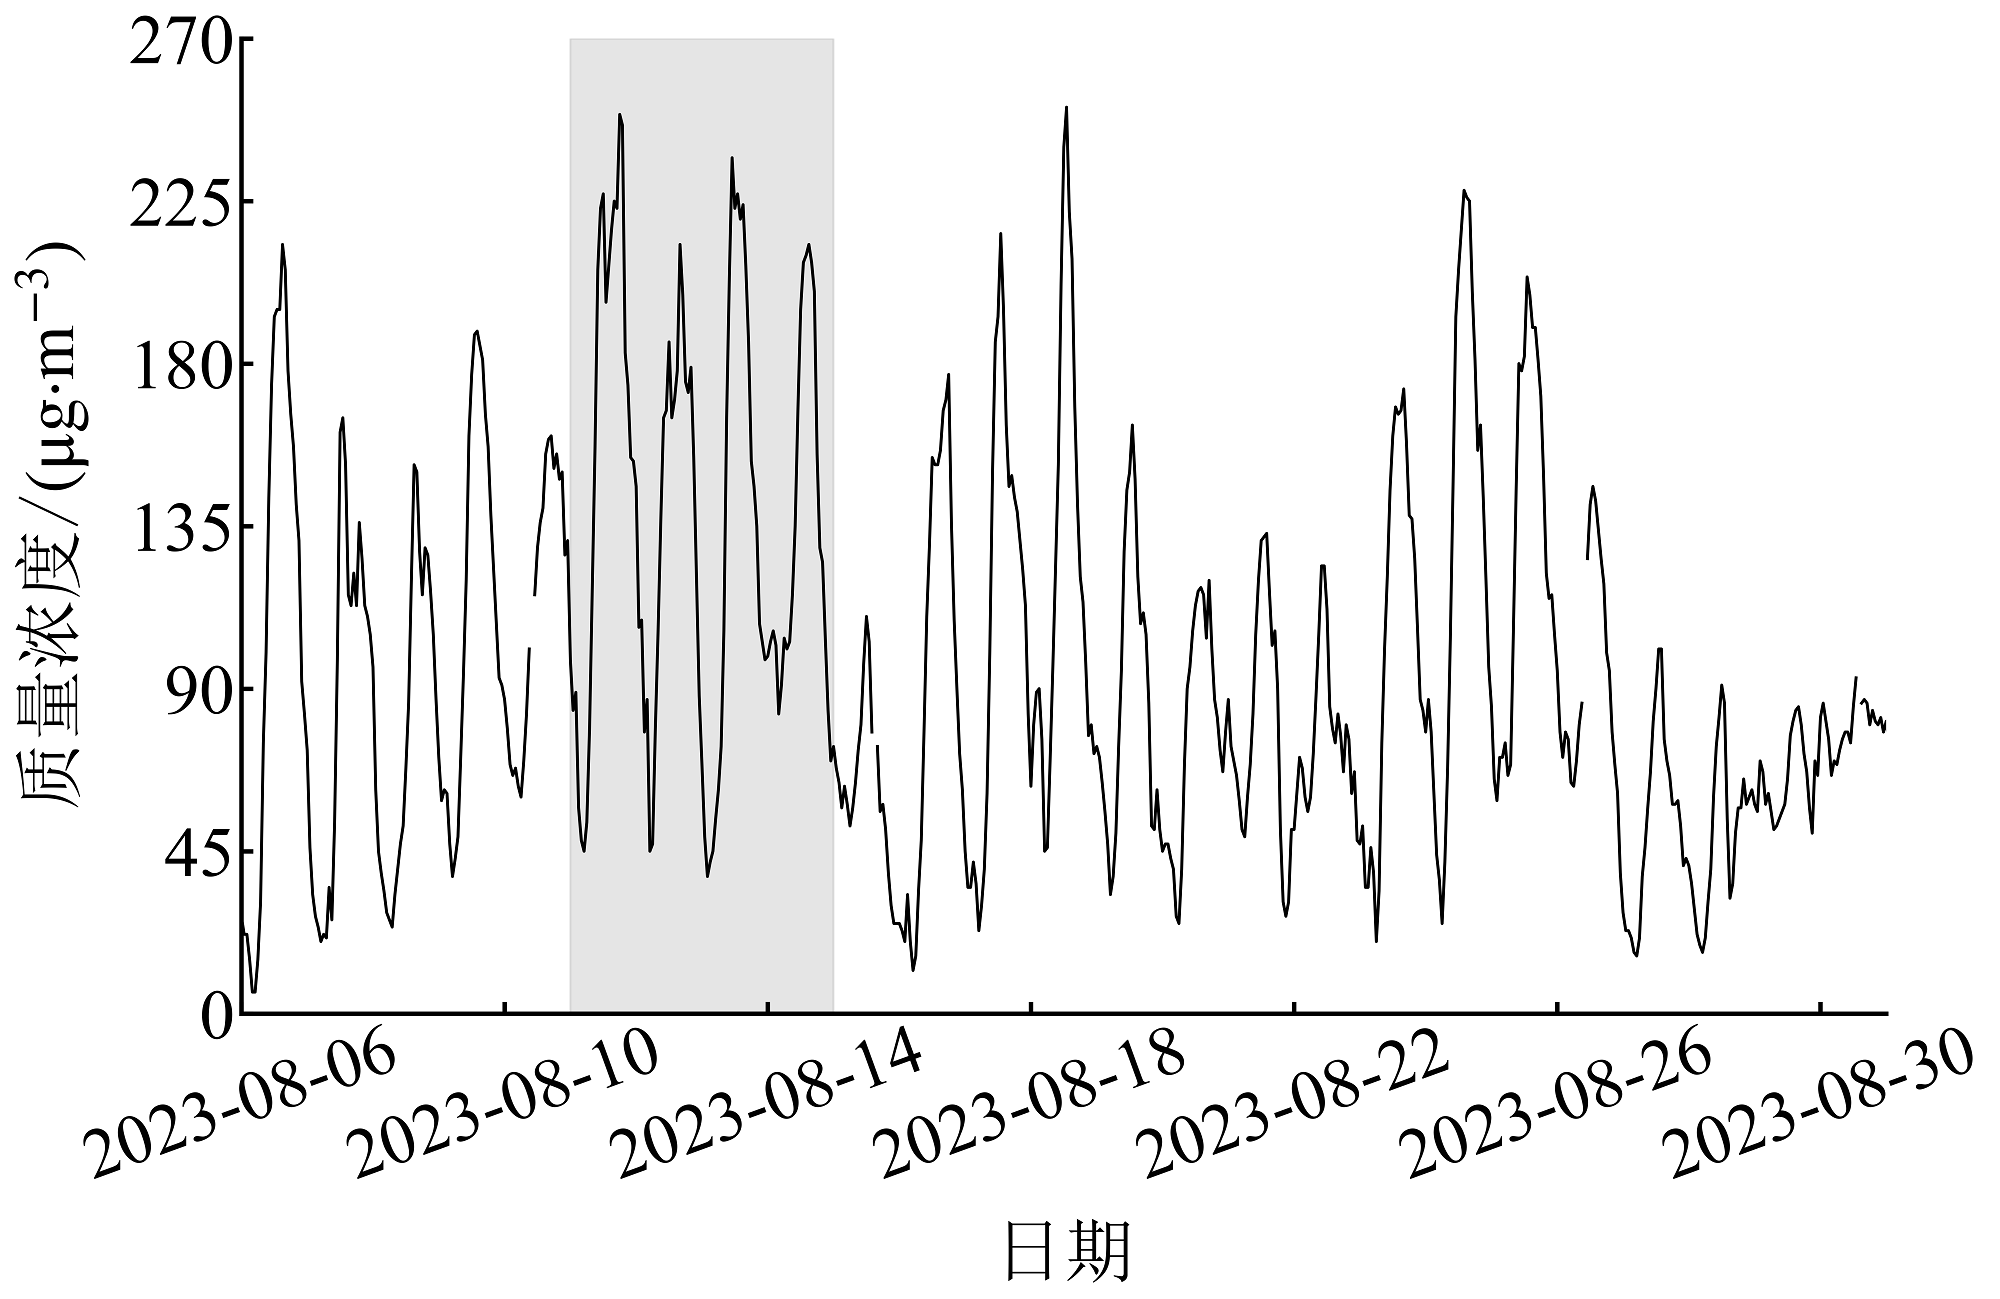
图1 观测期间O3时间序列
Figure 1 Time series of O3 during observation period
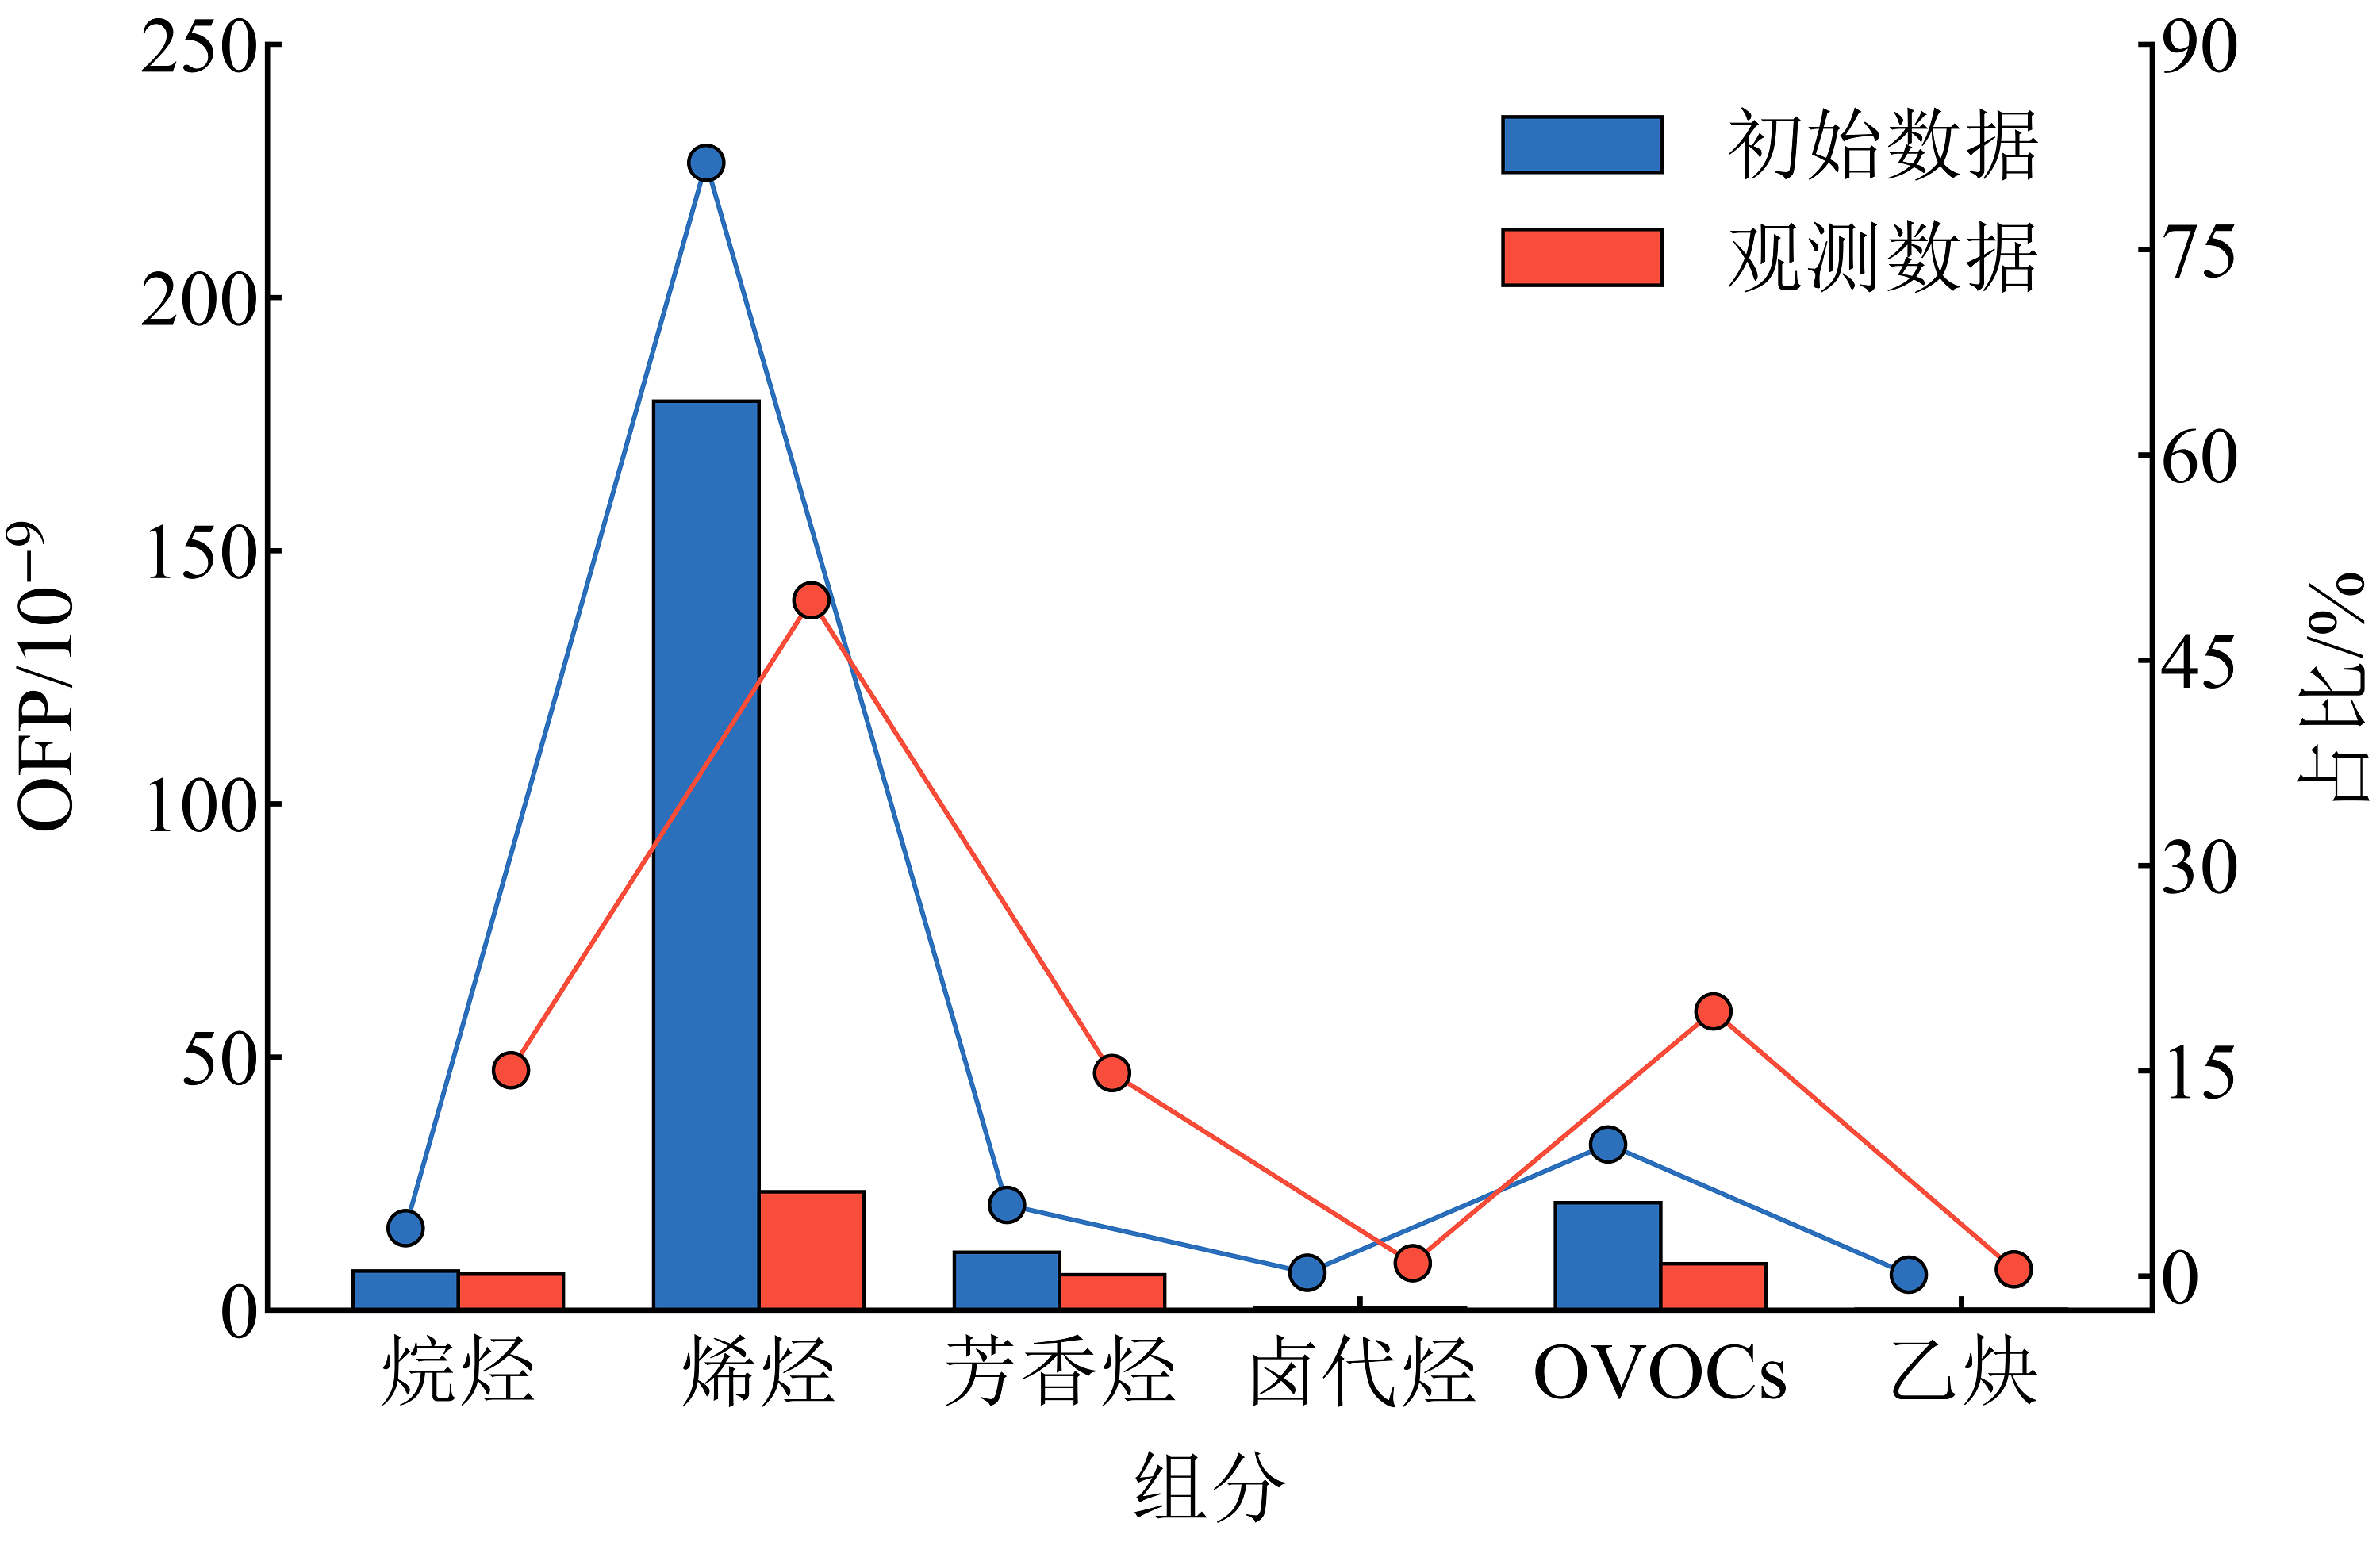
图2 基于初始与观测数据的VOCs各组分OFP值
Figure 2 OFP values of VOCs components based on initial and observed data
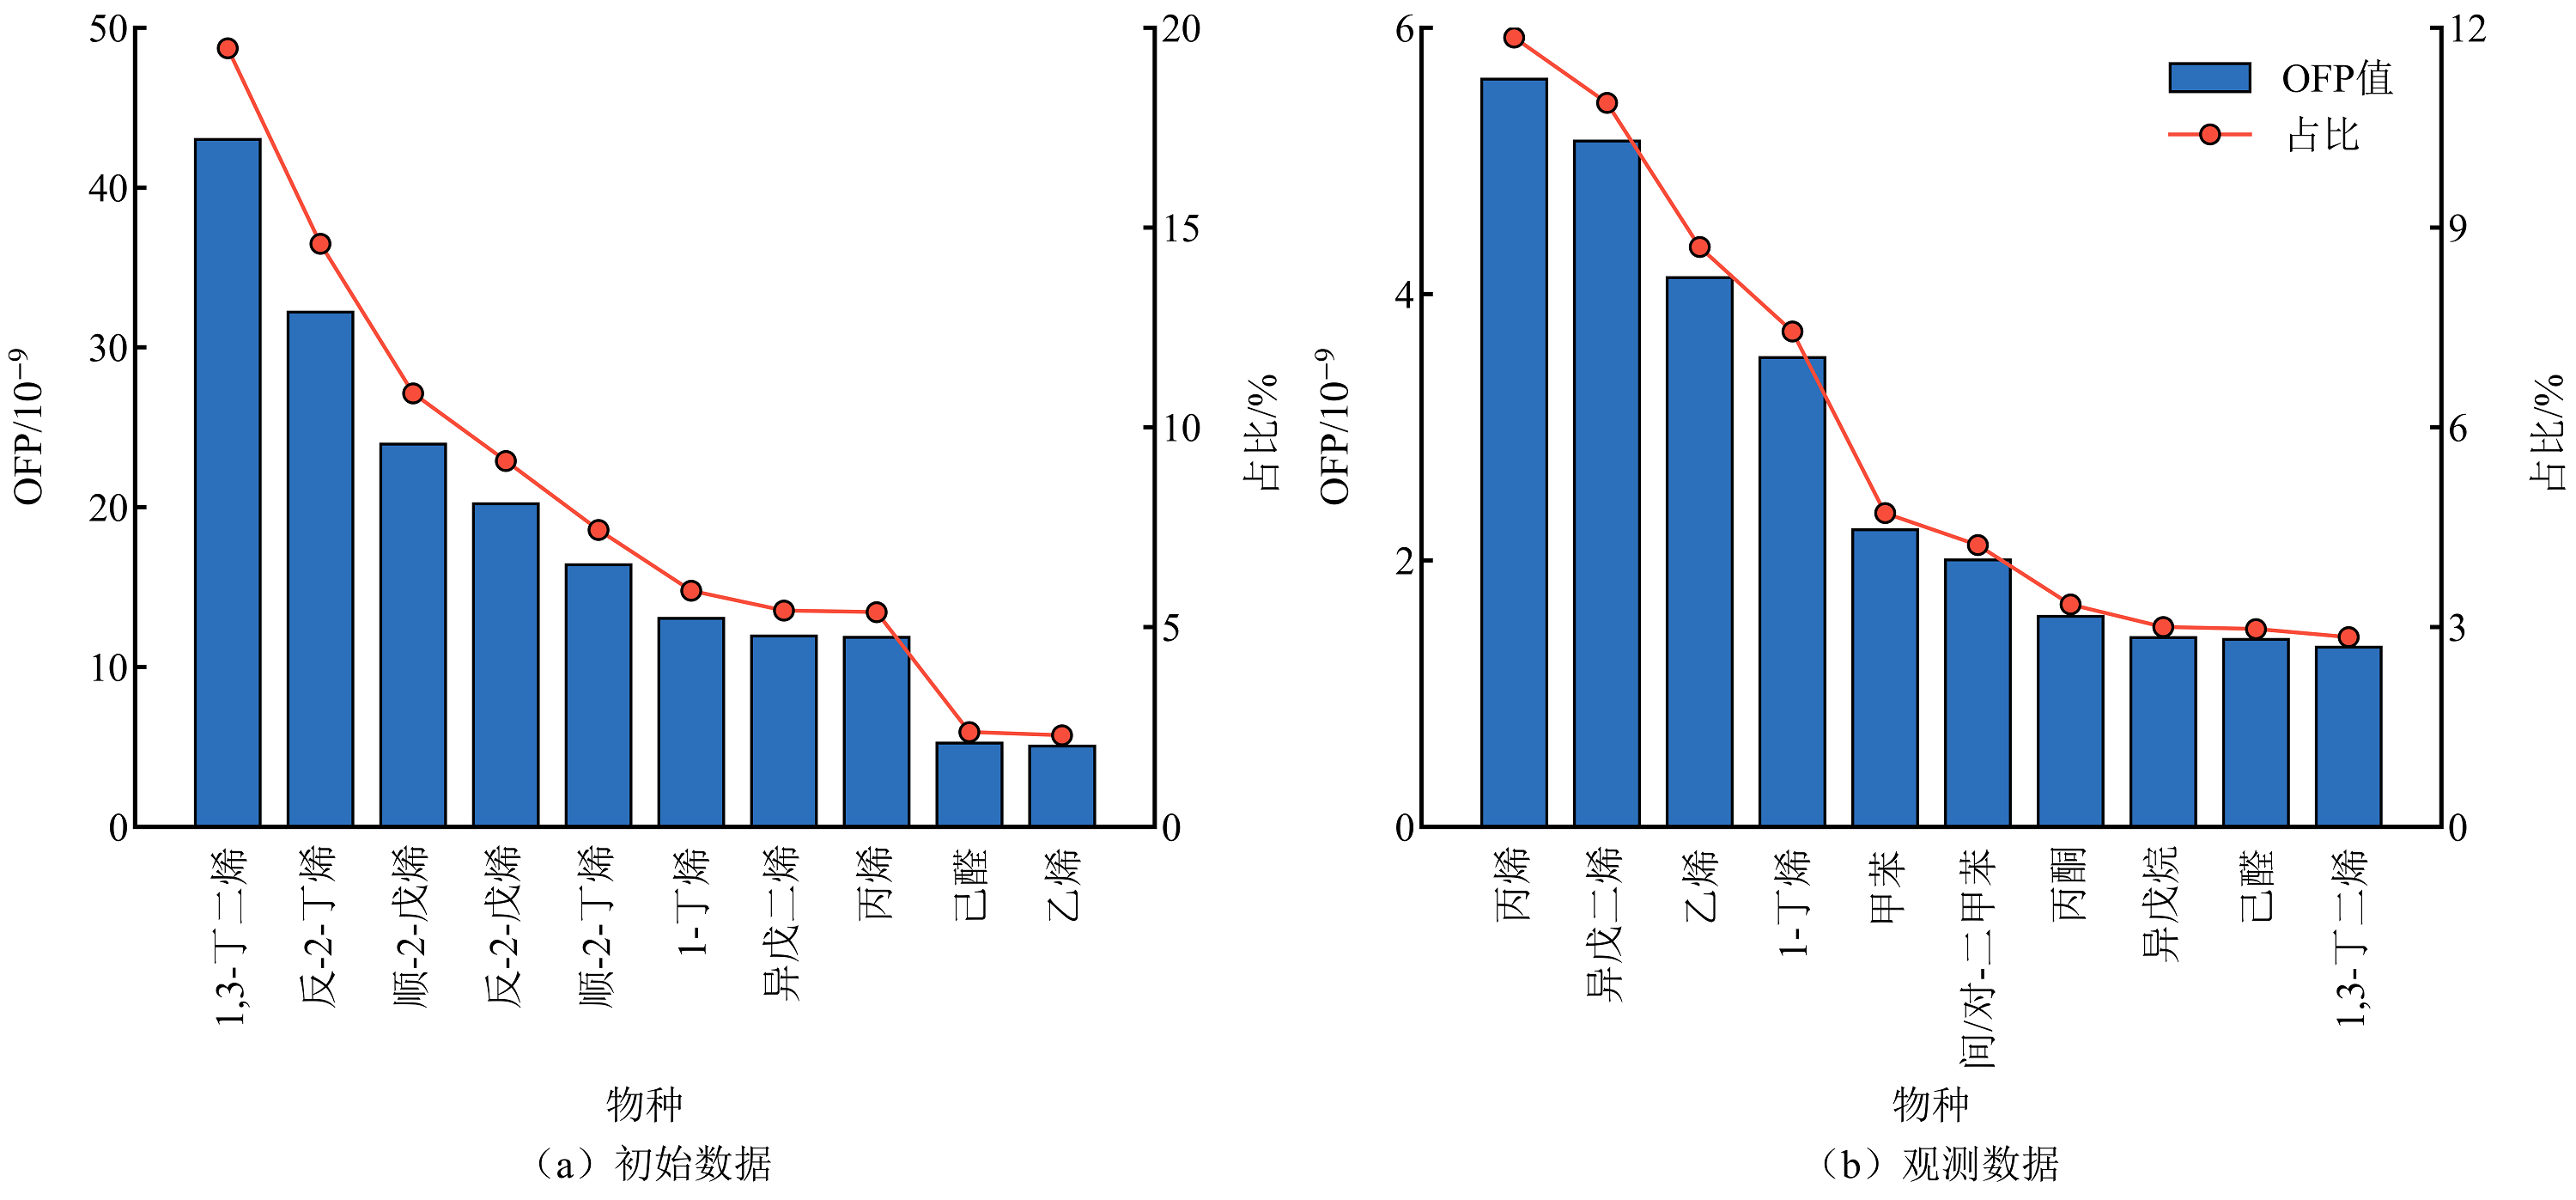
图3 基于初始与观测数据的OFP前10物种
Figure 3 Top 10 species of OFP based on initial and observed data
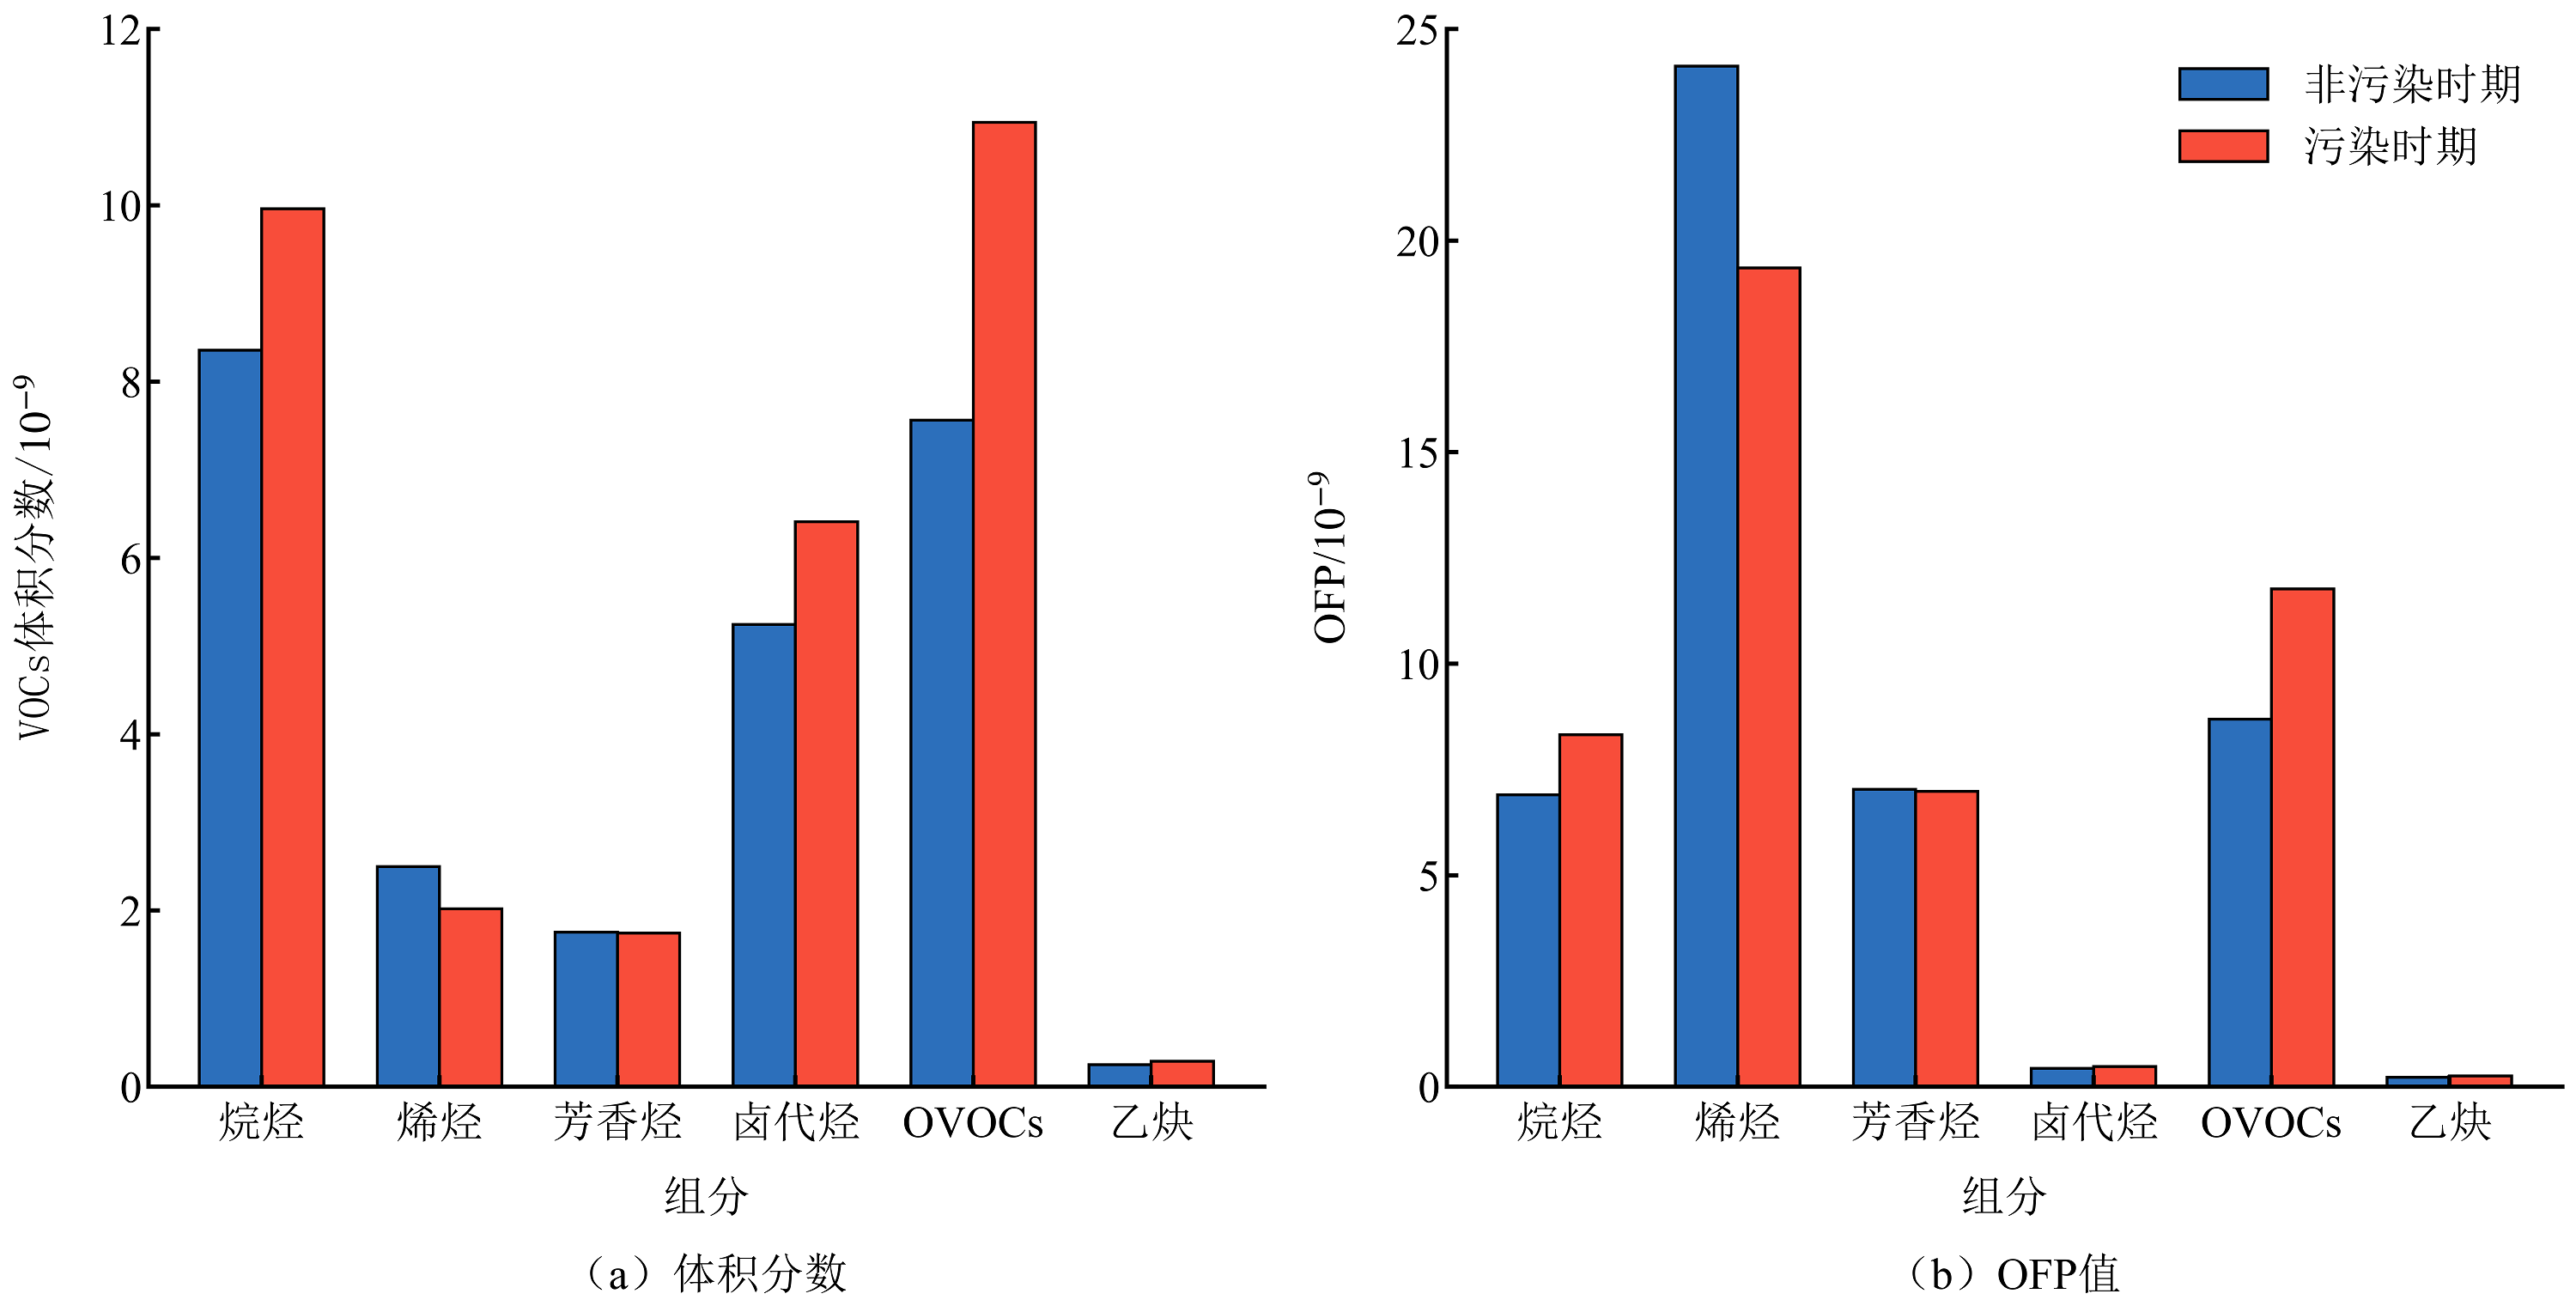
图4 非污染时期与污染时期的VOCs体积分数与OFP值
Figure 4 VOCs volume fraction and OFP values during non-polluted and polluted periods
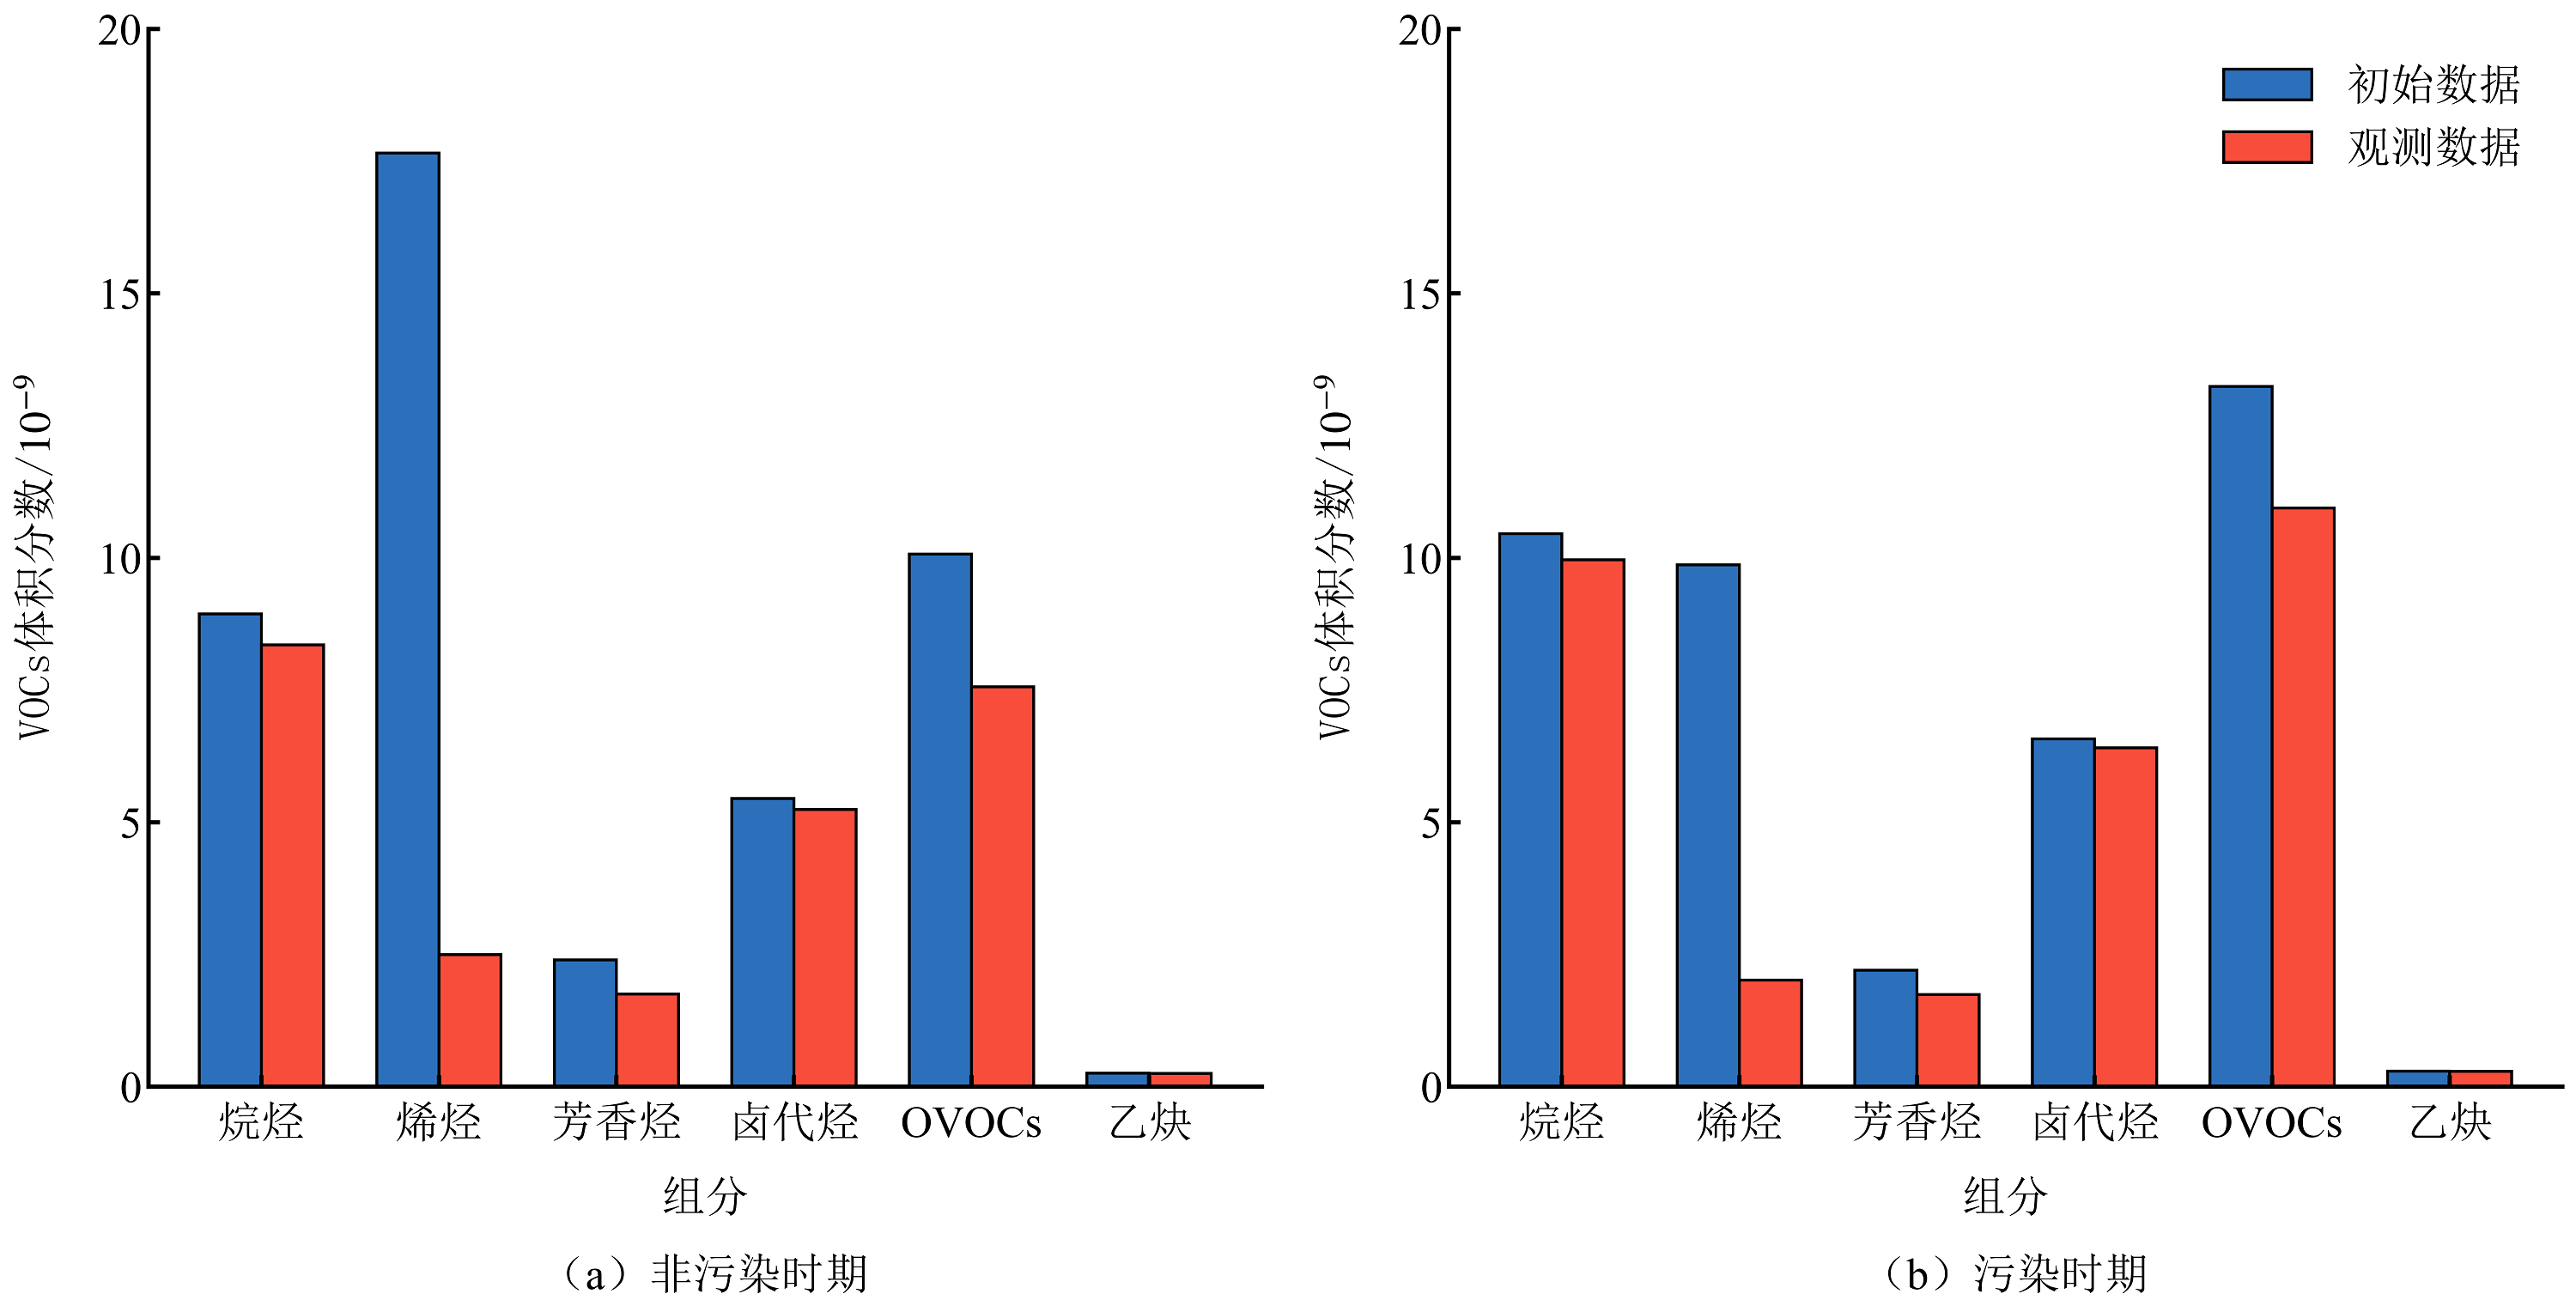
图5 非污染时期与污染时期的VOCs初始与观测数据
Figure 5 Initial and observed data of VOCs during non-polluted and polluted periods
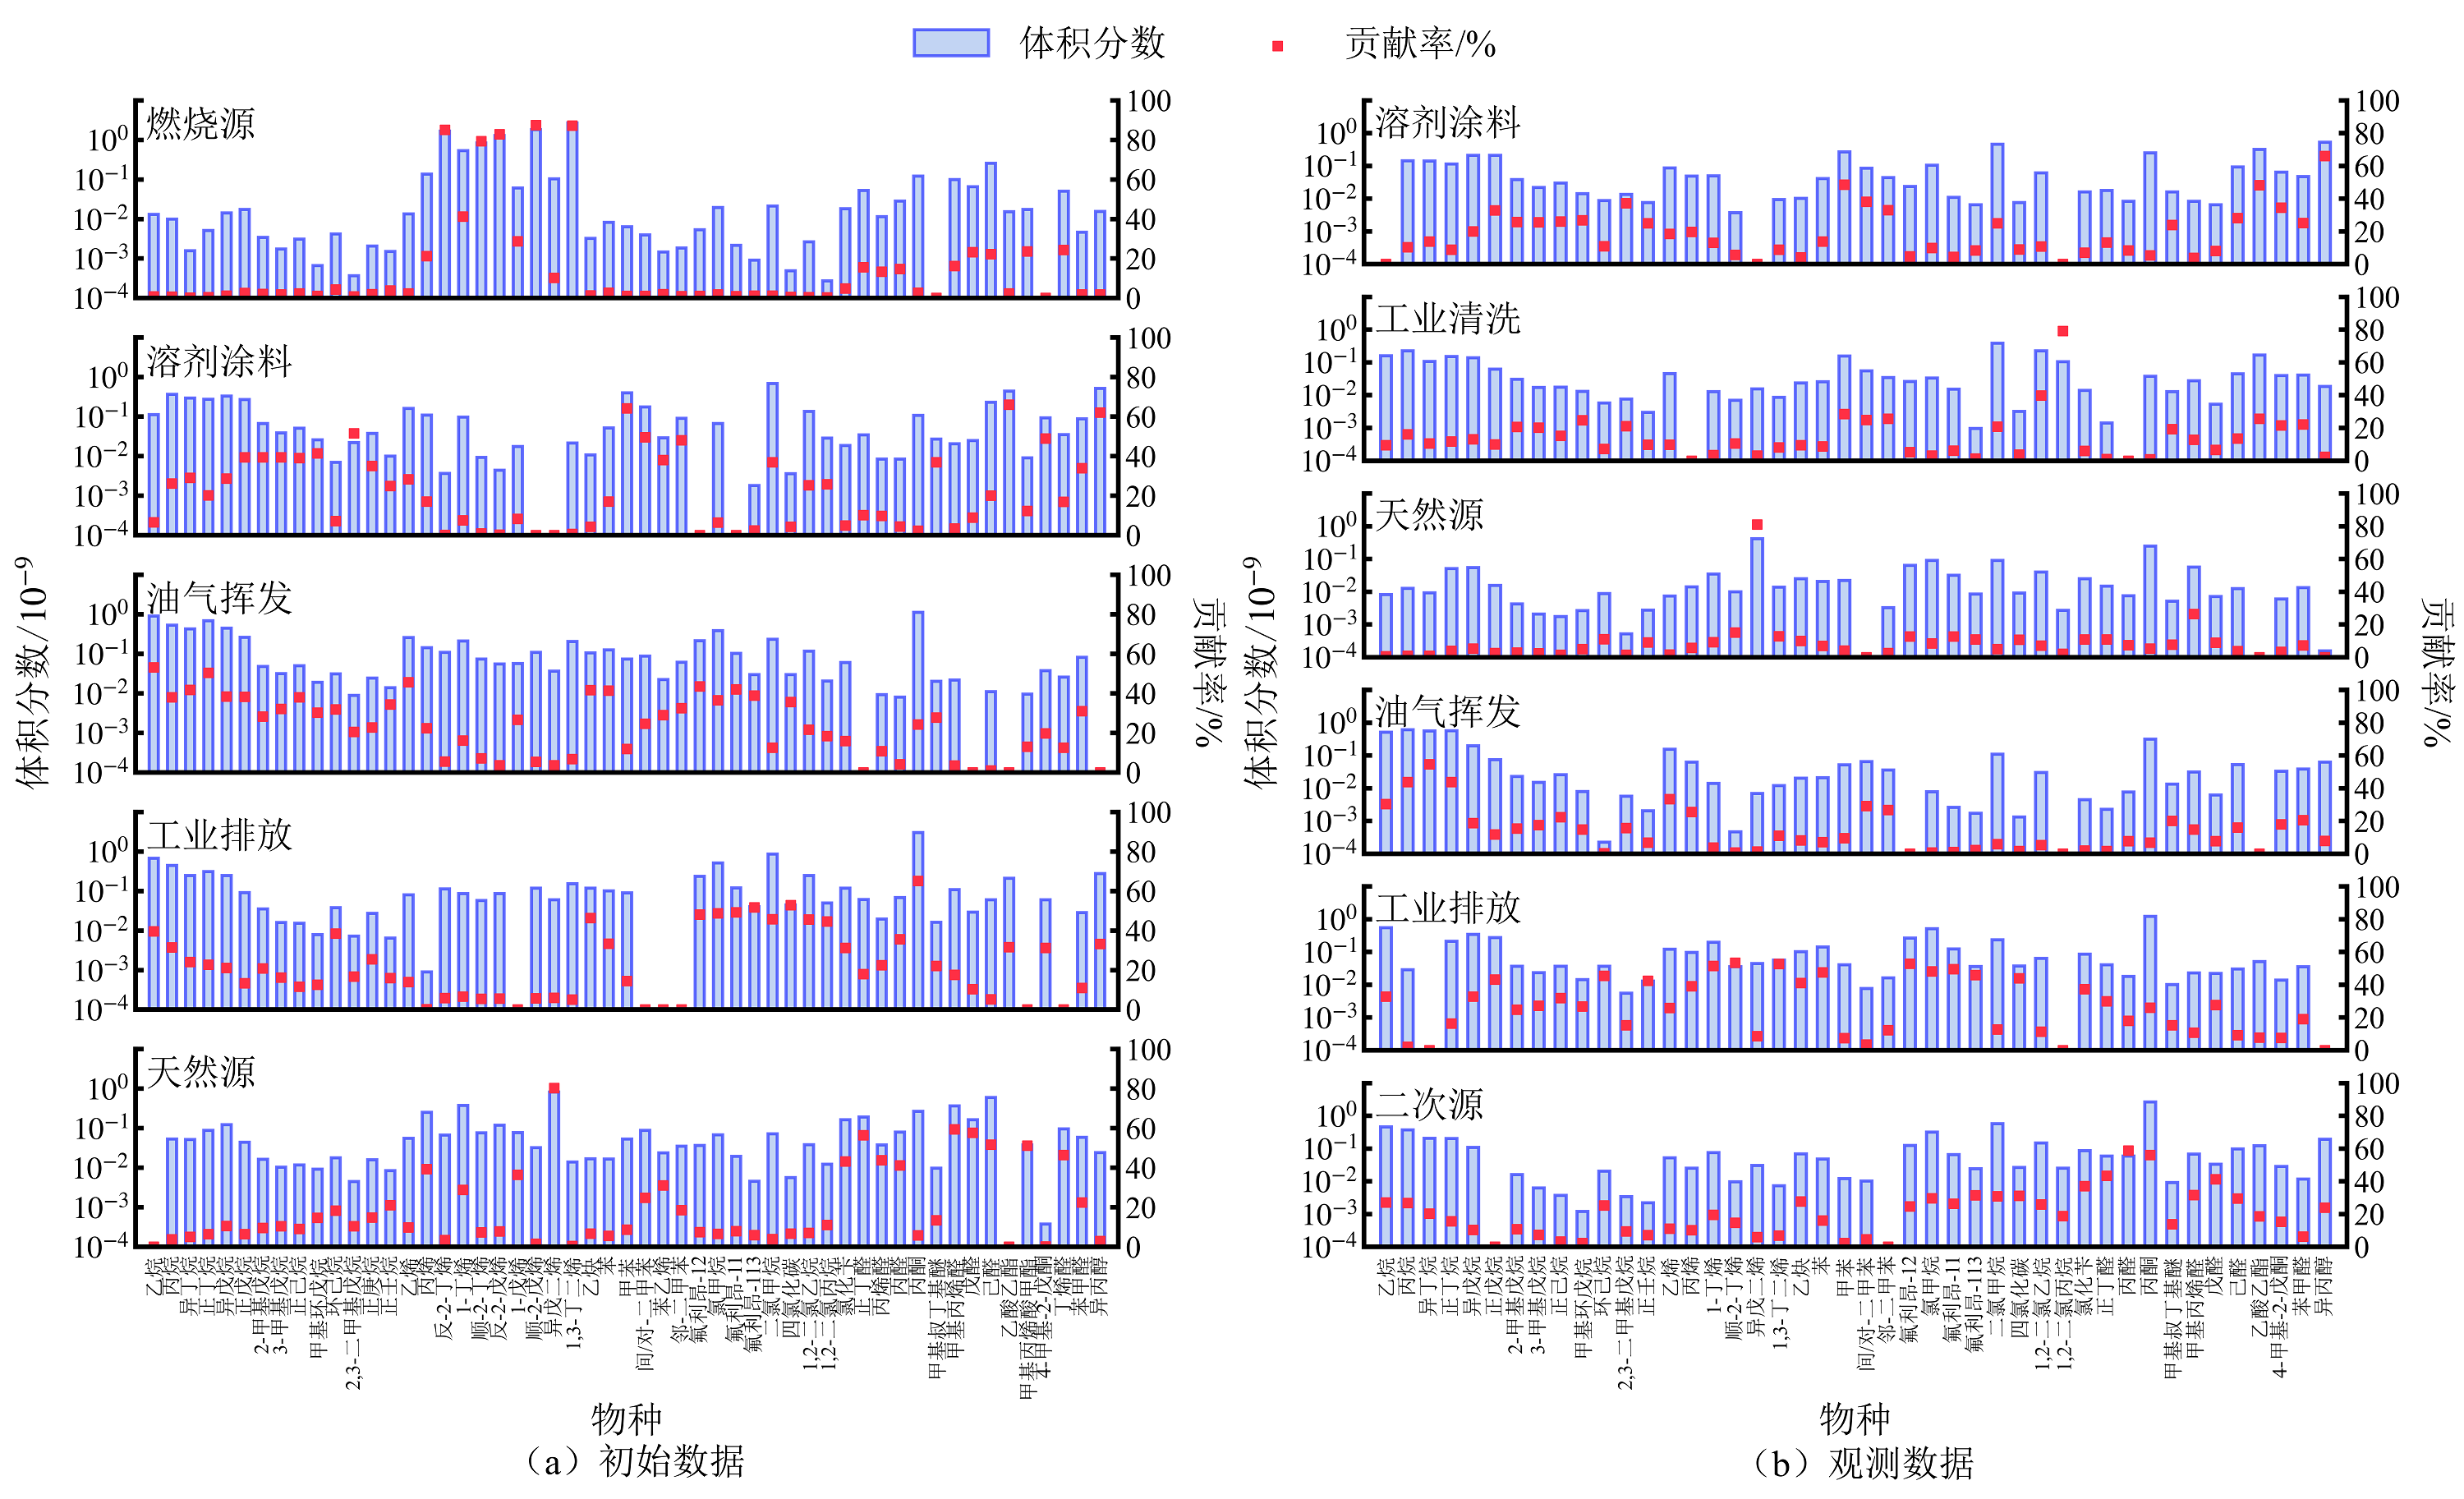
图6 基于初始与观测数据的PMF因子谱
Figure 6 PMF factor spectra based on initial and observed data
| [1] |
Atkinson R, Arey J, 2003. Atmospheric degradation of volatile organic compounds[J]. Chemical Reviews, 103(12): 4605-4638.
PMID |
| [2] |
Bossolasco A, Fernandez R P, Li Q Y, et al., 2025. Key role of short-lived halogens on global atmospheric oxidation during historical periods[J]. Environmental Science: Atmospheres, 5(5): 547-562.
DOI URL |
| [3] |
Carter W P L, 2010. Development of the SAPRC-07 chemical mechanism[J]. Atmospheric Environment, 44(40): 5324-5335.
DOI URL |
| [4] |
Cui M, An X Q, Xing L, et al., 2021. Simulated sensitivity of ozone generation to precursors in Beijing during a high O3 episode[J]. Advances in Atmospheric Sciences, 38(7): 1223-1237.
DOI |
| [5] | Liu B S, Gu Y, Wu Y T, et al., 2024. Review of source analyses of ambient volatile organic compounds considering reactive losses: Methods of reducing loss effects, impacts of losses, and sources[J]. Atmospheric Chemistry and Physics, 24(22): 12861-12879. |
| [6] |
Liu Y F, Yin S J, Zhang S Q, et al., 2024. Drivers and impacts of decreasing concentrations of atmospheric volatile organic compounds (VOCs) in Beijing during 2016-2020[J]. Science of The Total Environment, 906: 167847.
DOI URL |
| [7] |
Liu Z G, Wang B L, Wang C, et al., 2023. Characterization of photochemical losses of volatile organic compounds and their implications for ozone formation potential and source apportionment during summer in suburban Jinan, China[J]. Environmental Research, 238(Part 1): 117158.
DOI URL |
| [8] | Ma W, Feng Z M, Zhan J L, et al., 2022. Influence of photochemical loss of volatile organic compounds on understanding ozone formation mechanism[J]. Atmospheric Chemistry and Physics, 22(7): 4841-4851. |
| [9] |
McDonald B C, de Gouw J A, Gilman J B, et al., 2018. Volatile chemical products emerging as largest petrochemical source of urban organic emissions[J]. Science, 359(6377): 760-764.
DOI PMID |
| [10] |
Tan T, Xu X Y, Gu H X, et al., 2024. The characteristics, sources, and health risks of volatile organic compounds in an industrial area of Nanjing[J]. Toxics, 12(12): 868.
DOI URL |
| [11] |
Wang H L, Chen C H, Wang Q, et al., 2013. Chemical loss of volatile organic compounds and its impact on the source analysis through a two-year continuous measurement[J]. Atmospheric Environment, 80: 488-498.
DOI URL |
| [12] |
Wang X, Han Y, Tu X, et al., 2024. Distribution of volatile organic compounds (VOCs) in the urban atmosphere of Hangzhou, East China: Temporal variation, source attribution, and impact on the secondary formations of ozone and aerosol[J]. Frontiers in Environmental Science, 12: 1418948.
DOI URL |
| [13] |
Yang S D, Li X, Song M D, et al., 2021. Characteristics and sources of volatile organic compounds during pollution episodes and clean periods in the Beijing-Tianjin-Hebei region[J]. Science of The Total Environment, 799: 149491.
DOI URL |
| [14] |
Yang T, Liu B S, Yang Y, et al., 2022. Improved positive matrix factorization for source apportionment of volatile organic compounds in vehicular emissions during the Spring Festival in Tianjin, China[J]. Environmental Pollution, 303: 119122.
DOI URL |
| [15] |
Yao D, Wang Y H, Bai Z X, et al., 2024. Vertical distribution of VOCs in the boundary layer of the Lhasa valley and its impact on ozone pollution[J]. Environmental Pollution, 340(Part 2): 122786.
DOI URL |
| [16] | Yuan B, Shao M, de Gouw J, et al., 2012. Volatile organic compounds (VOCs) in urban air: How chemistry affects the interpretation of positive matrix factorization (PMF) analysis[J]. Journal of Geophysical Research: Atmospheres, 117(D24): 24302. |
| [17] |
Zhang L H, Li H, Wu Z H, et al., 2020. Characteristics of atmospheric volatile organic compounds in urban area of Beijing: Variations, photochemical reactivity and source apportionment[J]. Journal of Environmental Sciences, 95: 190-200.
DOI PMID |
| [18] | Zhao Q Y, Bi J, Liu Q, et al., 2020. Sources of volatile organic compounds and policy implications for regional ozone pollution control in an urban location of Nanjing, East China[J]. Atmospheric Chemistry and Physics, 20(6): 3905-3919. |
| [19] |
Zhu H L, Wang H L, Jing S G, et al., 2018. Characteristics and sources of atmospheric volatile organic compounds (VOCs) along the mid-lower Yangtze River in China[J]. Atmospheric Environment, 190: 232-240.
DOI URL |
| [20] | 曹想, 李跃武, 赵梦飞, 等, 2024. 上海西南某工业区夏季臭氧污染时期挥发性有机物特征及来源分析[J]. 环境污染与防治, 46(6): 796-802. |
| Cao X, Li Y W, Zhao M F, et al., 2024. The characteristics and source apportionment of VOCs during ozone polluted period in summer in an industrial area of southwest Shanghai[J]. Environmental Pollution and Control, 46(6): 796-802. | |
| [21] | 方莉, 刘文文, 陈丹妮, 等, 2019. 北京市典型溶剂使用行业VOCs成分谱[J]. 环境科学, 40(10): 4395-4403. |
| Fang L, Liu W W, Chen D N, et al., 2019. Source profiles of volatile organic compounds (VOCs) from typical solvent-based industries in Beijing[J]. Environmental Science, 40(10): 4395-4403. | |
| [22] | GB 3095-2012 环境空气质量标准[S/OL]. https://www.mee.gov.cn/ywgz/fgbz/bz/bzwb/dqhjbh/dqhjzlbz/201203/W020250407403788086276.pdf. |
| GB 3095-2012 Ambient air quality standards[S/OL]. https://www.mee.gov.cn/ywgz/fgbz/bz/bzwb/dqhjbh/dqhjzlbz/201203/W020250407403788086276.pdf. | |
| [23] | 国务院, 2023. 国务院关于印发《空气质量持续改善行动计划》的通知[EB/OL]. (2023-12-7) [2026-8-3]. https://www.gov.cn/zhengce/zhengceku/202312/content_6919001.htm. |
| The State Council, 2023. Under the state council concerning the action plan for continuous improvement of air quality [EB/OL]. (2023-12-7) [2026-8-3]. https://www.gov.cn/zhengce/zhengceku/202312/content_6919001.htm. | |
| [24] | HJ 1010-2018 环境空气挥发性有机物气相色谱连续监测系统技术要求及检测方法[S/OL]. https://www.mee.gov.cn/ywgz/fgbz/bz/bzwb/jcffbz/201901/W020190425530519795003.pdf |
| HJ 1010-2018 Specifications and test procedures for ambient air quality continuous monitoring system with gas chromatography for volatile organic compounds[S/OL]. https://www.mee.gov.cn/ywgz/fgbz/bz/bzwb/jcffbz/201901/W020190425530519795003.pdf | |
| [25] | 何立志, 谢诚, 肖正辉, 2024. 湘潭市城区夏季VOCs光化学损耗特征及来源解析[J]. 环境科学与技术, 47(3): 101-110. |
| He L Z, Xie C, Xiao Z H, 2024. Characteristics of photochemical loss and VOCs source apportionment of urban area of Xiangtan city in summer[J]. Environmental Science and Technology, 47(3): 101-110. | |
| [26] | 景盛翱, 高雅琴, 沈建东, 等, 2020. 杭州市城区挥发性有机物污染特征及反应活性[J]. 环境科学, 41(12): 5306-5315. |
|
Jing S A, Gao Y Q, Shen J D, et al., 2020. Characteristics and reactivity of ambient VOCs in urban Hangzhou, China[J]. Environmental Science, 41(12): 5306-5315.
DOI URL |
|
| [27] | 孔翠丽, 吴雨彤, 顾瑶, 等, 2023. 基于化学损耗矫正的青岛胶州市环境VOCs来源解析[J]. 环境科学, 44(12): 6551-6563. |
| Kong C L, Wu Y T, Gu Y, et al., 2023. Source apportionment of ambient VOCs in Qingdao based on photochemical loss correction[J]. Environmental Science, 44(12): 6551-6563. | |
| [28] | 林洁萍, 张亮, 范绍佳, 等, 2025. 珠海市2021-2023年挥发性有机物污染特征及来源解析[J]. 环境科学学报, 45(6): 293-303. |
| Lin J P, Zhang L, Fan S J, et al., 2025. Characteristics and source analysis of VOCs pollution in Zhuhai from 2021 to 2023[J]. Acta Scientiae Circumstantiae, 45(6): 293-303. | |
| [29] | 孟祥来, 孙扬, 廖婷婷, 等, 2022. 北京市城区夏季VOCs变化特征分析与来源解析[J]. 环境科学, 43(9): 4484-4496. |
| Meng X L, Sun Y, Liao T T, et al., 2022. Characteristic analysis and source apportionment of VOCs in urban areas of Beijing in summer[J]. Environmental Science, 43(9): 4484-4496. | |
| [30] | 缪芯蕊, 刘诚, 陈辛, 等, 2026. 连云港市某工业园大气VOCs污染特征及来源解析[J]. 地球与环境, 54(2): 230-243. |
|
Miao X R, Liu C, Chen X, et al., 2026. Characterization and Source Identification of Volatile Organic Compounds (VOCs) pollution in an industrial park in Lianyungang city[J]. Earth and Environment, 54(2): 230-243.
DOI URL |
|
| [31] | 钱思瑶, 关净文, 关璐, 等, 2024. 杭州市大气VOCs组成特征及二次污染生成贡献[J]. 中国环境科学, 44(4): 1921-1928. |
| Qian S Y, Guan J W, Guan L, et al., 2024. Composition characteristics of volatile organic compounds and contribution to secondary pollution formation in Hangzhou[J]. China Environmental Science, 44(4): 1921-1928. | |
| [32] | 宋鑫, 袁斌, 王思行, 等, 2023. 珠三角典型工业区挥发性有机物 (VOCs) 组成特征: 含氧挥发性有机物的重要性[J]. 环境科学, 44(3): 1336-1345. |
| Song X, Yuan B, Wang S H, et al., 2023. Compositional characteristics of volatile organic compounds in typical industrial areas of the Pearl River Delta: Importance of oxygenated volatile organic compounds[J]. Environmental Science, 44(3): 1336-1345. | |
| [33] | 王成辉, 陈军辉, 韩丽, 等, 2020. 成都市城区大气VOCs季节污染特征及来源解析[J]. 环境科学, 41(9): 3951-3960. |
| Wang C H, Chen J H, Han L, et al., 2020. Seasonal pollution characteristics and analysis of the sources of atmospheric VOCs in Chengdu urban area[J]. Environmental Science, 41(9): 3951-3960. | |
| [34] | 王振涛, 龙腾飞, 崔阳, 等, 2024. 晋中市夏季典型臭氧污染事件中VOCs化学特征与来源分析[J]. 环境科学学报, 44(10): 91-102. |
| Wang Z T, Long T F, Cui Y, et al., 2024. Characteristics and source analysis of VOCs components during a typical summer ozone pollution event in Jinzhong[J]. Acta Scientiae Circumstantiae, 44(10): 91-102. | |
| [35] | 吴浩然, 彭杏, 符楠, 等, 2024. 深圳市夏季大气挥发性有机物的光化学反应特征及来源解析[J]. 中国环境科学, 44(8): 4145-4154. |
| Wu H R, Peng X, Fu N, et al., 2024. Photochemical reaction characteristics and source apportionment of atmospheric volatile organic compounds during summer in Shenzhen[J]. China Environmental Science, 44(8): 4145-4154. | |
| [36] | 肖致美, 徐虹, 高璟贇, 等, 2022. 天津市PM2.5-O3复合污染特征及来源分析[J]. 环境科学, 43(3): 1140-1150. |
| Xiao Z M, Xu H, Gao J Y, et al., 2022. Characteristics and sources of PM2.5-O3 compound pollution in Tianjin[J]. Environmental Science, 43(3): 1140-1150. | |
| [37] | 徐娇, 王鹏, 刘保双, 等, 2025. 江西典型工业城市秋季VOCs光化学损耗特征及其来源解析研究[J]. 环境科学学报, 45(10): 77-92. |
| Xu J, Wang P, Liu B S, et al., 2025. Study of characteristics and source apportionment of autumn VOC photochemical losses in a typical industrial city in Jiangxi Province[J]. Acta Scientiae Circumstantiae, 45(10): 77-92. | |
| [38] | 张淳, 胡岩, 张霖琳, 等, 2025. 典型工业园区夏季VOCs排放特征及对臭氧污染影响研究[J]. 环境监控与预警, 17(4): 108-115, 123. |
| Zhang C, Hu Y, Zhang L L, et al., 2025. Summer VOCs emission characteristics of typical industrial parks and their effects on ozone pollution[J]. Environmental Monitoring and Forewarning, 17(4): 108-115, 123. | |
| [39] | 张涵, 姜华, 高健, 等, 2022. 我国大气O3污染成因及影响因素综述[J]. 环境科学研究, 35(12): 2657-2665. |
| Zhang H, Jiang H, Gao J, et al., 2022. Review on causes and influencing factors of O3 pollution in China[J]. Research of Environmental Sciences, 35(12): 2657-2665. | |
| [40] | 张良瑜, 母应锋, 朱志锋, 等, 2023. 南京市大气VOCs污染特征及来源解析[J]. 环境监控与预警, 15(5): 128-133. |
| Zhang L Y, Mu Y F, Zhu Z F, et al., 2023. Pollution characteristics and source apportionment of atmospheric VOCs in Nanjing[J]. Environmental Monitoring and Forewarning, 15(5): 128-133. | |
| [41] | 赵月, 2024. 长三角典型城市臭氧污染特征及VOCs来源解析[J]. 环境科学研究, 37(7): 1500-1512. |
| Zhao Y, 2024. Analysis of Variation Characteristics and source of atmospheric ozone pollution in the Yangtze River Delta region[J]. Research of Environmental Sciences, 37(7): 1500-1512. | |
| [42] | 浙江省生态环境厅, 2024. 2023年浙江省生态环境状况公报[EB/OL]. (2024-6-5) [2026-8-3]. https://sthjt.zj.gov.cn/art/2024/6/5/art_1229589222_58956110.html. |
| Department of Ecology and Environment of Zhejiang Province, 2024. 2023 Zhejiang Provincial Ecological Environment Status Bulletin [EB/OL]. (2024-6-5) [2026-8-3]. https://sthjt.zj.gov.cn/art/2024/6/5/art_1229589222_58956110.html. | |
| [43] | 中华人民共和国环境保护部, 2018. 国务院关于印发打赢蓝天保卫战三年行动计划的通知[EB/OL]. (2018-7-3) [2026-8-3]. https://www.gov.cn/zhengce/content/2018-07/03/content_5303158.htm. |
| Ministry of Environmental Protection of the People’s Republic of China, 2018. Three-year action plan to fight air pollution [EB/OL]. (2018-7-3) [2026-8-3]. https://www.gov.cn/zhengce/content/2018-07/03/content_5303158.htm. |
| [1] | 杜若愚, 马潇瑶, 陈江耀. 基于NO+ PTR-QMS在线观测评估广州市夏季大气VOCs的光化学损失及二次环境效应[J]. 生态环境学报, 2026, 35(1): 112-123. |
| [2] | 付守琪, 余朝毅, 邬乐欢, 张琪, 袁筱茜, 杨钢洪, 潘月鹏. 基于WRF-CAMx模型的舟山群岛新区大气环境承载力测算及多污染物协同控制研究[J]. 生态环境学报, 2026, 35(1): 88-98. |
| [3] | 张蔷, 李令军, 鹿海峰, 刘保献, 李琪, 王涵霖. 北京地区9种典型绿化树种的BVOCs释放及二次污染生成潜势[J]. 生态环境学报, 2025, 34(9): 1432-1441. |
| [4] | 包雪儿, 包海, 赵玲玲, 昂给拉玛. 内蒙古高原农作物挥发性有机物排放特征[J]. 生态环境学报, 2025, 34(9): 1442-1451. |
| [5] | 陈思宇, 孙丽娟, 苏枞枞, 于兴娜. 太原市春夏季VOCs组成特征及其对二次有机气溶胶和臭氧的贡献[J]. 生态环境学报, 2025, 34(4): 548-555. |
| [6] | 张洋洋, 刘学军. 北京城区冬季大气氨浓度、来源及启示[J]. 生态环境学报, 2025, 34(10): 1579-1587. |
| [7] | 王聪聪, 张小玲, 雷雨, 黄小娟, 王婧怡, 尹黎昊, 王传扬. 基于WRF-CMAQ模型的四川盆地春季持续臭氧污染过程中PM2.5组分解析[J]. 生态环境学报, 2024, 33(8): 1214-1226. |
| [8] | 吴文伟, 沈城, 沙晨燕, 林匡飞, 吴健, 谢雨晴, 周璇. 城市工业地块土壤重金属污染风险评价与源解析[J]. 生态环境学报, 2024, 33(5): 791-801. |
| [9] | 张淼, 王桂霞, 王昌伟, 贺艳云, 许艳芳, 李琪, 许杨, 张俊骁, 张桂芹. 济南市区黑碳污染变化特征及来源解析[J]. 生态环境学报, 2024, 33(4): 560-572. |
| [10] | 高星星, 包海, 丁艳旭. 夏季呼和浩特市生物源挥发性有机物排放速率空间分布[J]. 生态环境学报, 2024, 33(12): 1902-1913. |
| [11] | 蒋伯琪, 浮天, 程昳璇, 苏枞枞, 沈建东, 于谨铖, 于兴娜. 沈阳市臭氧污染特征及其影响因素[J]. 生态环境学报, 2024, 33(1): 72-79. |
| [12] | 王传扬, 张小玲, 兰琳惠, 潘婕. 2022年夏季高温干旱对四川盆地污染物浓度变化的影响分析[J]. 生态环境学报, 2024, 33(1): 80-91. |
| [13] | 许肖云, 饶芝菡, 蒋红斌, 张巍, 陈超, 杨永安, 胡艳丽, 魏海川. 遂宁工业园区夏季VOCs污染特征及其对O3、SOA生成潜势研究[J]. 生态环境学报, 2023, 32(5): 956-968. |
| [14] | 李姝亭, 胡冠九, 罗小三. 大气环境中全(多)氟烷基化合物(PFASs)的来源、分布及健康风险研究进展[J]. 生态环境学报, 2023, 32(12): 2103-2114. |
| [15] | 黄国锋, 贺斌, 谢志宜, 刘军, 王安侯, 廖彤, 王博瑾, 郝贝贝. 广东省农业源污染对水环境的影响及其空间分异格局[J]. 生态环境学报, 2023, 32(12): 2207-2215. |
| 阅读次数 | ||||||
|
全文 |
|
|||||
|
摘要 |
|
|||||
